. 2022 Jun 27;13(1):3671.
doi: 10.1038/s41467-022-31238-y.

Combinatorial immunotherapies overcome MYC-driven immune evasion in triple negative breast cancer

Affiliations

Combinatorial immunotherapies overcome MYC-driven immune evasion in triple negative breast cancer

Joyce V Lee et al. Nat Commun. .

Erratum in

Abstract

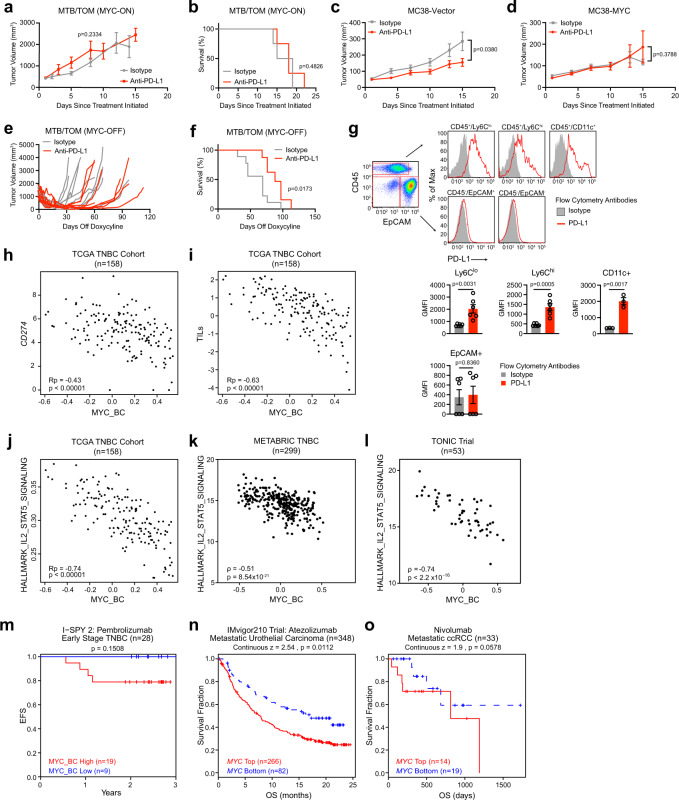
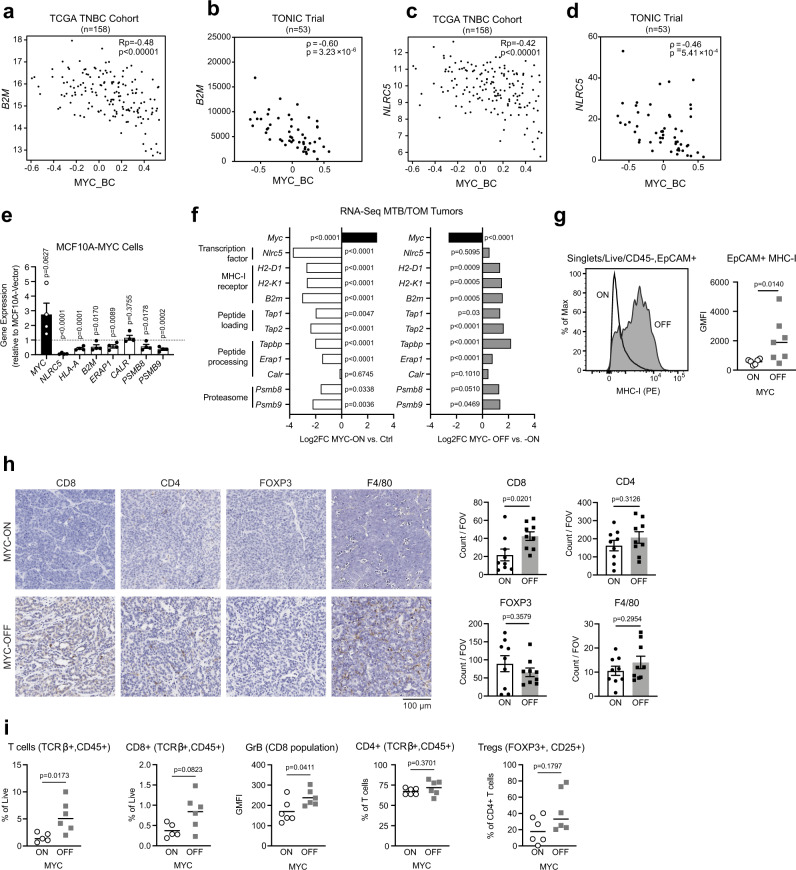
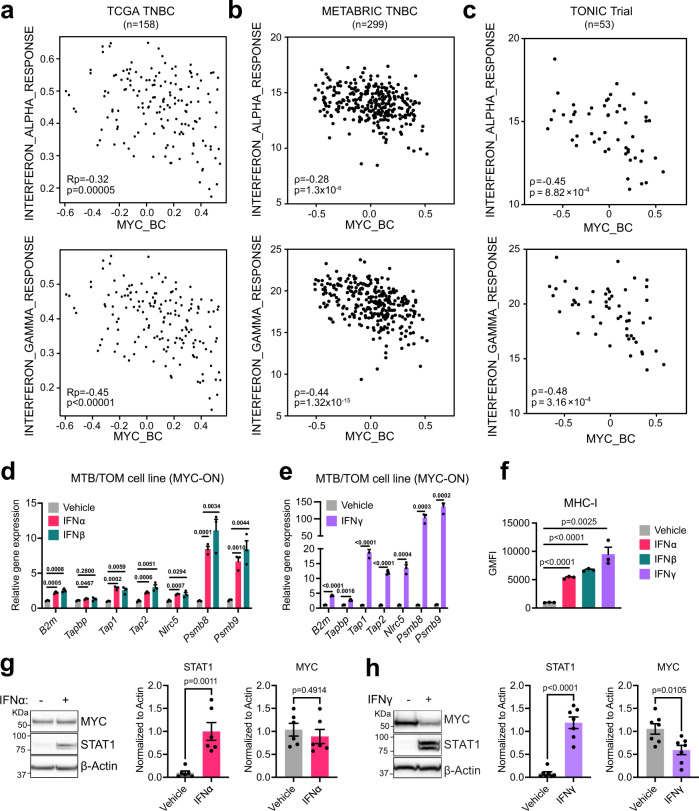
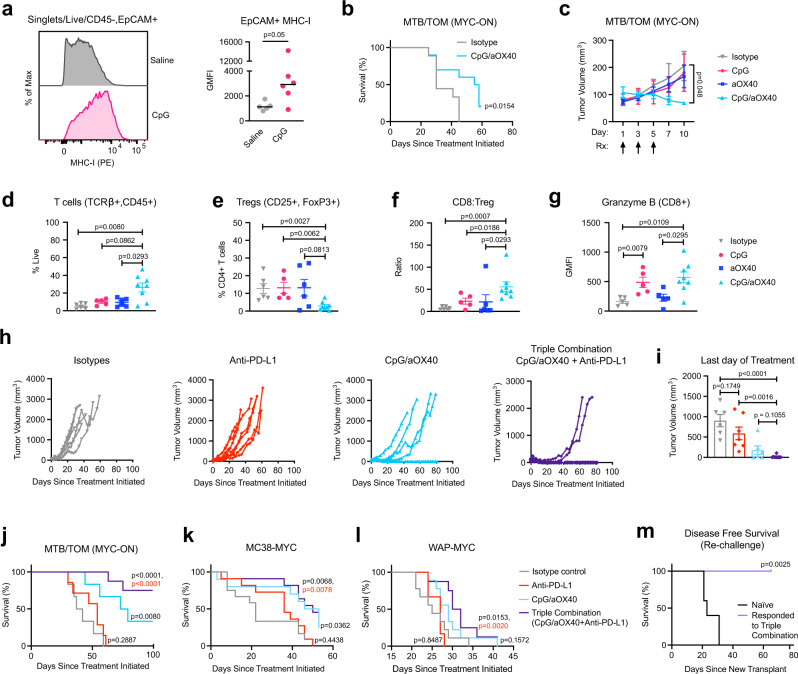
Few patients with triple negative breast cancer (TNBC) benefit from immune checkpoint inhibitors with complete and durable remissions being quite rare. Oncogenes can regulate tumor immune infiltration, however whether oncogenes dictate diminished response to immunotherapy and whether these effects are reversible remains poorly understood. Here, we report that TNBCs with elevated MYC expression are resistant to immune checkpoint inhibitor therapy. Using mouse models and patient data, we show that MYC signaling is associated with low tumor cell PD-L1, low overall immune cell infiltration, and low tumor cell MHC-I expression. Restoring interferon signaling in the tumor increases MHC-I expression. By combining a TLR9 agonist and an agonistic antibody against OX40 with anti-PD-L1, mice experience tumor regression and are protected from new TNBC tumor outgrowth. Our findings demonstrate that MYC-dependent immune evasion is reversible and druggable, and when strategically targeted, may improve outcomes for patients treated with immune checkpoint inhibitors.


Conflict of interest statement

The authors declare no competing interests.

Figures

Fig. 1
Fig. 1. MYC predicts poor response to immune checkpoint inhibitors.
a Average tumor volume for MTB/TOM tumors treated with anti-PD-L1 or isotype antibody while fed doxycycline chow (MYC-ON state). Mean ± S.E.M; two-sided unpaired t-test on day 8, isotype (n = 3), anti-PD-L1 (n = 4). b Survival (ethical tumor endpoint, length: 20 mm). Log rank test, isotype (n = 4), anti-PD-L1 (n = 8). c Average tumor volumes for animals bearing MC38-vector tumors. Mean ± S.E.M, two-sided unpaired t-test tumor volume on day 15 (isotype n = 8, anti-PD-L1 n = 10). d Average tumor volumes for animals bearing MC38-MYC tumors. Mean ± S.E.M, two-sided unpaired t-test tumor volume on day 15 (n = 6/treatment). e Individual tumor volumes graphed during doxycycline chow removal (MYC-OFF) and either anti-PD-L1 (n = 8) or isotype control antibody (n = 9). f Survival (ethical study endpoint). MYC-OFF + isotype antibody (n = 9) and MYC-OFF + anti-PDL1 (n = 8). Log rank test. g Top: Representative flow cytometry plots. PD-L1 expression (red) or isotype antibody (gray) displayed as percent of maximum (modal). Bottom: Bar graphs displaying average geometric mean fluorescence intensity (GMFI) for PD-L1 in each population. n = 6 tumors analyzed for each cell type, except for CD11c (n = 3), mean ± S.E.M., unpaired t-test. hj Scatterplots of h CD274, i tumor infiltrating leukocytes (TIL), and j IL2/STAT5 Hallmark gene signature against the MYC_BC signature in the TCGA TNBC cohort (n = 158). Pearson’s coefficient (Rp), adjusted p-value (Benjamini–Hochberg FDR corrected). k Evaluation of IL2/STAT5 Hallmark gene signature against the MYC_BC signature in METABRIC. ρ, Spearman’s r and exact p-value displayed. l Evaluation of IL2/STAT5 Hallmark gene signature against the MYC_BC signature in the TONIC Trial. ρ, Spearman’s r and exact p-value displayed. m Kaplan–Meier curves of event-free survival for patients with HER2 negative and hormone receptor (HR) negative tumors treated on the Pembrolizumab arm of the I-SPY 2 TRIAL dichotomized by MYC_BC signature. Cox proportional hazard (PH) modeling. n, o Survival analysis correlating MYC expression from pre-treatment tumors pulled out of the TIDE database using Cox PH z-scores: n Kaplan–Meier curves of overall survival in patients with metastatic urothelial carcinoma from Mariathasan et al., 2018 and o Kapaln–Meier curves of overall survival in patients with metastatic clear cell renal cell carcinoma (ccRCC) from Miao et al., 2018. Source data are provided in the Source Data file. Source data for panel l provided at EGA (EGAS00001003535).
Fig. 2
Fig. 2. MYC suppression of MHC-I expression is reversible.
ad Scatter plot correlation tested between the expression of (a) B2M gene and MYC_BC signature in TCGA TNBC patients, Pearson’s coefficient (Rp), adjusted p-value (Benjamini-Hochberg FDR corrected). b B2M and the MYC_BC signature in TONIC Trial patients, Spearman’s r (ρ), exact p-value. c NLRC5 gene and MYC_BC signature in TCGA TNBC patients, Pearson’s coefficient (Rp), adjusted p-value (Benjamini–Hochberg FDR for corrected). d NLRC5 gene and the MYC signature in the TONIC Trial patients, Spearman’s r (ρ), exact p-value. e Antigen presentation pathway genes in MCF10A-MYC cells compared to MCF10A-vector cells. Data displayed as fold change with values < 1 (dotted line) equating to gene repression. Displayed n = 4 independent cell passage replicates. Mean ± S.E.M, two-sided, unpaired t-test, exact p-values. f Differential expression analysis for RNA-seq data in MTB/TOM tumors published by Rohrberg et al. Left: MYC-ON compared to normal mammary tissue (Ctrl), Right: 3 days off-doxycycline (MYC-OFF) compared to animals on doxycycline (MYC-ON). Adjusted p-values. g Representative histogram for MHC-I expression by flow cytometry in MYC-ON and MYC-OFF states. Adjacent bar graph displaying geometric mean fluorescence intensity (GMFI) for MHC-I in MYC-ON (n = 6) and MYC-OFF (n = 7). Line represents median, data points represent individual animals, two-sided, Mann–Whitney test, exact p-value. h Immunohistochemistry staining of immune cell markers within tumor sections in MYC-ON and MYC-OFF state. Images are at 20X. Adjacent bar graphs displaying cumulative counts per field of view (FOV). n = 3 animals per group, 3 FOV analyzed per tumor, mean ± S.E.M. two-sided unpaired t-test, exact p-values. i Flow cytometry analysis of immune cells found in MYC-ON tumors or MYC-OFF tumors (off doxycycline chow for 3 days) (n = 6 per group). Line represents median, data points are individual animals, outliers removed, two-sided Mann–Whitney test, exact p-values. Source data are provided in the Source Data file. Source data for panels b and d provided at EGA (EGAS00001003535).
Fig. 3
Fig. 3. Interferon signaling rescues MHC-I in MYC-elevated cells.
ac Scatter plot correlation tested between the expression of Hallmark Interferon Alpha Response signature or Hallmark Interferon Gamma Response signature and the MYC_BC signature in a TCGA TNBC patients, Pearson’s coefficient (Rp), adjusted p-value (Benjamini–Hochberg FDR corrected); b METABRIC TNBC, ρ, Spearman’s r and exact p-value; and c TONIC Trial, ρ, Spearman’s r and exact p-value. d, e Gene expression analysis after 72 h of d vehicle, interferon alpha, and interferon beta, or e interferon gamma treatment in the presence of doxycycline, in MTB/TOM cells grown in vitro culture. Representative experiment with three samples per condition shown. Mean ± S.E.M, unpaired t-test with Benjamini–Hochberg FDR = 0.05, adjusted p-values displayed across the bars. Trends repeated with three independent cell passages. f Flow cytometry results displayed as geometric mean fluorescence intensity (GMFI) for MHC-I in MTB/TOM cell line in vitro culture after 72 h of treatment. Representative experiment with three samples per condition shown. Mean ± S.E.M, two-sided, unpaired t-test, exact p-values. Trends repeated with three independent cell passages. g, h Left: Representative western blots showing MYC levels in the MTB/TOM cell line after 72 h of treatment with g interferon alpha (n = 6 independent cell passages) or h interferon gamma (n = 7 independent cell passages). Right: densitometry ratio of MYC or STAT1 to ß-actin shown from independent cell passages. Two-sided, unpaired t-test, exact p-values. Source data are provided in the Source Data file. Source data for panel c provided at EGA (EGAS00001003535).
Fig. 4
Fig. 4. CpG/aOX40 enhances anti-PD-L1 in vivo.
a Representative histogram of cell surface MHC-I detected by flow cytometry. Adjacent bar graph displaying geometric mean fluorescence intensity (GMFI). Line represents median, data points represent individual animals, saline (n = 5), CpG (n = 6), Mann–Whitney test, exact p-value. b Survival (time to endpoint length: 20 mm) for animals given CpG/anti-OX40 (aOX40) (n = 10) or isotype/vehicle (n = 9). Log rank test, exact p-value. c Tumor volume following treatments (Rx) indicated by arrows. Isotype (n = 6), CpG (n = 5), aOX40 (n = 6), CpG/aOX40 (n = 5). Mean ± S.E.M, two-sided, unpaired t-test comparing tumor volume on day 10 in isotype treated vs. CpG/aOX40, exact p-value. dg Flow cytometry analysis of immune cells found in the tumor post-treatment initiation day 10. Isotype (n = 6), CpG (n = 5), anti-OX40 (n = 6), CpG/aOX40 (n = 8). Mean ± S.E.M., Mann–Whitney test., exact p-values: d Percent of live cells in the tumor that are T-cells. e Percent of CD4+ (gating: Singlets/Live/TCRβ+, CD45+/CD8−, CD4+) T-cells that are CD25+ and FOXP3+. f Ratio of CD8+ (gating: Singlets/Live/TCRβ+, CD45+/CD8+, CD4−) T-cell counts to Treg counts (gating: Singlets/Live/TCRβ+, CD45+/CD8−, CD4+/CD25+, FOXP3+). g Geometric mean fluorescence intensity for intracellular granzyme B in the CD8+ T-cells (gating: Singlets/Live/TCRβ+, CD45+/CD8+, CD4−). h MTB/TOM tumor volumes graphed to endpoint: isotype (n = 6), anti-PD-L1 (n = 7), CpG/aOX40 (n = 6), and triple combination (n = 9). i Tumor volume in MTB/TOM animals after last day of treatment (related to panel h). Mean ± S.E.M., two-sided, unpaired t-test, exact p-value. jl Survival (time to ethical endpoint length = 20 mm). Log rank test for each treatment arm in comparison to isotype arm, exact p-value in black. Log rank test for anti-PD-L1 compared to triple combination, exact p-value in red: j MTB/TOM (MYC-ON) animals from panel h. k MC38-MYC model, isotype (n = 12), anti-PD-L1 (n = 11), CpG/aOX40 (n = 10), triple combination (n = 11). l WAP-MYC model, isotope (n = 9), anti-PD-L1 (n = 6), CpG/anti-OX40 (n = 9), and triple combination (n = 8). m Disease-free survival in MTB/TOM model (defined as time to palpable tumor). Mice previously treated with triple combination and eradicated their tumors were transplanted with a new MTB/TOM tumor on the contralateral side. Tumor naïve group (n = 5) and responded to therapy group (n = 5). Log rank test, exact p-value. Source data are provided in the Source Data file.

References

    1. Gil Del Alcazar CR, Aleckovic M, Polyak K. Immune escape during breast tumor progression. Cancer Immunol. Res. 2020;8:422–427. - PMC - PubMed
    1. Schreiber RD, Old LJ, Smyth MJ. Cancer immunoediting: integrating immunity’s roles in cancer suppression and promotion. Science. 2011;331:1565–1570. - PubMed
    1. Mittendorf EA, et al. PD-L1 expression in triple-negative breast cancer. Cancer Immunol. Res. 2014;2:361–370. - PMC - PubMed
    1. Ghebeh H, et al. The B7-H1 (PD-L1) T lymphocyte-inhibitory molecule is expressed in breast cancer patients with infiltrating ductal carcinoma: correlation with important high-risk prognostic factors. Neoplasia. 2006;8:190–198. - PMC - PubMed
    1. Schmid P, et al. Atezolizumab and nab-paclitaxel in advanced triple-negative breast cancer. N. Engl. J. Med. 2018;379:2108–2121. - PubMed

Publication types

Substances