. 2022 Jun 27;13(1):3676.
doi: 10.1038/s41467-022-31218-2.

Cancer cells dying from ferroptosis impede dendritic cell-mediated anti-tumor immunity

Affiliations

Cancer cells dying from ferroptosis impede dendritic cell-mediated anti-tumor immunity

Bartosz Wiernicki et al. Nat Commun. .

Abstract

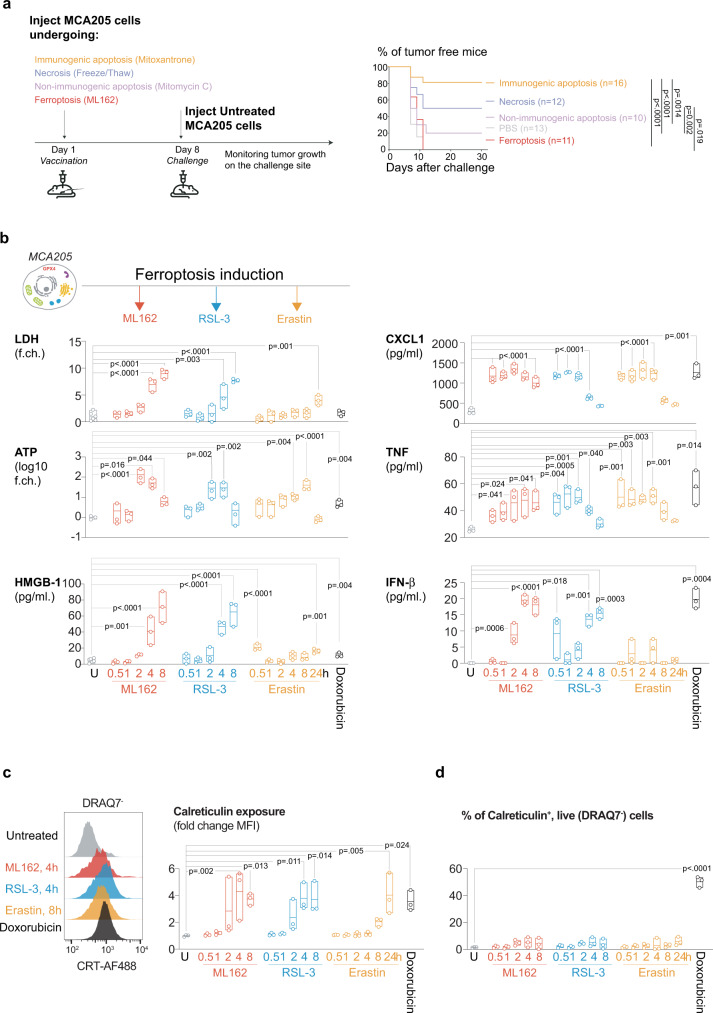
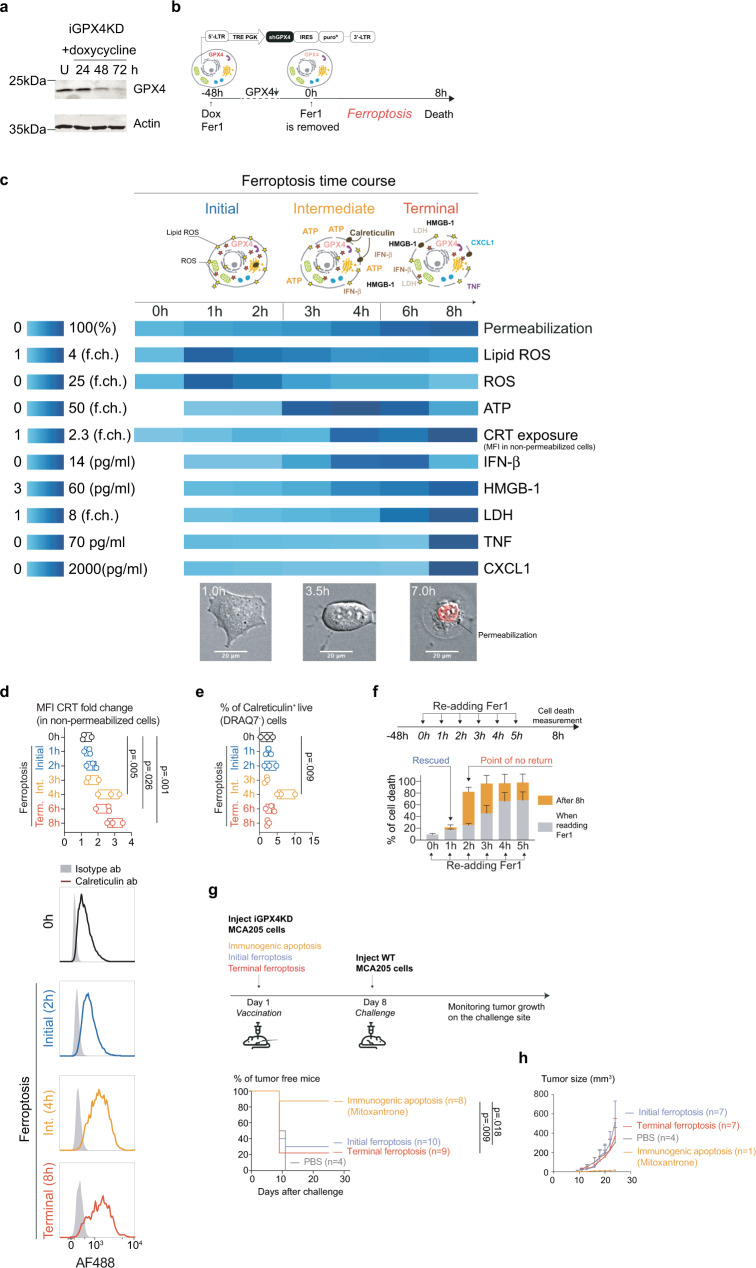
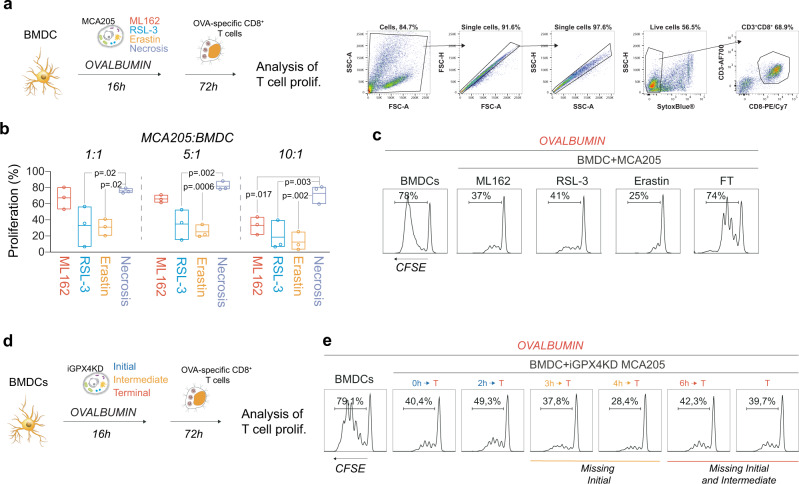
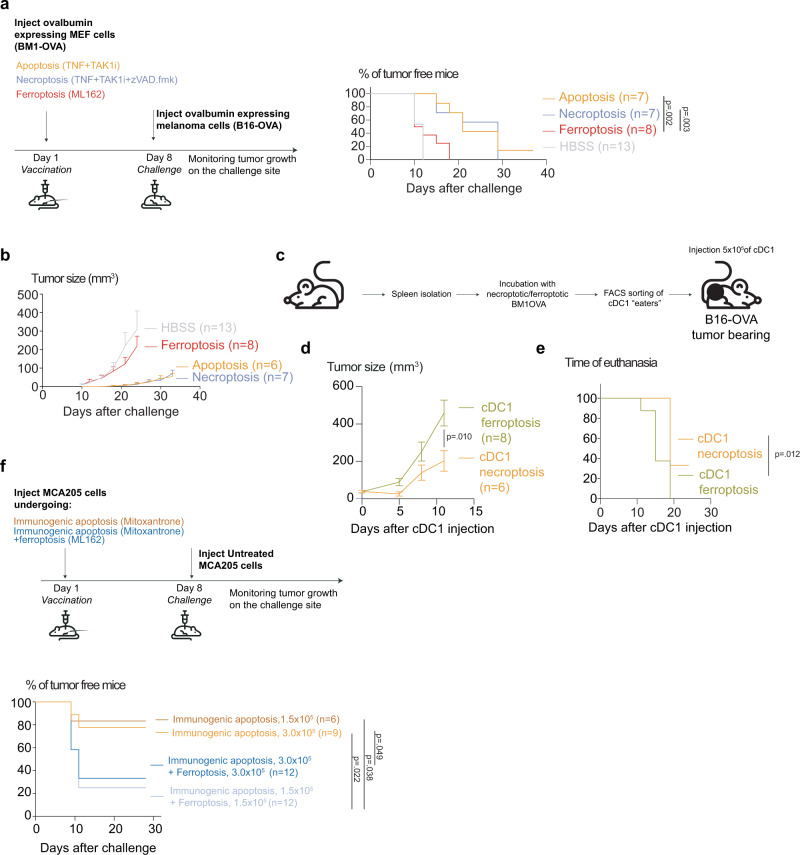
Immunogenic cell death significantly contributes to the success of anti-cancer therapies, but immunogenicity of different cell death modalities widely varies. Ferroptosis, a form of cell death that is characterized by iron accumulation and lipid peroxidation, has not yet been fully evaluated from this perspective. Here we present an inducible model of ferroptosis, distinguishing three phases in the process-'initial' associated with lipid peroxidation, 'intermediate' correlated with ATP release and 'terminal' recognized by HMGB1 release and loss of plasma membrane integrity-that serves as tool to study immune cell responses to ferroptotic cancer cells. Co-culturing ferroptotic cancer cells with dendritic cells (DC), reveals that 'initial' ferroptotic cells decrease maturation of DC, are poorly engulfed, and dampen antigen cross-presentation. DC loaded with ferroptotic, in contrast to necroptotic, cancer cells fail to protect against tumor growth. Adding ferroptotic cancer cells to immunogenic apoptotic cells dramatically reduces their prophylactic vaccination potential. Our study thus shows that ferroptosis negatively impacts antigen presenting cells and hence the adaptive immune response, which might hinder therapeutic applications of ferroptosis induction.


Conflict of interest statement

The authors declare no competing interests.

Figures

Fig. 1
Fig. 1. Ferroptosis does not induce immunological protection against cancer cells despite the release of DAMP.
a Prophylactic vaccination model with MCA205 cells was used to assess the immunogenic potential of ferroptosis (ML162, 0.5 µM, 14 h) via their ability to induce protection against cancer tumor growth. Immunogenic (Mitoxantrone, 1 µM, 24 h) and non-immunogenic (Mitomycin C, 30 µM, 24 h) apoptosis, as well as accidental necrosis (Freeze/thaw, three cycles) conditions, were used as controls. Kaplan–Meier curves represent the % of tumor-free mice after the challenge with live cancer cells. Data from n = 3 independent experiments was analyzed by Kaplan–Meier simple survival analysis. b DAMP release from MCA205 cells stimulated with three inducers of ferroptosis: ML162 (0.5 µM), RSL-3 (0.5 µM) and Erastin (2.0 µM) as well as doxorubicin (1 µM, 24 h). Release of LDH, ATP, HMGB1 as well as cytokines CXCL1, TNF and IFN-β was analyzed at different time points after cell death induction. Data from n = 3 biologically independent samples are presented as floating bars with bounds showing the range and the center showing the mean. Data analyzed by one-way ANOVA with Dunnett’s post-hoc tests for each ferroptosis stimuli separately and two-sided t-test for doxorubicin treatment comparing the values to the untreated sample. c Analysis of calreticulin exposure on the surface of ferroptotic cells, ML162 (0.5 µM), RSL-3 (0.5 µM) and Erastin (2.0 µM). Treatment with doxorubicin (1 µM, 24 h) served as a positive control. Histograms represent the fluorescence intensity detected in non-permeabilized cells. Bounds of the bars show the range, and the center shows the mean of fold change in fluorescence intensity generated by comparing the MFI of treated cells to MFI of untreated cells. Data were generated from n = 3 biologically independent samples. One-way ANOVA, with Dunnett’s post-hoc test for each ferroptosis stimuli and two-sided t-test for doxorubicin treatment comparing the obtained values to the untreated sample d. The % of live cells exposing calreticulin during cell death. Data presented as range (box bounds) and mean (center) of n = 3 independent experiments. One-way ANOVA with Dunnett’s post-hoc test for each ferroptosis stimuli and the t-test for the doxorubicin treatment in comparison to the untreated sample.
Fig. 2
Fig. 2. Ferroptotic cells are not immunogenic regardless of the stage of cell death.
a Induction of GPX4 knockdown by doxycycline administration (1 µg/ml) in iGPX4KD MCA205 cell line measured by western blotting. One of two independent experiments is presented. b Scheme of ferroptosis induction in iGPX4KD cells. c Analysis of lipid ROS, cytosolic ROS accumulation in the cells, levels of calreticulin on the surface of dying, non-permeabilized cells, and ATP, HMGB1, LDH, IFN-β, TNFα, and CXCL release from cells during ferroptosis. Three stages of ferroptosis can be distinguished: initial ferroptosis where cells experience accumulation of lipid ROS; intermediate ferroptosis involving partial permeabilization and release of ATP and exposure of calreticulin, and terminal ferroptosis with complete permeabilization and release of LDH, HMGB1, and cytokines. Data obtained from n = 3 independent samples are presented as mean. Microscopy pictures represent one of n = 2 independent live cells imaging experiments. d The analysis of calreticulin exposure during ferroptosis. Data generated from n = 3 biologically independent samples are presented as floating bars with bounds as the range and center as median of the relative MFI prior to membrane permeabilization; histograms represent the shift of calreticulin fluorescence in non-permeabilized cells. One-way ANOVA with Dunnett’s post-hoc test in comparison to the ‘0 h’ sample. e The % of live cells exposing calreticulin during the process of ferroptotic cell death. Data generated from n = 3 biologically independent samples are presented as floating bars with bounds as the range and center as median of CRT+ cells. One-way ANOVA with Dunnett’s post-hoc test in comparison to the ‘0 h’ sample. f Establishing the point of no return for ferroptosis in iGPX4KD cells. Re-adding ferroptosis inhibitor Fer1 2 h or later after cell death induction does not rescue cells from dying. Data presented as mean ± SEM from n = 3 independent experiments. g Prophylactic vaccination model using iGPX4KD cells at the initial and terminal stage of cell death. Mitoxantrone-treated (1 μM, 24 h) iGPX4KD cells undergoing immunogenic apoptosis served as a positive control. Kaplan–Meier curves represent the effectiveness of dying iGPX4KD cells in preventing tumor growth on the challenge site. The experiment was performed n = 2 and analyzed by Kaplan–Meier simple survival analysis. h The tumor growth on the challenge site in prophylactic vaccination model. Only data presented as mean ± SEM from animals that developed the tumor is shown.
Fig. 3
Fig. 3. Initial ferroptosis impairs the maturation of dendritic cells.
a MCA205 cells with depleted levels of GPX4 and doomed for ferroptosis were co-incubated with dendritic cells for 16 h. To address the role of each ferroptosis stage on the dendritic cell maturation, iGPX4KD cells at different stages of cell death were used. In all conditions iGPX4KD cells reached terminal stage during the co-culture. b The analysis of the maturation of dendritic cells incubated with ferroptotic cells. The levels of CD86, CD40, PD-L1 and percentage of dendritic cell population expressing high levels of MHCII was assessed by flow cytometry measurements. Data from n = 3 independent samples for CD40 and MHCII measurement and n = 4 independent samples for CD86 and PD-L1. Data are presented as floating bar plots with box bounds representing the range and center showing the median of obtained measurements. One-way ANOVA, with Dunnett’s post-hoc test analyzing comparison to ‘0 h’ sample. c The analysis of cytokine production from the dendritic cells incubated with ferroptotic cells. Data from n = 4 independent biological replicates and presented as floating bars with bar limits showing the range and the center describing the median. One-way ANOVA, with Dunnett’s post-hoc comparing results from the co-cultures to the untreated bone marrow-derived dendritic cells (BMDC). d The analysis of phosphatidylserine exposure on the surface of the ferroptotic cells at different stages of cell death. Representative contour plot of flow cytometry analysis using Annexin V and 7-AAD. Bar graphs show the mean ± SEM of n = 3 independent experiments. e The level of phagocytosis of untreated and undergoing the initial or terminal ferroptosis. CypHer-labeled MCA205 cells were incubated with CFSE-labeled bone marrow-derived dendritic cells (BMDC) for 2 h. Afterwards the phagocytosis was determined by the detection of CypHer fluorescence in CFSE-stained BMDC. Cytochalasin D and Fer1 were used as inhibitors of phagocytosis and lipid peroxidation respectively. Data from n = 3 independent biological samples and is presented as floating bars with bounds representing the range and the center showing the median of % of phagocytic BMDC. Two-way ANOVA with Dunnett’s post-hoc test shows the comparison to the untreated condition with the same inhibitor. Contour plots represent the stages of cell death (upper panel) and the gating strategy for phagocytosis detection. f The analysis of the dendritic cells phagocytosis of the terminal ferroptotic cells with and without PS blockage by Annexin V. Data presented as median and range and come from n = 3 biological replicates, two-sided t-test, ns—not significant. g The analysis of dendritic cells phagocytosis of terminal ferroptotic cells with blocked calreticulin. Data presented as floating bars with bounds representing the range and the center showing the median of n = 3 biological replicates, two-sided t-test, ns—not significant. h The microscopy analysis of lipid droplets accumulation using BODIPY 493/503 nm probe. Bone marrow-derived dendritic cells (BMDC) were incubated with iGPX4KD cells at different stages of cell death O/N. Afterwards, cells were fixed and visualized on confocal microscope. Box plot shows the analysis of the relative volume of detected lipid droplets in the BMDC for each condition and is presented as a box showing median (center line), 25th and 75th percentile (box bounds) and range of the observed results (whiskers) from n = 3 independent experiments, where each dot represents one cell in the analyzed images. One-way ANOVA with Dunnett’s post-hoc test analyzing the comparison to the untreated BMDC. i The flow cytometry analysis of BODIPY 493/503 nm accumulation in the BMDC after the incubation with untreated or ferroptotic iGPX4KD cells. Data presented as floating bar plots with bounds representing the range and the center showing the median of values generated from n = 4 independent experiments. One-way ANOVA with Dunnett’s post-hoc test analyzing the comparison of ferroptosis conditions to ‘0 h’ condition.
Fig. 4
Fig. 4. Engulfment of ferroptotic cells by DC suppresses expression of genes associated with adaptive immune response.
a Fluorescently labeled ferroptotic Jurkat cells were co-cultured with BMDC for 4 h after which BMDC carrying ferroptotic cargo were sorted and subjected to murine total RNA sequencing (n = 4 independently collected samples). Uptake of ferroptotic Jurkat cells led to transcriptional changes in 2586 genes. b Expression of selected genes involved in adaptive immune response. c GSEA pathway analysis of BMDC carrying ferroptotic cargo revealing transcriptional changes in pathways involved in inducing adaptive immune response.
Fig. 5
Fig. 5. Ferroptotic cells impair dendritic cells ability to perform antigen cross-presentation.
a Bone marrow-derived dendritic cells (BMDC) were incubated with soluble OVA in the presence of ferroptotic (ML162 0.5 µM, 14 h; RSL-3, 0.5 µM, 14 h; Erastin 2.0 µM, 24 h) or necrotic (3 cycles of freeze/thaw, FT) cancer cells. Afterwards, fluorescently labeled OVA-specific CD8+ cells, were added to the co-culture and their proliferation was assessed 72 h later. The flow cytometry dot plots present gating strategy. b Percentage of proliferating OVA-specific CD8+ T cells after co-incubation of ferroptotic and necrotic cells with BMDC. Data comes from n = 3 independent experiments and is presented as floating bars showing the range (box bounds) and mean (center line). One-way ANOVA, with Dunnett’s post-hoc test analyzing the comparison to the FT condition. c Representative histogram of OVA-specific T-cell proliferation after incubation with BMDC exposed to MCA205 cells, ferroptotic or killed by accidental necrosis (FT—freeze/thaw). d Scheme of co-culture experiments involving iGPX4KD cell line to address the importance of early events of ferroptosis in inhibiting T-cell proliferation. e Representative histograms from n = 2 independent experiments of cytotoxic T-cell proliferation after co-incubation with bone marrow-derived dendritic cells with ferroptotic cells at different stages of cell death.
Fig. 6
Fig. 6. Ferroptosis is less potent in controlling the tumor growth compared to apoptosis and necroptosis and diminishes the immunogenicity of apoptosis.
a Prophylactic vaccination model assessing the immunogenicity of ferroptosis. ML162-induced ferroptosis (5 μM, 14 h), in comparison with apoptosis (1000 IU/ml TNF + 10 μM TAK1i, 14 h) and necroptosis (1000 IU/ml TNF + 10 μM TAK1i + 10 μM zVAD.fmk, 24 h). OVA-expressing non-tumorigenic MEF cells (BM1-OVA) were used as a vaccine and live ovalbumin expressing melanoma cells (B16-OVA) were used as challenge. Kaplan–Meier curves represent the effectiveness of ferroptotic cells in preventing the tumor growth at the challenge site. Data were analyzed by Kaplan–Meier simple survival analysis. b Tumor size of B16-OVA derived melanoma after vaccination with BM1-OVA cells. Data presented as mean ± SEM. c Scheme of the therapeutic vaccination experiment. Conventional dendritic cells type 1 (cDC1) carrying ferroptotic or necroptotic cargo were intradermally injected in melanoma tumor-bearing mice. d B16-OVA tumor size progression of animals receiving either cDC1 with ferroptotic (5 μM, 14 h) or necroptotic (1000 IU/ml TNF + 10 μM TAK1i + 10 μM zVAD.fmk, 24 h) cargo. Data presented as mean ± SEM. Statistical significance was determined by two-sided t-test on each day of measurement. e Comparison of euthanasia time determined by the size of the tumor. Kaplan–Meier curves show the time of euthanasia, Data analyzed by Kaplan–Meier simple survival analysis. f Prophylactic vaccination model using either Mitoxantrone-treated MCA205 cells (1 μM, 24 h) or Mitoxantrone-treated MCA205 mixed with ML162-killed cells (0.5 µM, 14 h). Kaplan–Meier curves show the percentage of tumor-free mice after the challenge with live cancer cells. Data were analyzed by Kaplan–Meier simple survival analysis.

References

    1. Dixon SJ, et al. Ferroptosis: an iron-dependent form of nonapoptotic cell death. Cell. 2012;149:1060–1072. - PMC - PubMed
    1. Stockwell BR. Ferroptosis: death by lipid peroxidation. Free Radic. Biol. Med. 2018;120:S7.
    1. Yang WS, et al. Regulation of ferroptotic cancer cell death by GPX4. Cell. 2014;156:317–331. - PMC - PubMed
    1. Dixon SJ, et al. Pharmacological inhibition of cystine-glutamate exchange induces endoplasmic reticulum stress and ferroptosis. eLife. 2014;3:e02523. - PMC - PubMed
    1. Doll S, et al. FSP1 is a glutathione-independent ferroptosis suppressor. Nature. 2019;575:693–698. - PubMed

Publication types

LinkOut - more resources