. 2022 Jun 27;12(1):10870.
doi: 10.1038/s41598-022-14821-7.

Constitutive expression of a pea apyrase, psNTP9, increases seed yield in field-grown soybean

Affiliations

Constitutive expression of a pea apyrase, psNTP9, increases seed yield in field-grown soybean

Tanya Sabharwal et al. Sci Rep. .

Abstract

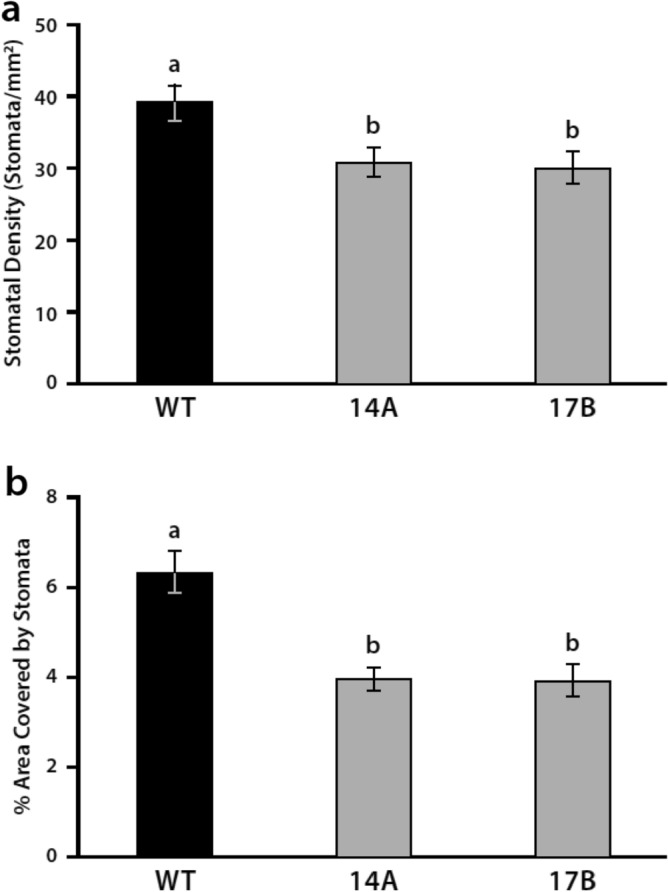
To address the demand for food by a rapidly growing human population, agricultural scientists have carried out both plant breeding and genetic engineering research. Previously, we reported that the constitutive expression of a pea apyrase (Nucleoside triphosphate, diphosphohydrolase) gene, psNTP9, under the control of the CaMV35S promoter, resulted in soybean plants with an expanded root system architecture, enhanced drought resistance and increased seed yield when they are grown in greenhouses under controlled conditions. Here, we report that psNTP9-expressing soybean lines also show significantly enhanced seed yields when grown in multiple different field conditions at multiple field sites, including when the gene is introgressed into elite germplasm. The transgenic lines have higher leaf chlorophyll and soluble protein contents and decreased stomatal density and cuticle permeability, traits that increase water use efficiency and likely contribute to the increased seed yields of field-grown plants. These altered properties are explained, in part, by genome-wide gene expression changes induced by the transgene.


Conflict of interest statement

ZL, SJR and GC are consultants to Texas Crop Science which funded most of the research presented here. No other authors have conflicts of interest to declare.

Figures

Figure 1
Figure 1
Identification of T-DNA copy number and insertion sites of transgenic soybean lines. (a) Southern blot analysis to determine the T-DNA copy number of soybean transgenic lines. Genomic DNA was digested with XbaI or BamHI, and a probe specific to the Bar gene was used to detect T-DNA insertions. (b) Diagrams of the sites of T-DNA insertions, including their adjacent genes, identified by TAIL-PCR and inverse PCR. Each of the inserted loci is shown as a chromosome number with the location in the chromosome. The locations of primers used for PCR validation of T-DNA insertion sites and the sizes of the resulting products are shown. Some parts of the diagram are not drawn to scale. (ce) PCR validation of insertion sites for transgenic soybean lines. M: 1 Kb Plus DNA Ladder (Thermo Fisher Scientific), 1: negative control of non-transgenic soybean; 2, 3: transgenic plants of 14A (c), 17B (d), and 16C (e); –: distilled water control.
Figure 2
Figure 2
Seed yield of psNTP9 events and parental line Williams 82 (WM 82) trialed in 2016, 2017, and 2018. (a) Field trials were conducted at three different locations in the US—El Paso, Illinois; Henderson, Kentucky; and Atlanta, Indiana. Seed yield performance and analysis of psNTP9 events at each of the individual sites can be found in supplemental data. Combined site analysis over the three trials determined 5.25 bushels per acre as the value of 5% least squared difference (LSD0.05) for mean separations. Asterisk symbol (*) next to yield delta (%) inside the figure indicates significant yield difference from parental line WM 82 at p = 0.05. All data are presented as mean of eight plot replicates over three individual sites ± standard error (SE). (b) Seed yield of psNTP9 events and parental line trialed in 2017. The field trials were implemented during the counter-season seed increase at three locations in Puerto Rico. Seed yield performance and analysis of psNTP9 events at each of the individual sites can be found from supplemental data. Combined site analysis of seed yield over the three trials determined 3.91 bushels per acre as LSD0.05 value for mean separations. Asterisk symbol (*) next to yield delta (%) values inside the figure indicates significant yield difference from parental line WM 82 at p = 0.05. All data are presented as mean of fifteen plot replicates over three individual sites ± SE. (c) Seed yield of psNTP9 events and parental line trialed in 2018. The field trials were conducted at three different production regions in the US—Lawrence, Kentucky; Smithville, Missouri and Troy, Ohio. Seed yield performance and analysis of psNTP9 events at each of the individual sites can be found from supplemental data. Combined site analysis of seed yield over the three trials determined 3.30 bushels per acre as LSD0.05 value for mean separations. All data are presented as mean of twelve plot replicates over three individual sites ± SE. (d) Seed yield of psNTP9 and sibling nulls trialed in 2018. The field trials were conducted at three different production regions in the US—Lawrence, Kentucky; Smithville, Missouri and Troy, Ohio. Combined site analysis of seed yield over the three trials determined 3.30 bushels per acre as LSD0.05 value for mean separations. Asterisk symbol (*) next to yield delta (%) inside the figure indicates significant yield difference from corresponding sibling null at p = 0.05. All data are presented as mean of twelve plot replicates over three individual sites ± SE.
Figure 3
Figure 3
Seed yield of introgression lines of psNTP9 event 17B into different elite varieties trialed in 2019. (a) 17B × A1900. Nine field trials were conducted at two locations in Argentina (Ferre, Buenos Aires; Venado Tuerto, Santa Fe) and eight locations in the US (Beatrice, Nebraska; Creston, Iowa; Macomb, Illinois; Monmouth, Illinois; Shipman, Illinois; Remington, Indiana; Tipton, Indiana; and Delphos, Ohio). Yield performance and analysis of introgression lines and recurrent parent (RP) at each of the individual sites can be found in supplemental data. Combined site analysis of seed yield over the nine trials determined 2.51 bushels per acre as LSD0.05 value for mean separations. Asterisk symbol (*) next to yield delta (%) inside the figure indicates significant yield difference from recurrent parent A1900 at p = 0.05. All data are presented as mean of 46–55 plot replicates over ten individual sites ± SE. (b) 17B × DSR262. Twelve field trials were conducted at three locations in Argentina (Ferre site A and B, Buenos Aires; Venado Tuerto, Santa Fe) and nine locations in the USA (Beatrice, Nebraska; Creston, Iowa; Davenport, Iowa; Macomb, Illinois; Monmouth, Illinois; Shipman, Illinois; Remington, Indiana; Tipton, Indiana; and Delphos, Ohio). Combined site analysis of seed yield over the twelve trials determined 3.36 bushels per acre as LSD0.05 value for mean separations. Asterisk symbol (*) next to yield delta (%) inside the figure indicates significant yield difference from recurrent parent DSR262 at p = 0.05. All data are presented as mean of 22–57 plot replicates over 12 individual sites ± SE. (c) 17B × A3431. Thirteen field trials were conducted at four locations in Argentina (Ferre site A and B, Buenos Aires; Venado Tuerto site A and B, Santa Fe) and nine locations in the USA (Beatrice, Nebraska; Creston, Iowa; Davenport, Iowa; Macomb, Illinois; Monmouth, Illinois; Shipman, Illinois; Remington, Indiana; Tipton, Indiana; and Delphos, Ohio). Combined site analysis of seed yield over the thirteen trials determined 2.64 bushels per acre as LSD0.05 value for mean separations. Asterisk symbol (*) next to yield delta (%) inside the figure indicates significant yield difference from recurrent parent A3431 at p = 0.05. All data are presented as mean of 42–55 plot replicates over 13 individual sites ± SE. (d) Top two performers of every introgression. Thirteen field trials were conducted at four locations in Argentina (Ferre site A and B, Buenos Aires; Venado Tuerto site A and B, Santa Fe) and nine locations in the USA (Beatrice, Nebraska; Creston, Iowa; Davenport, Iowa; Macomb, Illinois; Monmouth, Illinois; Shipman, Illinois; Remington, Indiana; Tipton, Indiana; and Delphos, Ohio). Each of yield deltas (%) above introgression line yield bars reached statistical significance at the level of p = 0.05, as compared to corresponding recurrent parent (RP). All data are presented as mean of 22–55 plot replicates over 9–13 individual sites ± SE.
Figure 4
Figure 4
Effects of psNTP9 gene on soybean seed moisture and test weight at harvest. (a) Seed moisture. Data were collected from 16 field trials including three US trials in 2018 (Lawrence, Kentucky; Smithville, Missouri and Troy, Ohio), four Argentinian trials in 2019 (Ferre site A and B, Buenos Aires; Venado Tuerto site A, Santa Fe), and nine US field trials in 2019 (Beatrice, Nebraska; Creston, Iowa; Davenport, Iowa; Macomb, Illinois; Monmouth, Illinois; Shipman, Illinois; Remington, Indiana; Tipton, Indiana; and Delphos, Ohio). Combined site analysis of transformed data of soybean seed moisture over 16 trials determined 0.15% as LSD0.05 value for mean separations. All data are presented as mean of 66–71 plot replicates over 16 individual sites ± SE. (b) Test weight. Data were assayed from three US trials in 2019 (Beatrice, Nebraska; Davenport, Iowa; and Macomb, Illinois). Combined site analysis of soybean test weight over three trials determined 0.44 pound per bushel as LSD0.05 value for mean separations. All data are presented as mean of 12–15 plot replicates over three individual sites ± SE.
Figure 5
Figure 5
Transcript and protein abundance of psNTP9 of transgenic soybean lines. Transcript (a) and protein (b,c) abundance of psNTP9 is higher in leaves of the 17B line than in the 14A line of soybeans. The leaves were harvested from mature plants in the 2020 field trials in Shipman, IN. In panel (a) the relative expression levels were normalized to the expression level in 14A, taken as 1.0. Data represent means ± SE (n = 3). Different letters above the bars indicate statistically significant differences between the wild type and the transgenic lines using one-way ANOVA (p ≤ 0.01) with Tukey HSD test. In panel (b) equal loading was confirmed by dual staining with anti-actin antibodies. In panel (c) the lane outlined had less protein loaded than the following four lanes, as indicated by lower actin levels. 17B/DSR262 has a slightly higher level of psNTP9 immunostaining than 16C/A2835 and 16C/A2835, but all three have higher levels than line 14A/3431, which is below detection limit in this panel. In panel (b) the samples loaded were from the following events: 17B/AA3431 (lanes 1, 2, 3 and 6); 17B/D5R262 (lanes 4 and 5); homozygous line of 14A (lane 7); 14A/A3431 (lane 8). In panel (c) the samples loaded were from the following events: homozygous line of 14A (lane 1); 14A/3431 (lane2); null line (lane 3); 17B/A3431 (lane 4); 17B/D5R262 (lane 5); null line (lane 6); 16C/A2835 (lane 7); 16C/A2835 (lane 8). Original immunostained membranes for (b) and (c) did not detect bands below 25 kDa in any transgenic line, so images do not show this region of the blot (see Supplementary information).
Figure 6
Figure 6
Leaves from the transgenic lines 14A and 17B have higher contents of total chlorophyll and soluble protein. (a) Leaves of 14A and 17B transgenic events have higher total chlorophyll contents than WT leaves. (b) The total soluble protein contents of 14A, 16C and 17B transgenic leaves from thirty-four-day-old greenhouse grown plants at V3 stage (the third trifoliate stage) is higher than in WT leaves. The data shown are means ± SE from 3 biological replicates (n = 6). Different letters above the bars indicate statistically significant differences between the wild type and the transgenic lines using one-way ANOVA (p ≤ 0.01) with Tukey HSD test.
Figure 7
Figure 7
Leaves from the 17B transgenic soybean line displays a significant increase in cuticle and wall thickness of epidermal cells compared to wild-type (WT). Analyses of transmission electron microscopy (TEM) images of WT and 17B leaves show (a) an increase in the adaxial and abaxial thickness of the 17B epidermal cell walls compared to WT (adaxial p < 0.001, abaxial p < 0.001) and (b), increase in adaxial and abaxial cuticle thickness of 17B epidermal cells compared to WT (adaxial p < 0.05, abaxial p < 0.001). Data represent means ± SE, based on the Student’s t-test. Representative TEM images (c) of adaxial and abaxial epidermal cells from WT and 17B leaves.
Figure 8
Figure 8
Leaves from the transgenic lines 14A and 17B show decreased cuticle permeability compared to wild-type (WT). Cuticle permeability assays using detached V3 stage leaves of WT and transgenic lines 14A and 17B. (a) Water loss assay (+p ≤ 0.05; *p ≤ 0.01) and (b) Chlorophyll leakage assay (*p ≤ 0.05; **p ≤ 0.01; ***p ≤ 0.001). Data represent means ± SE (n = 3), with statistical differences based on the Student’s t-test.
Figure 9
Figure 9
Leaves from 14A and 17B transgenic soybean lines display a significant decrease in stomatal density and stomatal coverage compared to wild-type (WT). Analysis of stomata of WT, 14A and 17B leaves shows (a) lower stomatal density for 14A and 17B leaves (p < 0.05), and (b) smaller percent area covered by stomata for 14A and 17B leaves compared to WT (p < 0.001). Data represent means ± SE, with statistical differences based on the Student’s t-test.

References

    1. Godfray HCJ, et al. Food security: The challenge of feeding 9 billion people. Science (80-). 2010;327:812–818. - PubMed
    1. Bailey-Serres J, Parker JE, Ainsworth EA, Oldroyd GED, Schroeder JI. Genetic strategies for improving crop yields. Nature. 2019;575:109–118. - PMC - PubMed
    1. Wu J, et al. Overexpression of zmm28 increases maize grain yield in the field. Proc. Natl. Acad. Sci. U. S. A. 2019;116:23850–23858. - PMC - PubMed
    1. Jia H, et al. A serine/threonine protein kinase encoding gene KERNEL NUMBER PER ROW6 regulates maize grain yield. Nat. Commun. 2020;11:1–11. - PMC - PubMed
    1. Han X, Wang D, Song G. Expression of a maize SOC1 gene enhances soybean yield potential through modulating plant growth and flowering. Sci. Rep. 2021;11:1–14. - PMC - PubMed

Publication types