. 2022 Jun;4(6):693-710.
doi: 10.1038/s42255-022-00582-0. Epub 2022 Jun 27.

Cancer-associated fibroblasts require proline synthesis by PYCR1 for the deposition of pro-tumorigenic extracellular matrix

Affiliations

Cancer-associated fibroblasts require proline synthesis by PYCR1 for the deposition of pro-tumorigenic extracellular matrix

Emily J Kay et al. Nat Metab. 2022 Jun.

Erratum in

Abstract

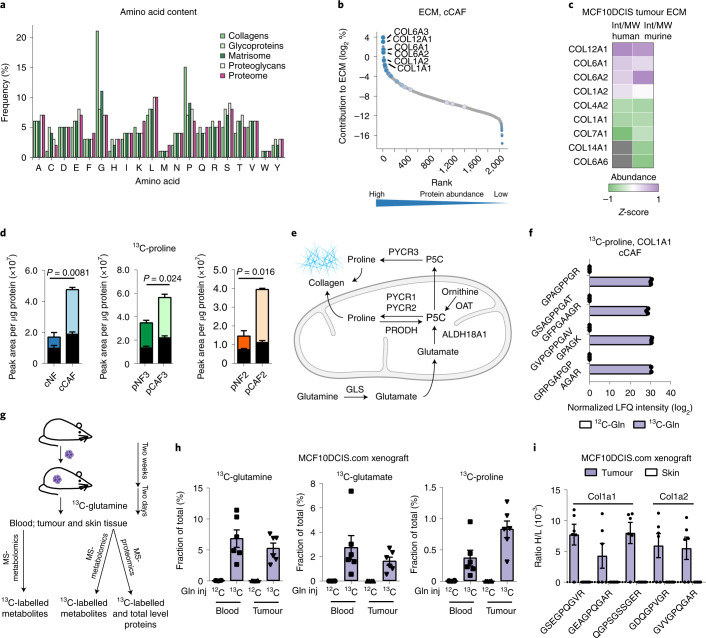
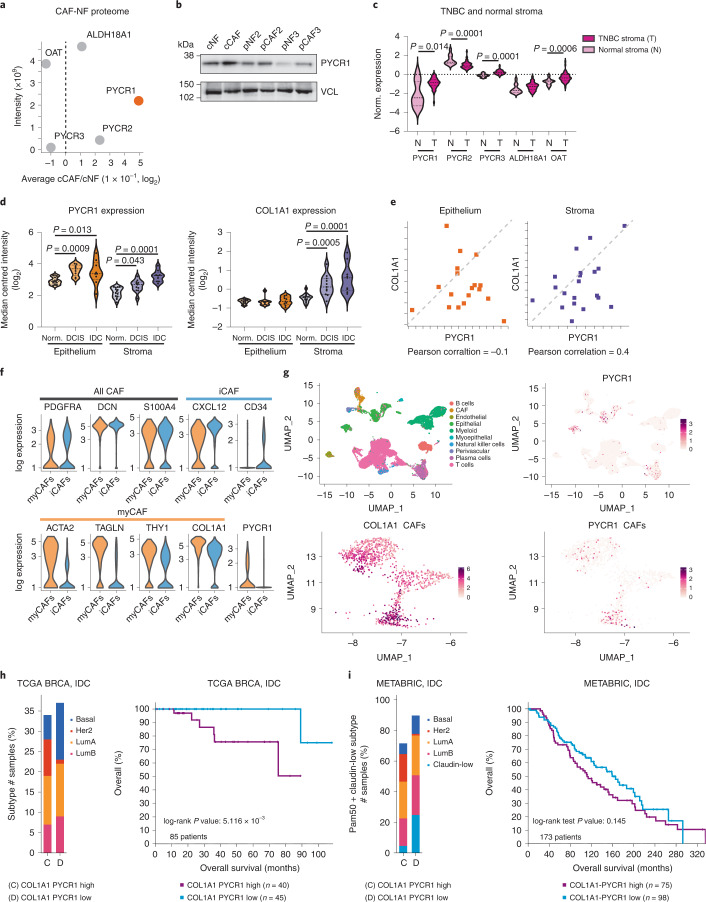
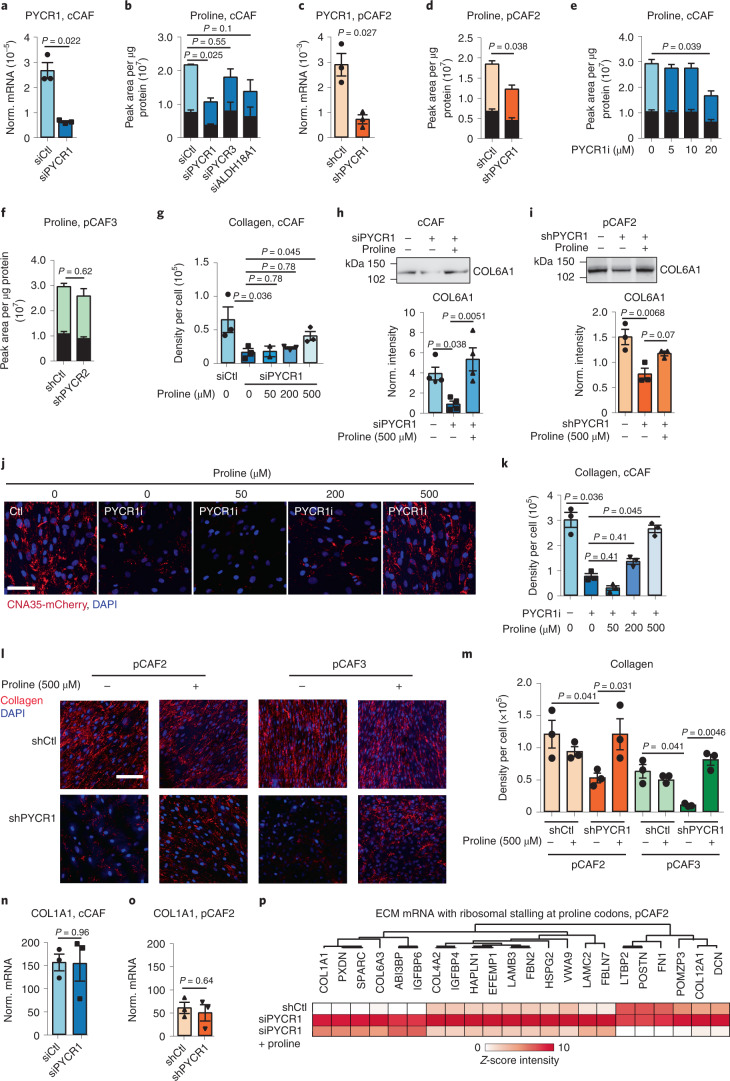
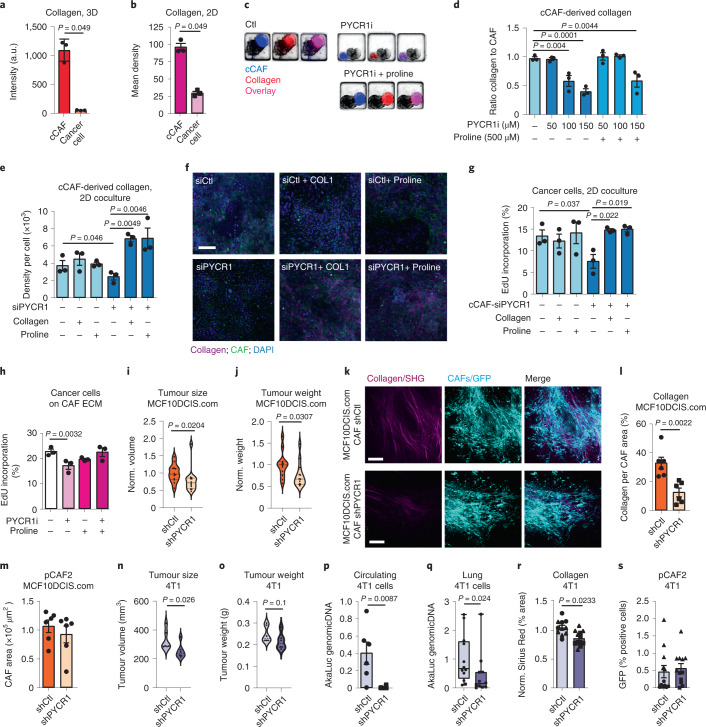
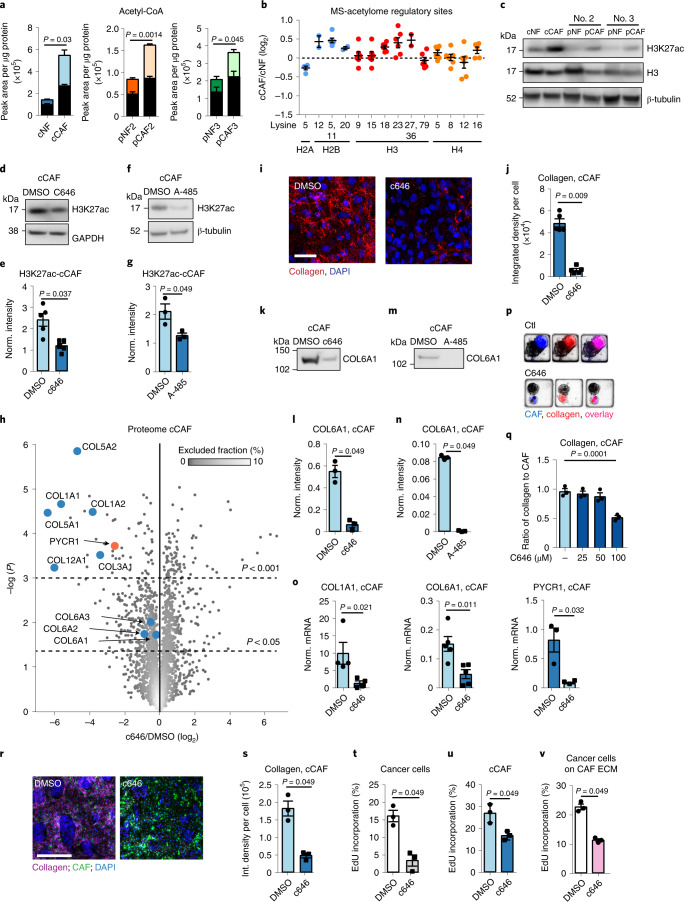
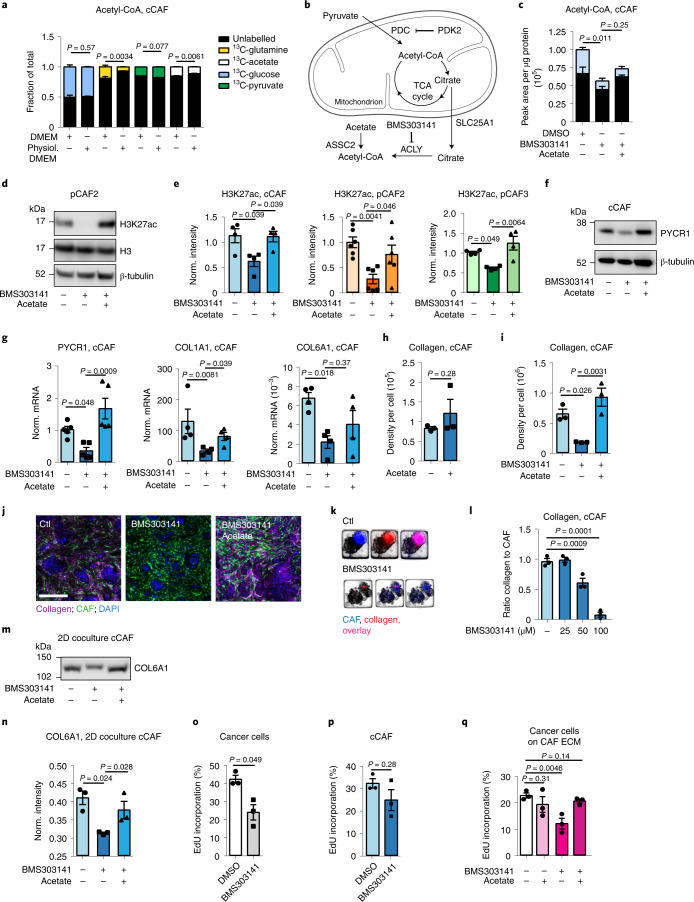
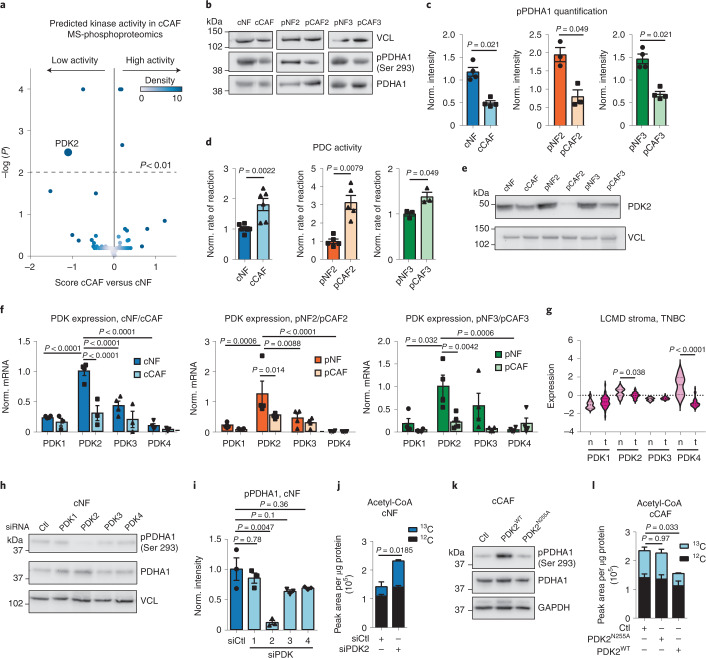
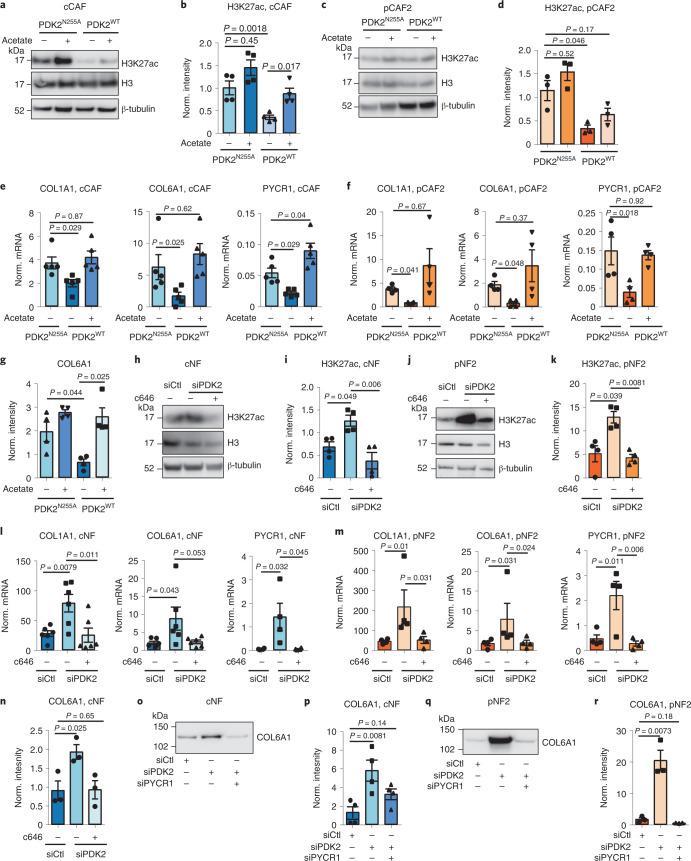
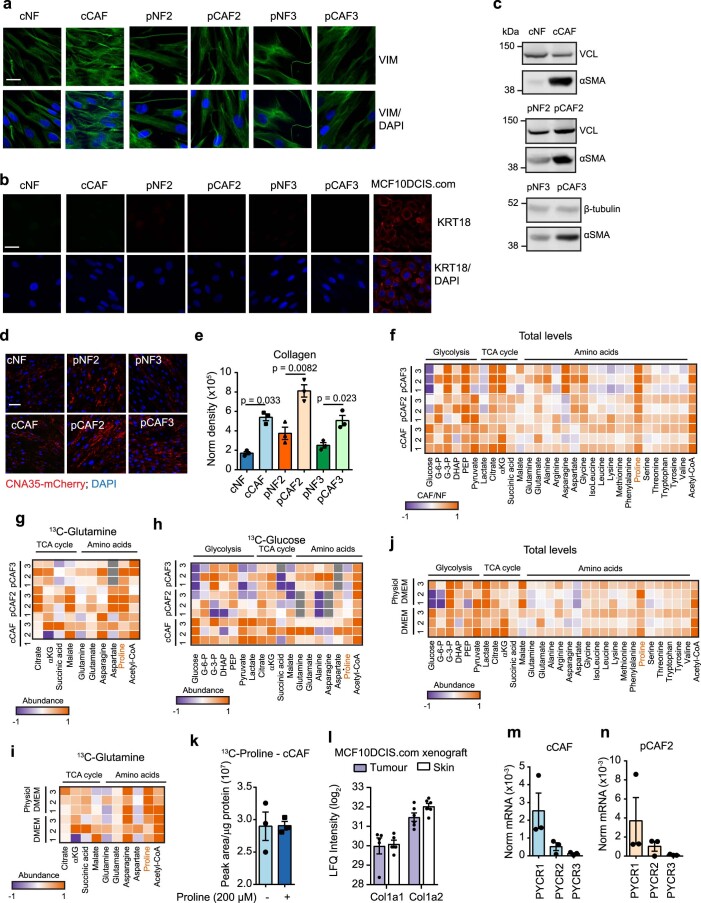
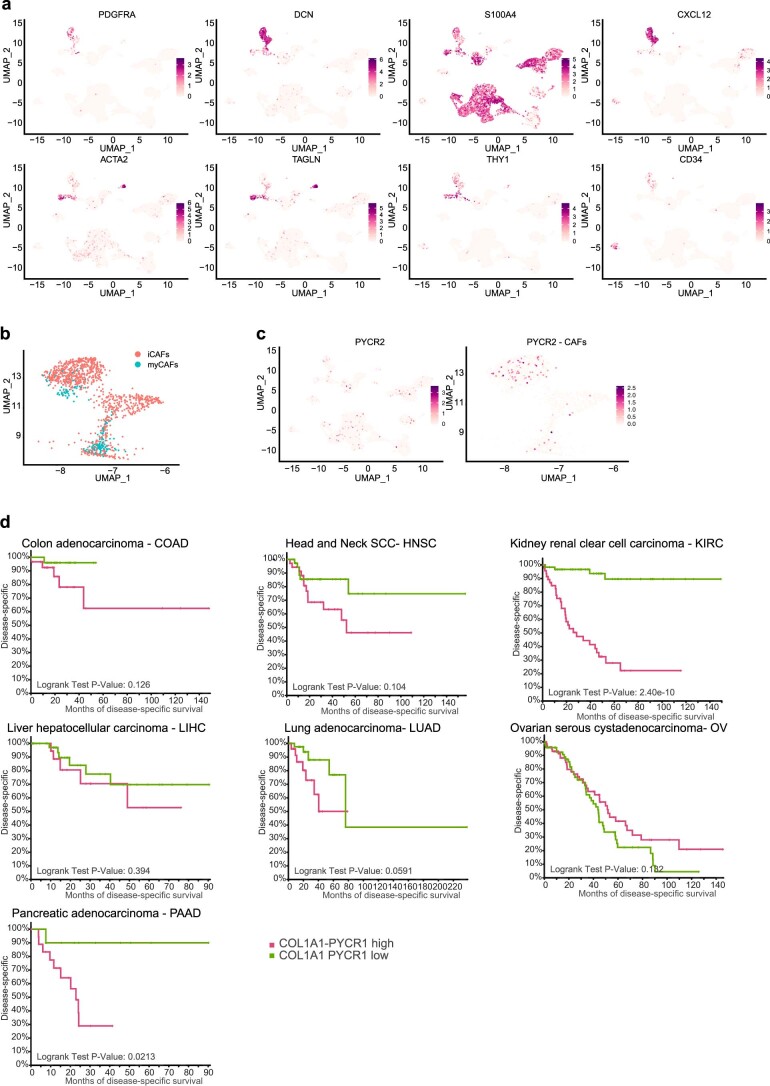
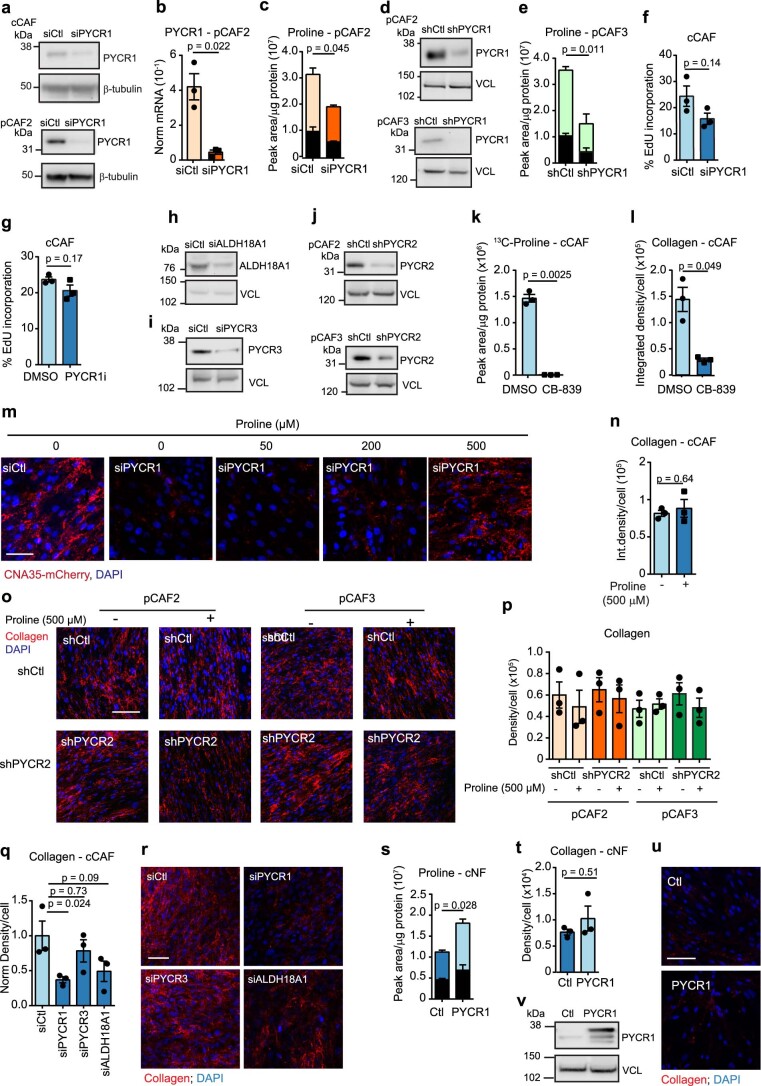
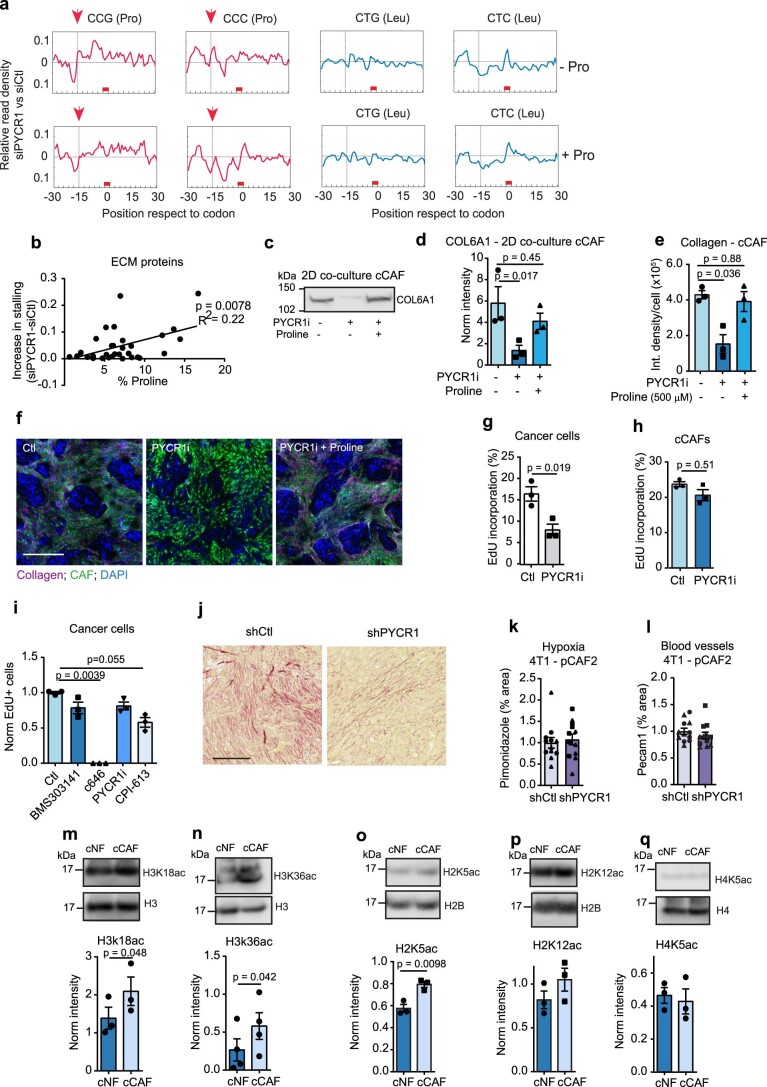
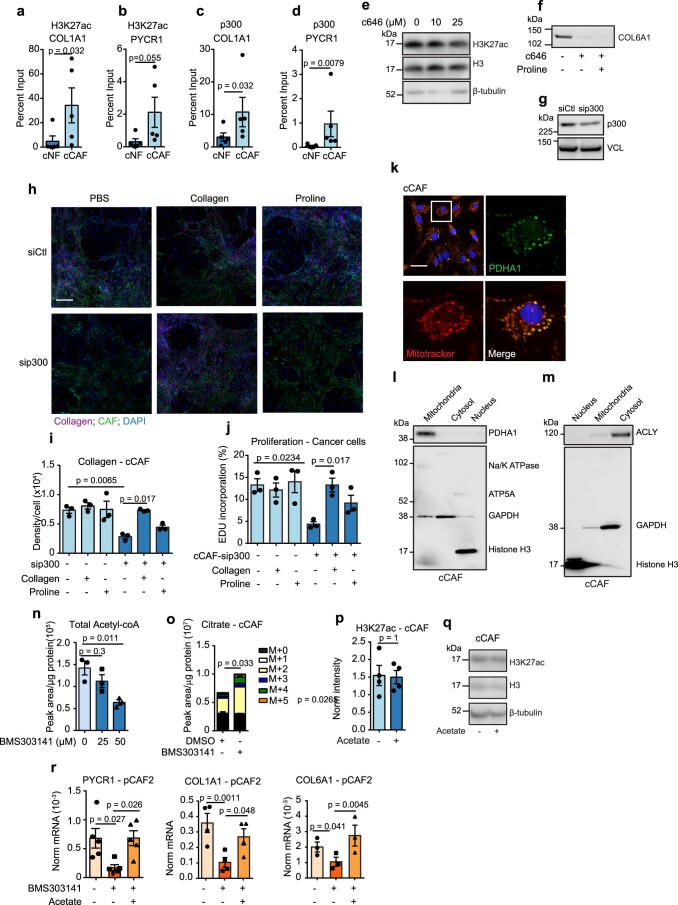
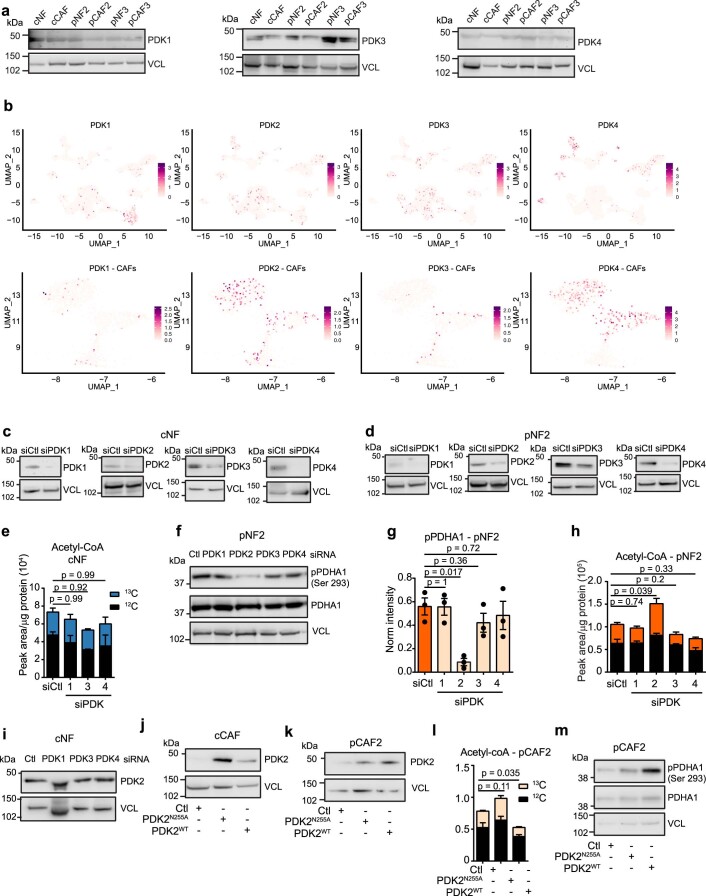
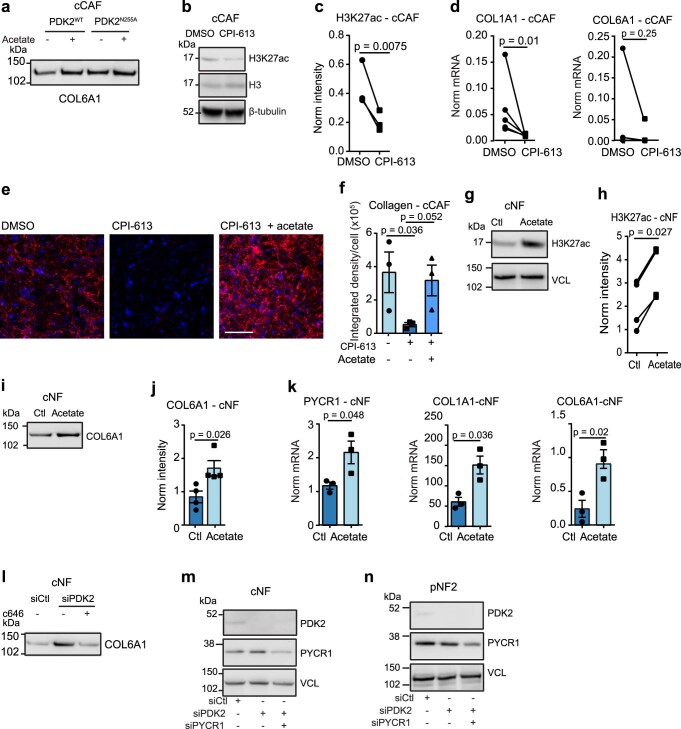
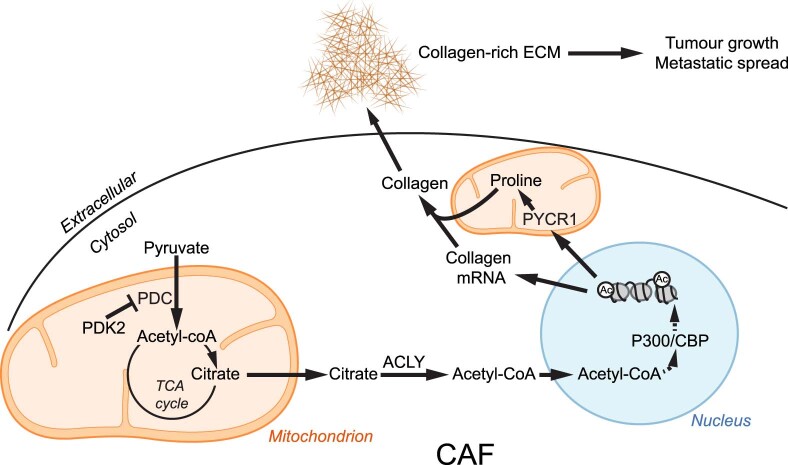
Elevated production of collagen-rich extracellular matrix is a hallmark of cancer-associated fibroblasts (CAFs) and a central driver of cancer aggressiveness. Here we find that proline, a highly abundant amino acid in collagen proteins, is newly synthesized from glutamine in CAFs to make tumour collagen in breast cancer xenografts. PYCR1 is a key enzyme for proline synthesis and highly expressed in the stroma of breast cancer patients and in CAFs. Reducing PYCR1 levels in CAFs is sufficient to reduce tumour collagen production, tumour growth and metastatic spread in vivo and cancer cell proliferation in vitro. Both collagen and glutamine-derived proline synthesis in CAFs are epigenetically upregulated by increased pyruvate dehydrogenase-derived acetyl-CoA levels. PYCR1 is a cancer cell vulnerability and potential target for therapy; therefore, our work provides evidence that targeting PYCR1 may have the additional benefit of halting the production of a pro-tumorigenic extracellular matrix. Our work unveils new roles for CAF metabolism to support pro-tumorigenic collagen production.


Conflict of interest statement

S.Z. reports that part of this research was conducted in a collaboration with Cancer Research Horizon – LifeArc – Ono Pharmaceutical Co., Ltd. Alliance. J.S.-R. reports funding from GSK and Sanofi and fees from Travere Therapeutics and Astex Therapeutics. All other authors have no competing interests.

Figures

Fig. 1
Fig. 1. CAFs use glutamine-derived proline for collagen synthesis.
a, Average frequency of occurrence of each amino acid in proteins in the human proteome (purple), matrisome (dark green) and matrisome components (other greens) as defined by Naba et al.. b, Estimated total abundance (intensity/molecular weight used to rank proteins from low to high abundant, x axis) of proteins identified in the cCAF ECM as measured by MS-proteomics. The contribution of each protein to the total mass of the ECM is shown on the y axis. Highlighted are the most abundant protein collagens. c, Comparison of the abundance (intensity/molecular weight (MW)) of collagen proteins, measured by MS-proteomics, between endogenous (murine) and transplanted (human) stroma in xenograft tumours of MCF10DCIS.com cells cotransplanted with pCAF2 fibroblasts and grown for two weeks in immunocompromised Balb/c mice. Z-scoring of the protein intensities was performed separately for murine and human collagens. n = 12 mice. d, Total 13C-labelled (coloured bar) and unlabelled (black bar) proline in mammary NFs and CAFs labelled with 13C-glutamine, measured by MS-metabolomics. n = 3 biological replicates. e, Scheme showing proline biosynthesis pathways from glutamine and ornithine. f, MS-proteomic analysis of ECM derived from cCAFs labelled for 72 h with 2 mM 13C-glutamine (13C-gln) or 12C-glutamine (12C-gln), showing 13C-proline incorporation into COL1A1 peptides. n = 3 biological replicates. g, Workflow of the MCFDCIS.com xenografts with 13C5-glutamine tracing and MS-based tissue analyses. h, Proportion of 13C-labelled glutamine, glutamate and proline in the blood and tumours of mice with MCF10DCIS.com xenografts after 48 h of treatment with 13C-glutamine or 12C-glutamine. 0 means that no heavy labelled amino acid had been detected at the MS. n = 6 mice for each treatment. Gln inj, Glutamine injection. i, MS-proteomic analysis of tumours and skin from h showing 13C-proline incorporation into murine Col1a1 and Col1a2 peptides. H/L, ratio Heavy (13C)/Light (12C). Error bars indicate mean ± s.e.m. Error bars indicate mean ± s.e.m. P values were calculated with two-tailed unpaired t-test with Welch’s correction. Source data
Fig. 2
Fig. 2. Collagen producing CAFs and stroma express high levels of PYCR1.
a, Fold change in levels of proline synthesis enzymes between cCAFs and cNFs in an MS-proteomic analysis. The intensities of each protein, as the mean of their abundance in the fibroblasts, are shown on the y axis. n = 4 biological replicates. b, Representative western blot showing PYCR1 levels in paired CAFs and NFs. Vinculin (VCL) was used as a loading control. c, Expression of proline synthesis pathway and stromal markers in LCMD sections of norm. (normal) breast stroma and TNBC-associated stroma from Saleh et al.. Significance was calculated with two-tailed unpaired t-tests with Welch’s correction. d, Violin plots showing the expression levels of PYCR1 (probe g5902035_3p_a_at) and COL1A1 (probe Hs.172928.0.A2_3p_a_at) in laser-captured microdissected normal breast, DCIS and IDC stroma and epithelium from the Ma et al. dataset. Quantitative data downloaded from Oncomine. Median and quartiles are indicated with dashed lines. Significance was calculated with one-way ANOVA test with Sidak’s multiple comparison test. e, Gene expression correlation (Pearson) between PYCR1 and COL1A1 in IDC patients shown in d. f, Violin plots showing the expression of markers commonly associated to myCAF, iCAF (inflammatory CAF) and total CAF, and of PYCR1 in TNBC tumours from Wu et al.. g, UMAP visualization of stromal, immune and cancer cells (top plots) aligned using canonical correlation analysis in Seurat. Top left, cells are coloured by their cell type annotation from Wu et al.. Bottom panels contain only CAFs, as defined by Wu et al. h,i, Kaplan–Meier plots comparing overall survival of patients with IDC tumours expressing high or low levels of both COL1A1 and PYCR1. On the left of each curve is shown the distribution of breast cancer subtypes in the two subsets of patients. Data generated with cBioportal using TCGA Pan Cancer Atlas (h) and METABRIC (i). Source data
Fig. 3
Fig. 3. CAFs increase proline biosynthesis via PYCR1.
a, PYCR1 mRNA levels in cCAF transfected with siCtl/siPYCR1. n = 3 biological replicates. b, 13C-labelled (coloured) and unlabelled (black) proline in 13C-glutamine-labelled cCAFs transfected with siCtl, siPYCR1, siPYCR3 or siALDH18A1. n = 3 biological replicates. c, PYCR1 mRNA levels in pCAF2 expressing shCtl or shPYCR1. n = 3 biological replicates. d, 13C-labelled (coloured) and unlabelled (black) proline in shCtl/shPYCR1 expressing pCAF2, labelled with 13C-glutamine. n = 3 biological replicates e, 13C-labelled (coloured) and unlabelled (black) proline measured by MS in cCAFs treated with 20 µM PYCR1i/dimethyl sulfoxide (DMSO) control, labelled with 13C-glutamine. n = 3 biological replicates. f, Total 13C-labelled (coloured) and unlabelled (black) proline in pCAF3 expressing shCtl/shPYCR2, labelled with 13C-glutamine. n = 3 biological replicates g, Quantification of collagen produced by cCAFs transfected with siCtl/siPYCR1 and 500 µM proline/PBS control. n = 3 biological replicates. h,i, Representative western blot and quantification for COL6A1 of decellularized ECM generated from cCAF (h) and pCAF (i) transfected with sh/siCtl or sh/siPYCR1 with 500 µM proline/PBS control. COL6A1 signal was normalized by Ponceau S staining (Extended Data Fig. 9). n = 3 biological replicates. j,k, Representative images (j) and quantification (k) of collagen produced by CAFs treated with 20 µM PYCR1i/DMSO control and 500 µM proline/PBS control. n = 3 biological replicates. l,m, Representative images (l) and quantification (m) of collagen produced by pCAF2 and pCAF3s expressing shCtl/shPYCR1 and with 500 µM proline/PBS control. n = 3 biological replicates. n, COL1A1 mRNA levels in siCtl/siPYCR1 transfected cCAFs. n = 3 biological replicates. o, COL1A1 mRNA in pCAF2 expressing shCtl/shPYCR1. n = 3 biological replicates. p, Diricore analysis of ribosome stalling on proline codons in ECM mRNAs of pCAF2 transfected with siCtl/siPYCR1 with 500 μM proline/PBS control. n = 3 biological replicates. Scale bar, 50 µm. Error bars indicate mean ± s.e.m. P values were calculated with two-tailed unpaired t-test with Welch’s correction (a, c, d, f, n and o), one-way ANOVA with Dunnett’s multiple comparison test (b, e, h and i) or Kruskal–Wallis with Dunn’s multiple comparison test (g, k and m). Source data
Fig. 4
Fig. 4. Stromal PYCR1 regulates collagen production and tumour progression in vitro and in vivo.
a,b, Collagen quantification in 3D (a) and 2D cocultures (b). n = 3 biological replicates. c,d, Representative images (c) and quantification (d) of cCAF-derived collagen in 3D cocultures of CAFs and cancer cells treated with PYCR1i/DMSO control, and proline. n = 3 biological replicates. e,f, Representative images (e) and quantification (f) of cCAF-derived collagen in 2D cocultures of cCAFs siCtl/siPYCR1 and cancer cells, treated with 500 μM proline, 20 μg ml−1 collagen I or PBS control. n = 3 biological replicates. g, EdU incorporation of cancer cells in 2D cocultures with cCAFs siCtl/siPYCR1, treated with 500 μM proline, 20 μg ml−1 collagen I or PBS control. n = 3 biological replicates. h, EdU incorporation of cancer cells cultured on ECM from CAFs treated with 20 μM PYCR1i/DMSO control and 500 μM proline/PBS control. Control is the same as Figs. 5v and 6q. n = 3 biological replicates. i,j, Tumour volume (i) and weight (j) of MCF10DCIS.com xenografts cotransplanted with pCAF2 shCtl/shPYCR1. n = 12 mice for each condition from two experiments (six mice per experiment). k,l, Representative images (k) and quantification (l) of second harmonic generation signal surrounding shCtl/ shPYCR1 CAFs in tumours from i. n = 6 mice from each condition. m, Area of shCtl or shPYCR1 CAFs in tumours from l. n,o, Tumour volume (n) and weight (o) of 4T1 tumours cotransplanted with pCAF2 shCtl/shPYCR1. n = 6 mice for each condition. p, RT–qPCR quantification of circulating tumour cell DNA in blood from mice from n. q, RT–qPCR quantification of tumour cell DNA in lungs from mice with 4T1 tumours cotransplanted with pCAF2 shCtl/shPYCR1. n = 12 mice for each condition from two experiments (six mice per experiment). r, Sirius Red quantification in tumours from q. s, Quantification of transplanted CAFs in tumours from q. Error bars indicate mean ± s.e.m. P values were calculated with two-tailed Mann–Whitney test (a, b, i, j and ls) or one-way ANOVA with Dunnett’s multiple comparison test (d, e, g and h). Scale bar, 50 µm. a.u., arbitrary units. Source data
Fig. 5
Fig. 5. H3 acetylation regulates collagen production in CAFs.
a, 13C-labelled (coloured) and unlabelled (black) acetyl-CoA in 13C-glucose labelled cCAFs/NFs. n = 3 biological replicates. b, SILAC ratios of regulatory histone acetylation sites identified in cNFs/cCAFs. n = 5 biological replicates. c, Representative of three western blots showing H3K27ac in NFs and CAFs. d,e, Representative western blot (d) and quantification (e) showing H3K27ac in cCAFs with 25 μM c646/DMSO control. n = 5 biological replicates. GAPDH, glyceraldehyde 3-phosphate dehydrogenase. f,g, Representative western blot (f) and quantification (g) showing H3K27ac in cCAFs with 3 μM A-485/DMSO control. n = 3 biological replicates. h, Volcano plot of cCAF proteome with 25 μM c646/DMSO control. n = 3 biological replicates. Plot coloured using density estimation function in MaxQuant. i,j, Representative images (i) and quantification (j) cCAF-derived collagen with 25 μM c646/DMSO control. n = 5 biological replicates. k,l, Representative western blot (k) and quantification (l) of COL6A1 in cCAF-derived ECM with 25 μM c646/DMSO control. n = 3 biological replicates. m,n, Representative western blot (m) and quantification (n) of COL6A1 cCAF-derived ECM with 3 μM A-485/DMSO control. n = 3 biological replicates. o, mRNA quantification in cCAFs with 25 μM c646/DMSO control. n ≥ 3 biological replicates. p,q, Representative images (p) and quantification (q) of collagen in 3D CAF/cancer cell cocultures with c646/DMSO control. n = 3 biological replicates. r,s, Representative images (r) and quantification (s) of collagen in 2D CAF/cancer cell cocultures with 25 μM c646/DMSO control. n = 3 biological replicates. t,u, Proliferation of cancer cells (t) and CAFs (u) in 2D coculture with 25 μM c646/DMSO control. n = 3 biological replicates. v, Proliferation of cancer cells seeded on ECM from CAFs treated with 25 μM c646/DMSO control. n = 3 biological replicates. Error bars indicate mean ± s.e.m. Significance was calculated with two-tailed, unpaired t-test with Welch’s correction (a and o), two-tailed Mann–Whitney test (e, g, j, l, n, s, t, u and v) or one-way ANOVA with Dunnett’s multiple comparison test (q). Scale bars, 50 µm (i) and 200 µm (r). See Extended Data Fig. 9 for Ponceau S staining of blots used for COL6A1 in ECM, used as loading control. Source data
Fig. 6
Fig. 6. Nucleo-cytosolic acetyl-CoA regulates collagen production.
a, 13C-labelled metabolite incorporation in cCAF cultured in DMEM or physiol. DMEM (5 mM glucose, 0.65 mM glutamine, 100 µM pyruvate and 100 µM acetate). b, Acetyl-CoA production/export from mitochondria. c, Unlabelled (black) and 13C-labelled (coloured) acetyl-CoA in 13C-glucose labelled cCAFs with 50 μM BMS303141/DMSO control and 1 mM acetate/PBS control. d,e, Representative western blot (d) and quantification (e) showing H3K27ac in CAFs with 50 μM BMS303141/DMSO control and 1 mM acetate/PBS control. n = 4–6 biological replicates. f, Representative western blot of PYCR1 in cCAFs with 50 μM BMS303141/DMSO control and 1 mM acetate/PBS control (1 of 3). g, mRNA quantification in cCAFs with 50 μM BMS303141/DMSO control and 1 mM acetate/PBS control. n = 3 biological replicates. h, Collagen quantification with 1 mM acetate/PBS control. n = 3 biological replicates. i,j, Representative images (j) and quantification (i) of collagen in 2D cCAF/cancer cell cocultures with 50 μM BMS303141/DMSO control and 1 mM acetate/PBS control. n = 3 biological replicates. k,l, Representative images (k) and quantification (l) of collagen in 3D cCAF/cancer cell cocultures with BMS303141/DMSO control and 1 mM acetate/PBS control. n = 3 biological replicates. m,n, Representative western blot (m) and quantification (n) of COL6A1 in ECM from cCAFs with 50 μM BMS303141/DMSO control and 1 mM acetate/PBS control. n = 3 biological replicates. o,p, Proliferation of cancer cells (o) and CAFs (p) in cocultures treated with 50 μM BMS303141/DMSO control. n = 3 biological replicates. q, Proliferation of cancer cells seeded on ECM from cCAFs treated with 50 μM BMS303141/DMSO control and 1 mM acetate/PBS control. n = 3 biological replicates. Error bars indicate mean ± s.e.m. P values were calculated with two-tailed, unpaired t-test with Welch’s correction (a), two-tailed Mann–Whitney test (o and p), one-way ANOVA with Dunnett’s multiple comparison test (c, g, i, l and n) or Kruskal–Wallis with Dunn’s multiple comparison test (e and q). Scale bar, 200 µm. See Extended Data Fig. 9 for Ponceau S staining of blots used for COL6A1 in ECM, used as loading control. Source data
Fig. 7
Fig. 7. PDK2 regulates PDH activity and acetyl-CoA production in CAFs.
a, Predicted kinase activity in cCAFs compared to cNFs based on the modelling of their MS-based phosphoproteomic data. b,c, Representative western blots (b) and quantification (c) showing PDHA1 phosphorylation levels at the regulatory site S293 in mammary NFs and CAFs. VCL was used as a loading control. n = 3 or 4 biological replicates. d, Pyruvate dehydrogenase activity of NFs and CAFs measured as the rate of NAD+ reduction in vitro. n = 3–6 biological replicates. e, Representative western blot showing PDK2 levels in paired mammary NFs and CAFs. VCL was used as a loading control. f, PDK1–4 expression in mammary NFs and CAFs in culture, measured by qPCR and normalized to 18S expression. n = 4 biological replicates. g, PDK1–4 mRNA expression in LCMD sections of normal and TNBC-associated stroma from Saleh et al.. h,i, Representative western blot (h) and quantification (i) showing PDHA1 phosphorylation levels in cNFs transfected with siCtl or siPDK1–4. n = 3 biological replicates. VCL was used as a loading control. j, Intracellular acetyl-CoA unlabelled (black) and 13C2-labelled (coloured) from 13C6-glucose measured by MS in cNFs transfected with siCtl or siPDK2. n = 3 biological replicates. k, Representative western blot showing PDHA1 phosphorylation levels in cCAFs transfected with empty vector, pGC-PDK2N255A or pGC-PDK2WT. l, 13C2-labelled (coloured bar) and unlabelled (black bar) acetyl-CoA measured by MS in cCAFs transfected with empty vector, pGC-PDK2N255A or pGC-PDK2WT and labelled with 13C6-glucose. n = 3 biological replicates. Error bars indicate mean ± s.e.m. P values were calculated with two-tailed, unpaired t-test with Welch’s correction (g and j), two-tailed Mann–Whitney test (c and d), two-way ANOVA with Tukey’s multiple comparisons test (f), one-way ANOVA with Dunnett’s multiple comparison test (l) or Kruskal–Wallis with Dunn’s multiple comparison test (i). Source data
Fig. 8
Fig. 8. PDH activation regulates collagen production in CAFs.
a,b, Representative western blot (a) and quantification (b) of H3K27ac in cCAFs transfected with pGC-PDK2N255A/pGC-PDK2WT with 1 mM acetate/PBS control. n = 4 biological replicates. c,d, Representative western blot (c) and quantification (d) of H3K27ac in pCAF2 transfected with pGC-PDK2N255A or pGC-PDK2WT with 1 mM acetate/PBS control. n = 3 biological replicates. e, mRNA quantification in cCAFs transfected with pGC-PDK2N255A/pGC-PDK2WT. n = 3–5 biological replicates. f, mRNA expression of COL1A1, COL6A1 and PYCR1 in pCAF2 transfected with pGC-PDK2N255A/pGC-PDK2WT with 1 mM acetate/PBS control. n = 3 biological replicates. g, Quantification of COL6A1 levels in ECM from cCAFs transfected with pGC-PDK2N255A/pGC-PDK2WT and with 1 mM acetate/PBS control. n = 3 biological replicates. h,i, Representative western blot (h) and quantification (i) of H3K27ac in cNFs transfected with siCtl/siPDK2 with c646/DMSO control. n = 4 biological replicates. j,k, Representative western blot (j) and quantification (k) of H3K27ac in pNF2 transfected with siCtl/siPDK2 with c646/DMSO control. n = 4 biological replicates. β-tubulin was used as a loading control. l,m, mRNA quantification in cNFs (l) and pNF2 (m) transfected with siCtl/siPDK2 with c646/DMSO control. n = 6 or 4 biological replicates. n, Quantification of COL6A1 in decellularized ECM derived from pNF transfected with siCtl/siPDK2 with c646/DMSO control. n = 3 biological replicates. o,p, Representative western blot (o) and quantification (p) of COL6A1 in decellularized ECM derived from cNFs transfected with siCtl, siPDK2 or siPDK2 + siPYCR1. n = 3 biological replicates. q,r, Representative western blot (q) and quantification (r) of COL6A1 in ECM derived from pNF2 transfected with siCtl, siPDK2 or siPDK2 + siPYCR1. n = 3 biological replicates. Error bars indicate mean ± s.e.m. P values were calculated with one-way ANOVA with Dunnett’s multiple comparison test (e, f, l and m) or Kruskal–Wallis with Dunn’s multiple comparison test (b, d, g, I, k, n, p and r). See Extended Data Fig. 9 for Ponceau S staining of blots used for COL6A1 in ECM, used as loading control. Source data
Extended Data Fig. 1
Extended Data Fig. 1. Characterisation of mammary CAF/NF pairs.
a. Representative of 2 confocal microscopy images of vimentin staining in mammary CAF and NF pairs. Scale bar = 20 µm. b. Representative of 3 confocal microscopy images of keratin 18 (KRT18) staining in mammary CAF and NF pairs and MCF10DCIS.com breast cancer cells. Scale bar = 20 µm. c. Representative of >3 western blots showing α-SMA levels in mammary NFs and CAFs. d, e. Representative images (d) and quantification (e) of collagen produced by mammary NFs and CAFs. p-values were calculated with a 2-tailed unpaired t-test with Welch’s correction. Scale bar = 50 µm. N = 3 biological replicates. f. Fold change in total levels of glycolysis, TCA cycle and amino acid metabolites measured by MS analysis between paired CAFs and NFs. N = 3 biological replicates. g. Fold change in 13C-Glutamine labelled glycolysis, TCA cycle and amino acid metabolites measured by MS analysis between paired CAFs and NFs. N = 3 biological replicates. h. Fold change in 13C-Glucose labelled glycolysis, TCA cycle and amino acid metabolites measured by MS analysis between paired CAFs and NFs. N = 3 biological replicates. i. Fold change in 13C-Glutamine labelled metabolites between cCAFs cultured in standard DMEM with 13C-Glutamine or physiological DMEM (5 mM glucose, 0.65 mM glutamine, 100 µM pyruvate, 100 µM acetate) with 13C-Glutamine measured by MS-metabolomics. N = 3 biological replicates. j. Fold change in total levels of metabolites between cCAFs cultured in standard DMEM or physiological DMEM, measured by MS-metabolomics. N = 3 biological replicates. k. Total 13C-labelled proline in cCAFs cultured in physiological DMEM with 13C-Glutamine ± 200 µM proline, measured by MS-metabolomics. N = 3 biological replicates. l. Murine Col1a1 and Col1a2 protein levels in the tumour and skin tissues of mice carrying MCF10DCIS.com xenografts. N = 6 mice. m. mRNA levels of PYCR1, PYCR2 and PYCR3 in cCAFs, normalised to 18S levels. N = 3 biological replicates. n. mRNA levels of PYCR1, PYCR2 and PYCR3 in pCAF2 measured by qPCR and normalised to 18S levels. N = 3 biological replicates. Error bars indicate mean ± SEM. Source data
Extended Data Fig. 2
Extended Data Fig. 2. PYCR1 and COL1A1 expression in CAFs and cancer patients.
a. UMAP visualisation of stromal, immune and cancer cells aligned using canonical correlation analysis in Seurat. Cell types defined as in Wu et al. b. UMAP visualisation of CAFs, with iCAF and myCAF as defined in Wu et al. c. UMAP visualisation of CAFs, as defined in Wu et al., aligned using canonical correlation analysis in Seurat. d. Kaplan-Meier plots comparing the disease specific survival of patients with tumours expressing high (top quartile) or low (bottom quartile) levels of both COL1A1 and PYCR1. Data generated with cBioportal using TCGA Pan Cancer Atlas for the indicated tumour types. Source data
Extended Data Fig. 3
Extended Data Fig. 3. PYCR1 expression regulates proline synthesis and collagen production.
a. Representative of 3 western blots of PYCR1 in cCAF and pCAF2 transfected with siCtl/siPYCR1. b. PYCR1 mRNA in pCAF2 transfected with siCtl/siPYCR1. N = 3 biological replicates c. Total 13C-labelled (coloured) and unlabelled (black) proline in pCAF2 siCtl/siPYCR1, labelled with 13C5-Glutamine. N = 3 biological replicates d. Representative of 3 western blots of PYCR1 in shCtl and shPYCR1 pCAFs. e. 13C-labelled (coloured) and unlabelled (black) proline in pCAF3 shCtl/shPYCR1, labelled with 13C5-Glutamine,. N = 3 biological replicates. f. Proliferation of cCAF siCtl/siPYCR1. N = 3 biological replicates g. Proliferation of cCAF with 20 μM PYCR1i/DMSO control. N = 3 biological replicates. h. Representative of 3 western blots of cCAF siCtl/siALDH18A1. i. Representative of 2 western blots of cCAF siCtl/siPYCR3. j. Representative of 2 western blots of pCAF2/pCAF3 shCtl/shPYCR2. k. 13C-labelled proline in cCAFs with 50 nM CB-839/DMSO, labelled with 13C5-glutamine. N = 3 biological replicates. l. Collagen in cCAFs with 50 nM CB-839/DMSO. N = 3 biological replicates. m. Representative image of collagen produced by cCAF siCtl/siPYCR1 treated with 500 µM proline/PBS (quantification in Fig. 3g). n. Quantification of collagen produced by cCAFs treated with 500 μM proline/PBS. N = 3 biological replicates. o, p. Representative images (o) and quantification (p) of collagen from pCAF shCtl/shPYCR2 treated with 500 μM proline/PBS control. N = 3 biological replicates. q, r. Quantification (r) and representative images (q) of collagen produced by cCAF siCtl, siPYCR1 siPYCR3 or siALDH18A1. N = 3 biological replicates. s. Total 13C-labelled (coloured) and unlabelled (black) proline in cNFs transfected with pENTER-PYCR1 or pENTER-control, labelled with 13C5-Glutamine. N = 3 biological replicates. t, u. Quantification (t) and representative images (u) of collagen from cNFs transfected with pENTER-PYCR1 or pENTER-control. N = 3 biological replicates. v. Representative of 2 western blots of cNFs transfected with pENTER- PYCR1 pENTER-control. Error bars indicate mean ± SEM. p-values were calculated with 2-tailed, unpaired t-test with Welch’s correction (b, c, e, f, g, k, s), 2-tailed Mann-Whitney test (l, n, t) or Kruskal-Wallis with Dunn’s multiple comparison test (q). Scale bar = 50 µm. Source data
Extended Data Fig. 4
Extended Data Fig. 4. PYCR1 regulates collagen production in vitro and in vivo.
a. Ribosome read density, at proline codons compared to Leucine codons in pCAF2 transfected with siCtl/siPYCR1. b. Correlation between % proline residues in ECM proteins and the increase in ribosome stalling in siPYCR1 compared to siCtl transfected pCAF2. c, d. Representative western blot (c) and quantification (d) of COL6A1 levels in ECM derived from 2D cCAF/cancer cell co-cultures with 20 μM PYCR1i/DMSO control, and 500 μM proline/PBS control. N = 3 biological replicates. e, f. Quantification (e) and representative images of collagen in 2D cCAF/cancer cell co-cultures with 20 μM PYCR1i/DMSO control, and 500 μM proline/PBS control. N = 3 biological replicates. Scale bar = 250 µm. g, h. Proliferation of cancer cells (g) and CAFs (h) in 2D cCAF/cancer cell co-cultures with 20 μM PYCR1i/DMSO control. N = 3 biological replicates i. EDU incorporation of breast cancer cells in mono-culture after treatment with DMSO control, 25 μM c646, 50 μM BMS303141, 20 μM PYCR1i or 50 μM CPI-613. N = 3 biological replicates. j. Representative images of Sirius Red staining in FFPE sections of 4T1 tumours co-transplanted with pCAF2 shCtl/shPYCR1 (quantification in Fig. 4s). Scale bar = 1000 µm. k. Quantification of Pimonidazole staining in FFPE sections of 4T1 tumours co-transplanted with pCAF2 shCtl/shPYCR1. N = 12 mice for each condition from two independent experiments. l. Quantification of Pecam1 staining in FFPE sections of tumours from (k). m-q. Quantification and representative western blots of acetylation levels at histone sites between cNFs and cCAFs. N = 3 or 4 biological replicates. Error bars indicate mean ± SEM. p values were calculated with a two-tailed Pearson r correlation (b), Kruskal-Wallis with Dunn’s multiple comparison test (d, e, i) or two-tailed t-test with Welch’s correction (g, h, m, n, o p, q). See Extended Data Fig. 9 for Ponceau-S staining of the blots used for COL6A1 in ECM, used as loading control. Source data
Extended Data Fig. 5
Extended Data Fig. 5. Histone acetylation regulates collagen production in CAFs.
a-d. H3K27ac (a, b) and p300 (c, d) enrichment at COL1A1 and PYCR1 promoter regions in cNFs and cCAFs, measured by ChIP-qPCR. Signal was normalised to the input sample. N = 5 biological replicates. e. Representative of 4 western blots for H3K27ac in cCAFs treated with c646. f. Representative of 4 western blots of COL6A1 produced by cCAFs treated with 25 μM c646/DMSO control and 500 μM proline/PBS control. g. Representative of 3 western blots of EP300 in cCAFs transfected with siCtl/sip300. h, i. Representative images (i) and quantification (j) of collagen in co-cultures of cCAFs transfected with siCtl or sip300, and cancer cells. Cocultures were treated with 500 μM proline, 20 μg/ml collagen I, or PBS control. N = 3 biological replicates. Scale bar = 200 µm j. Proliferation of cancer cells in 2D cocultures of cCAFs transfected with siCtl /sip300, and cancer cells. Cocultures were treated with 500 μM proline, 20 μg/ml collagen I, or PBS as control. N = 3 biological replicates. k. Representative of >10 images of cCAFs showing co-localisation of PDHA1 with mitochondria (MitoTracker). Scale bar = 50 µm. l, m. Representative of 4 western blots of PDHA1 (l) and ACLY (m) in subcellular fractions of cCAFs. Na/K ATPase = membrane marker, ATP5A = mitochondrial marker, GAPDH = cytosolic marker, H3 = nuclear marker. n. Total acetyl-CoA in cCAF treated with DMSO control, or BMS303141 at the indicated concentrations. N = 3 biological replicates. o. 13C-glucose-labelled (coloured) and unlabelled (black) citrate in cCAFs with 50 µM BMS303141/DMSO control. N = 3 biological replicates. p, q. Representative western blot (p) and quantification (q) of H3K27 levels in cCAFs with 1 mM acetate/PBS control. N = 3 biological replicates. r. mRNA levels in pCAF2 with 50 µM BMS303141 or DMSO control and acetate or PBS control. N = 3-5 biological replicates. Error bars indicate mean ± SEM. p-values were calculated with 2-tailed Mann-Whitney test (a-d, n, p), 2-tailed unpaired t-test with Welch’s correction (p) Kruskal-Wallis with Dunn’s multiple comparisons test (i,j,o) or 1-way ANOVA with Dunnett’s multiple comparisons test (r). Source data
Extended Data Fig. 6
Extended Data Fig. 6. PDK2 regulates acetyl-CoA production in patient derived fibroblasts.
a. Representative of 2 western blots showing levels of PDK1, PDK3 and PDK4 in mammary NFs and CAFs. b. UMAP visualisation of stromal, immune and cancer cells (top) or CAF-only (bottom) aligned using canonical correlation analysis in Seurat. Cell types defined as in Wu et al. c,d. Representative of 3 western blots showing expression of PDK1-4 after transfection with siCtl or the respective siRNA in cNF (c) and pNF2 (d). e. 13C-labelled (coloured) and unlabelled (black) acetyl-CoA in cNF2 transfected with siCtl or siPDK1,3,4, labelled with 13C6-glucose. N = 3 biological replicates. f,g. Representative western blot (f) and quantification (g) showing pPDHA1 levels in pNF2 transfected with siCtl /siPDK1-4. N = 3 biological replicates. h. 13C-labelled (coloured) and unlabelled (black) acetyl-CoA in pNF2 transfected with siCtl/siPDK1-4, labelled with 13C6-glucose. N = 3 biological replicates. i. Representative of 2 western blots showing PDK2 levels in cNF transfected with siCtl, siPDK1, siPDK3, or siPDK4. j,k. Representative of 2 western blots showing the levels of overexpression of PDK2 wild type (PDK2WT) or the enzymatically inactive mutant form (PDK2N255A) in cCAF (j) and pCAF2 (k) after transfection with empty vector (Ctl), pGC-PDK2N255A/pGC-PDK2WT. l. 13C-labelled (coloured bar) and unlabelled (black bar) acetyl-CoA in pCAF2 transfected with empty vector/pGC-PDK2N255A/pGC-PDK2WT and labelled with 13C6-glucose. N = 3 biological replicates. m. Representative of 3 western blots showing PDHA1 phosphorylation levels in pCAF2 after transfection with empty vector/pGC-PDK2N255A/pGC-PDK2WT. Error bars indicate mean ± SEM. p-values were calculated with 1-way ANOVA with Dunnett’s multiple comparisons test (e, h, l) or Kruskal-Wallis with Dunn’s multiple comparisons test (g) VCL = vinculin. Source data
Extended Data Fig. 7
Extended Data Fig. 7. PDH inhibition regulates collagen production.
a. Representative western blot (quantification in Fig. 8g) showing COL6A1 levels in ECM derived from cCAF transfected with pGC-PDK2N255A/pGC-PDK2WT and treated with acetate or PBS control. b, c. Representative western blot (b) and quantification (c) of H3K27ac levels in cCAF with 50 µM CPI-613 or DMSO control. N = 3 biological replicates. d. Expression of COL1A1 and COL6A1 in cCAF with 50 µM CPI-613 or DMSO control, normalised to 18S expression. N = 3 biological replicates. e, f. Representative confocal microscopy images (e) and quantification (f) of collagen produced by cCAF with 50 µM CPI-613 or DMSO control and 1 mM acetate or PBS, as control. N = 3 biological replicates. Scale bar = 100 µm. g, h. Representative western blot (g) and quantification (h) of H3K27ac levels in cNF treated with acetate or PBS control. N = 3 biological replicates. i, j. Representative western blot (i) and quantification (j) of COL6A1 levels in decellularised ECM derived from cNF treated with 1 mM acetate or PBS control. N = 3 biological replicates. k. Expression of PYCR1, COL1A1 and COL6A1 in cNF with 1 mM acetate or PBS control, normalised to 18S expression. N = 3 biological replicates. l. Representative western blot of COL6A1 levels in ECM derived from cNF transfected with siCtl/siPDK2 with 25 µM c646/DMSO control (quantification in Fig. 8m). m, n. Representative of 2 western blots showing PDK2 and PYCR1 levels in cNF (m) and pNF2 (n) transfected with siCtl, siPDK2 or siPDK2 and siPYCR1. Error bars indicate mean ± SEM. p-values were calculated with 2-tailed, paired t-test (c-e, h), 2-tailed, unpaired t-test (j, k) or Kruskal Wallis with Dunn’s multiple comparisons test (f). Scale bar = 50 µm. VCL = vinculin. See Extended Data Fig. 9 for Ponceau-S staining of blots used for COL6A1 in the ECM, used as a loading control. Source data
Extended Data Fig. 8
Extended Data Fig. 8. Working model.
Scheme showing how PDH-derived acetyl-CoA and PYCR1-derived proline act together to stimulate and maintain collagen production in CAFs.
Extended Data Fig. 9
Extended Data Fig. 9. Loading controls for ECM western blots.
a. Ponceau S total protein stain for blot shown in Fig. 3h. b. Ponceau S total protein stain for blot shown in Fig. 3i. c. Ponceau S total protein stain for blot shown in Extended Data Fig. 4c. d. Ponceau S total protein stain for blot shown in Fig. 5k. e. Ponceau S total protein stain for blot shown in Fig. 5m. f. Ponceau S total protein stain for blot shown in Extended Data Fig. 5f. g. Ponceau S total protein stain for blot shown in Fig. 6m. h. Ponceau S total protein stain for blot shown in Fig. 8o. i. Ponceau S total protein stain for blot shown in Fig. 8q. j. Ponceau S total protein stain for blot shown in Extended Data Fig. 7a. k. Ponceau S total protein stain for blot shown in Extended Data Fig. 7i. l. Ponceau S total protein stain for blot shown in Extended Data Fig. 7l.

References

    1. Sahai E, et al. A framework for advancing our understanding of cancer-associated fibroblasts. Nat. Rev. Cancer. 2020;20:174–186. - PMC - PubMed
    1. Santi A, Kugeratski FG, Zanivan S. Cancer associated fibroblasts: the architects of stroma remodelling. Proteomics. 2017;18:e1700167. - PMC - PubMed
    1. Wu SZ, et al. Stromal cell diversity associated with immune evasion in human triple-negative breast cancer. EMBO J. 2020;39:e104063. - PMC - PubMed
    1. Pearce OMT, et al. Deconstruction of a metastatic tumor microenvironment reveals a common matrix response in human cancers. Cancer Discov. 2018;8:304–319. - PMC - PubMed
    1. Finak G, et al. Stromal gene expression predicts clinical outcome in breast cancer. Nat. Med. 2008;14:518–527. - PubMed

Publication types

MeSH terms