. 2022 Jun;4(6):739-758.
doi: 10.1038/s42255-022-00593-x. Epub 2022 Jun 27.

Impaired oxygen-sensitive regulation of mitochondrial biogenesis within the von Hippel-Lindau syndrome

Affiliations

Impaired oxygen-sensitive regulation of mitochondrial biogenesis within the von Hippel-Lindau syndrome

Shuijie Li et al. Nat Metab. 2022 Jun.

Erratum in

Abstract

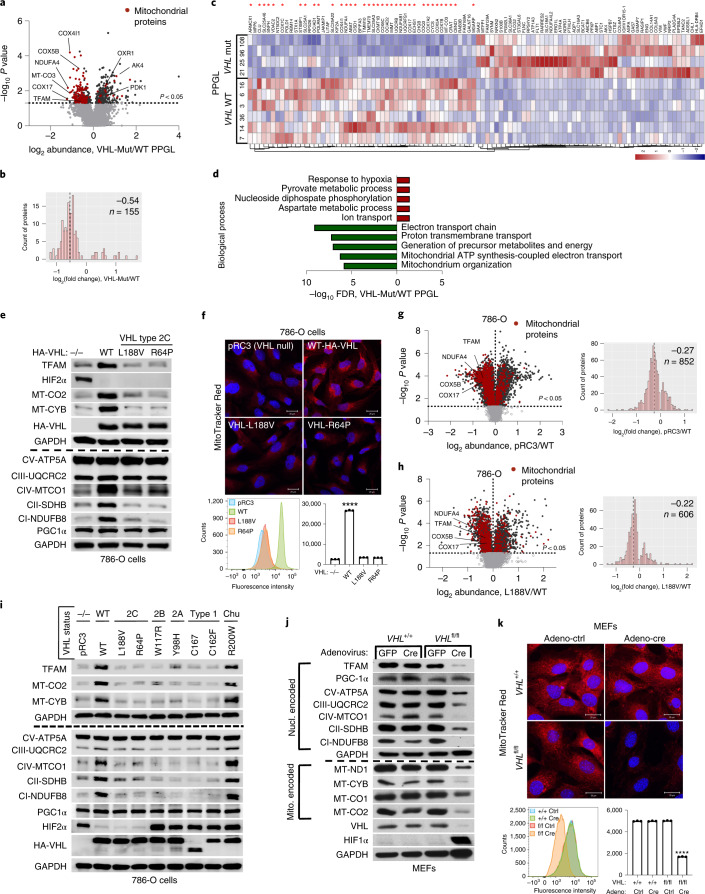
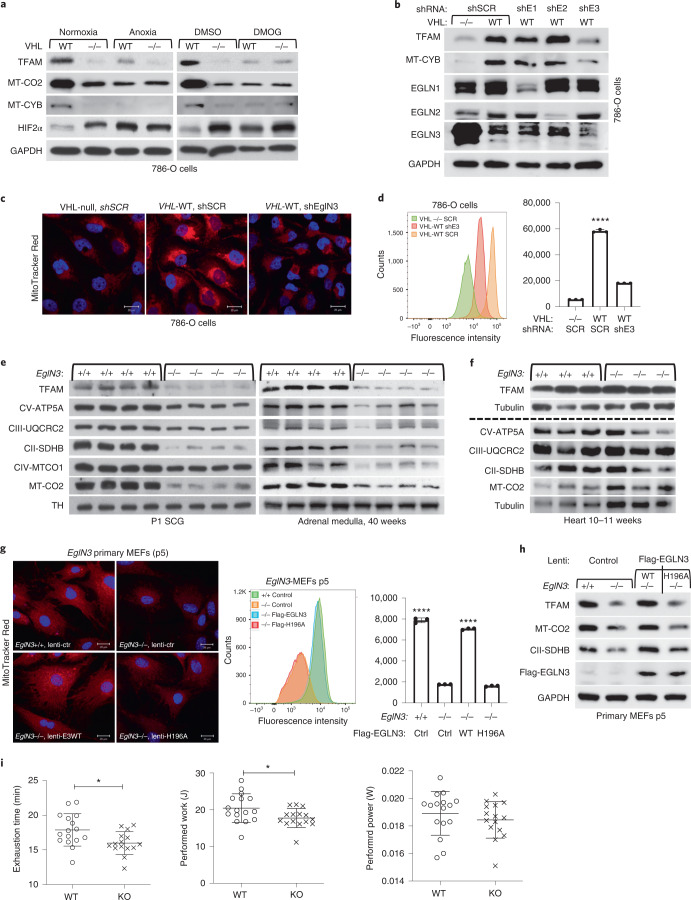
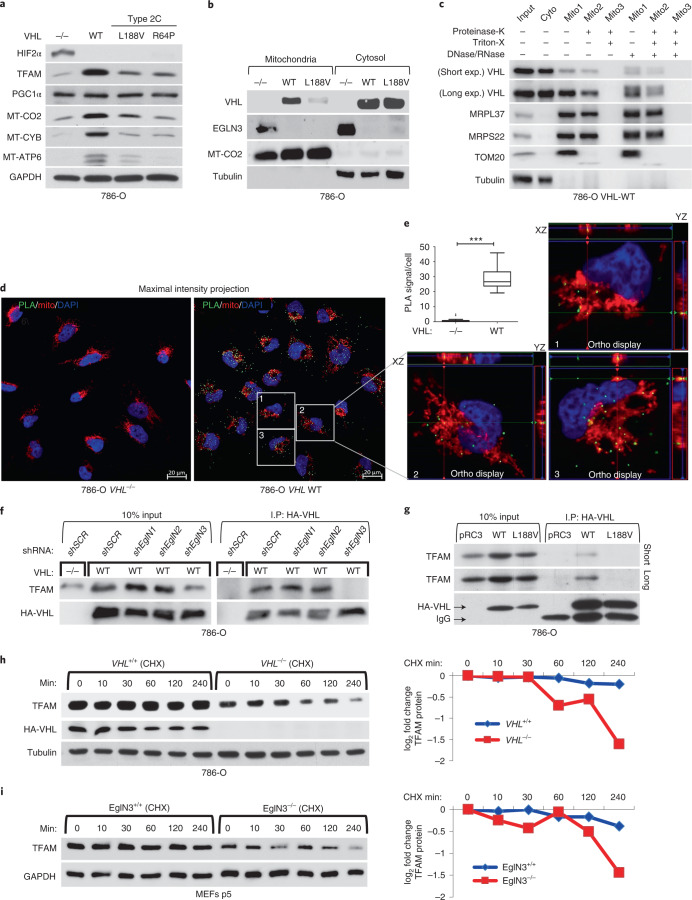
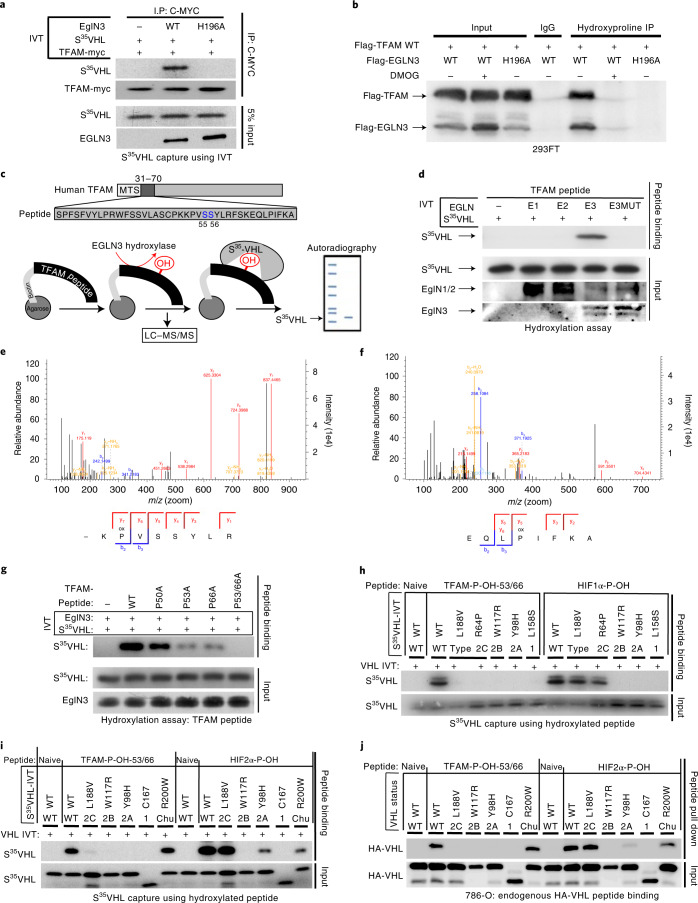
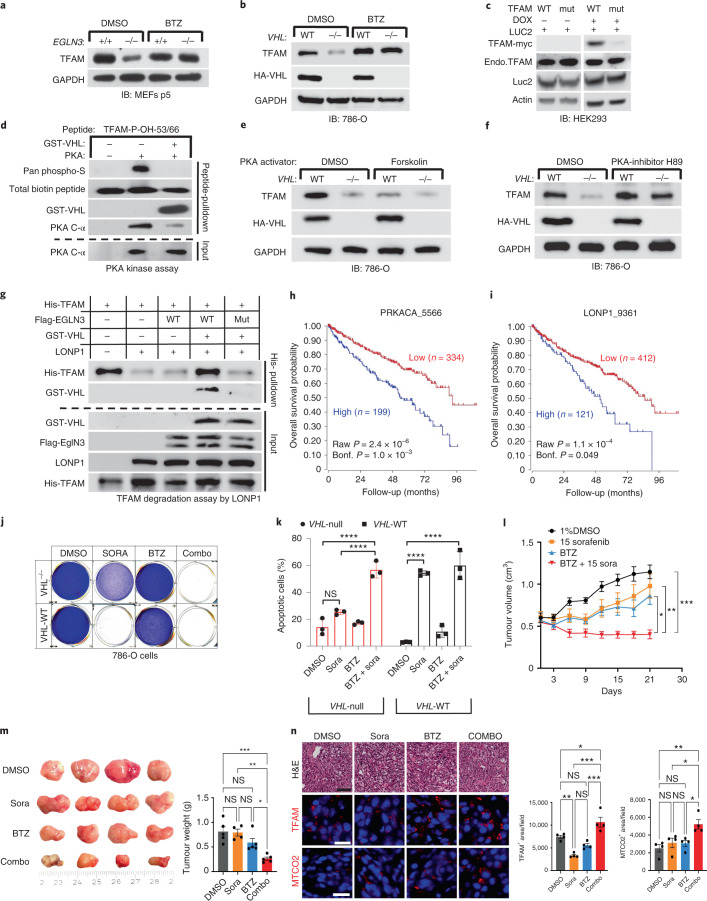
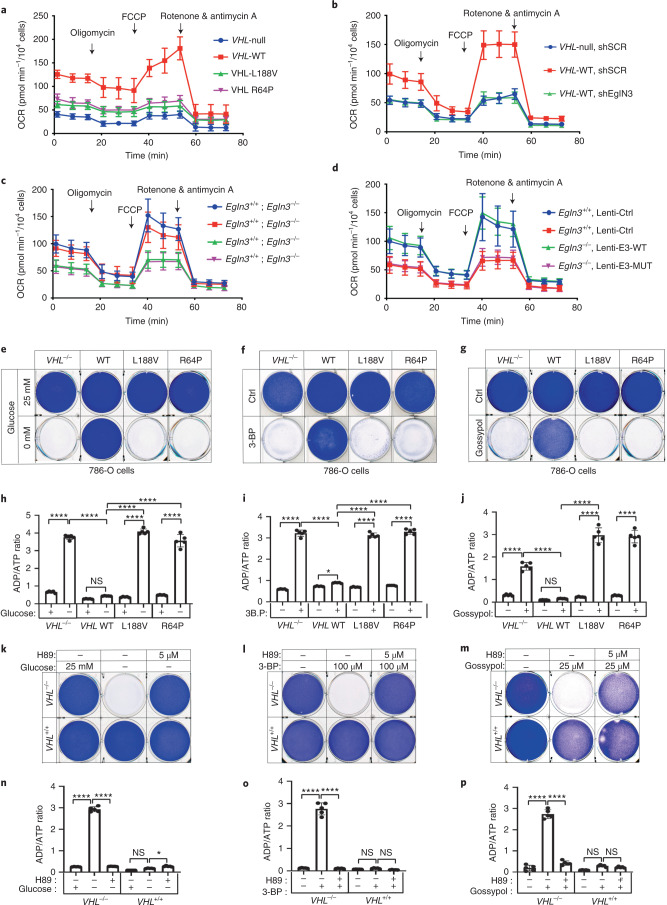
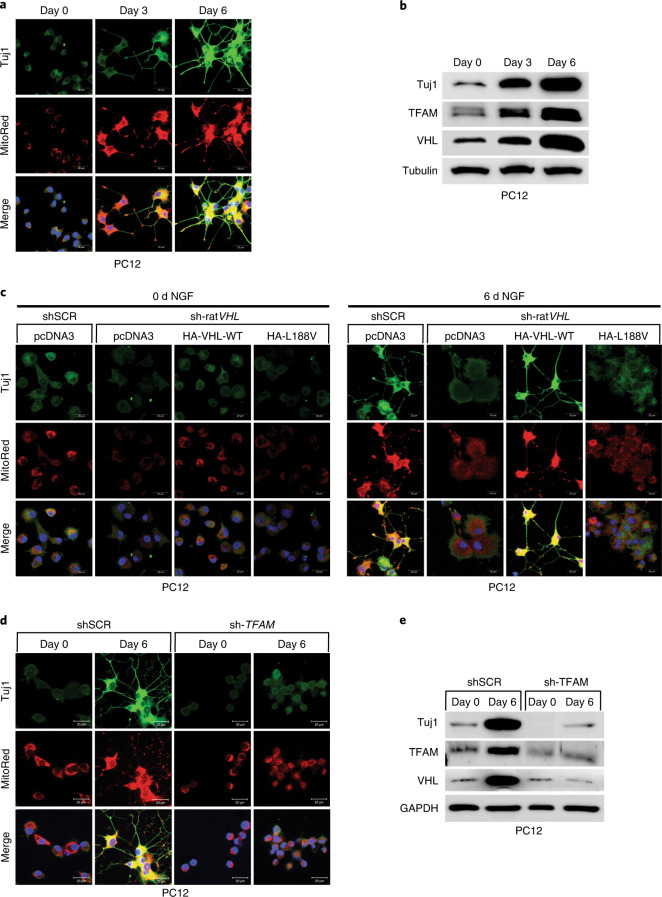
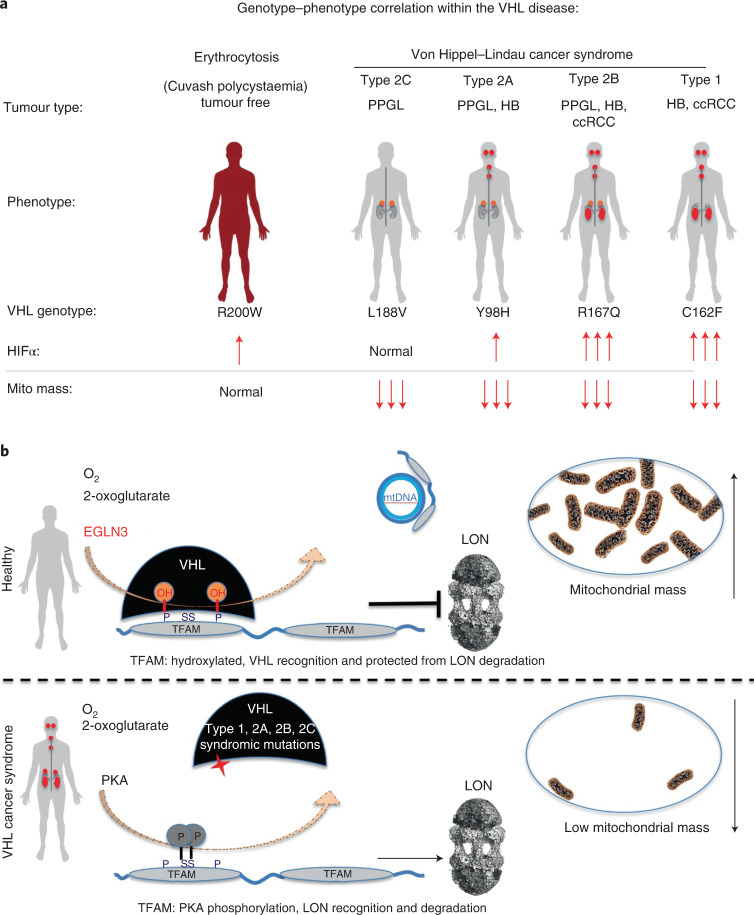
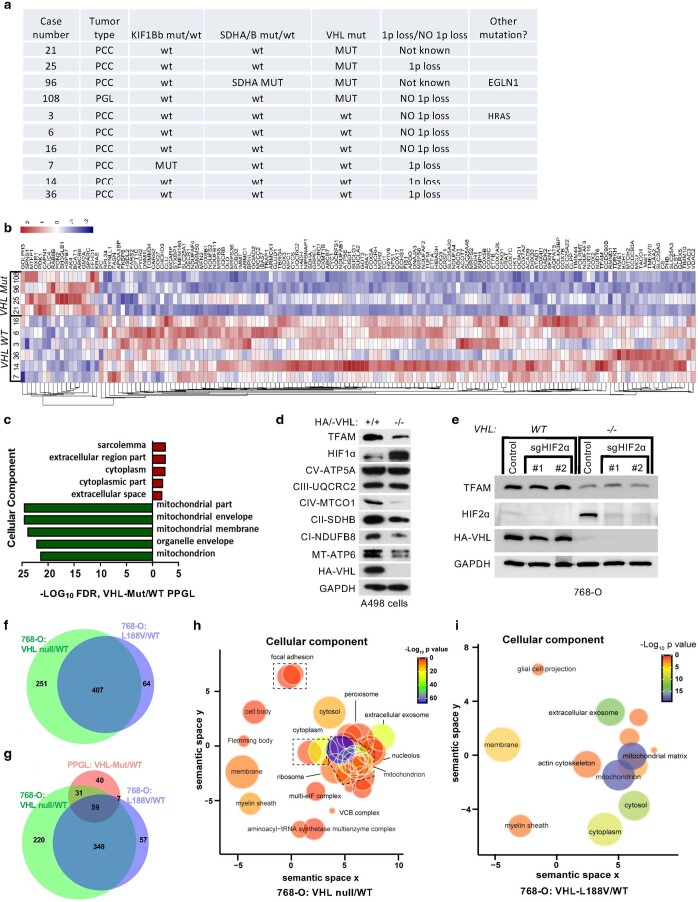
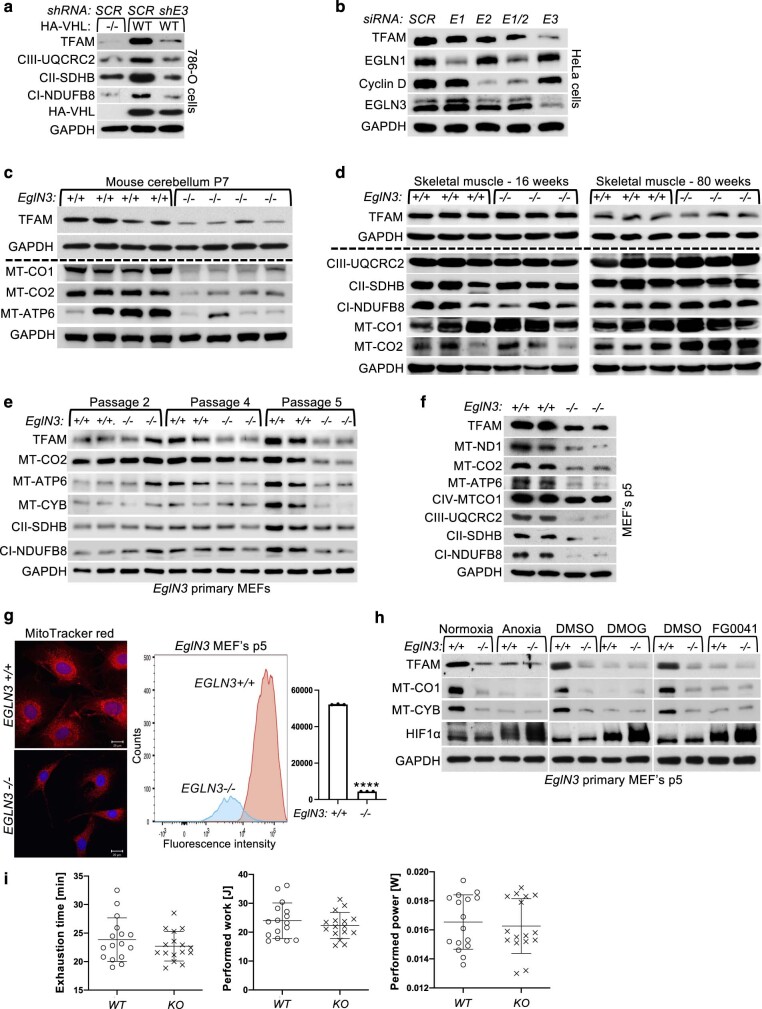
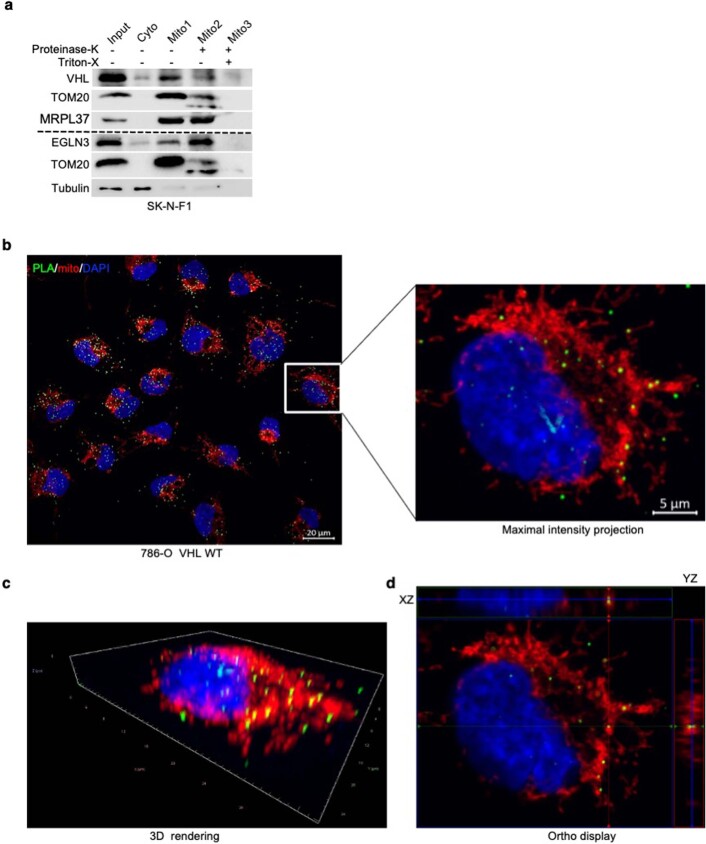
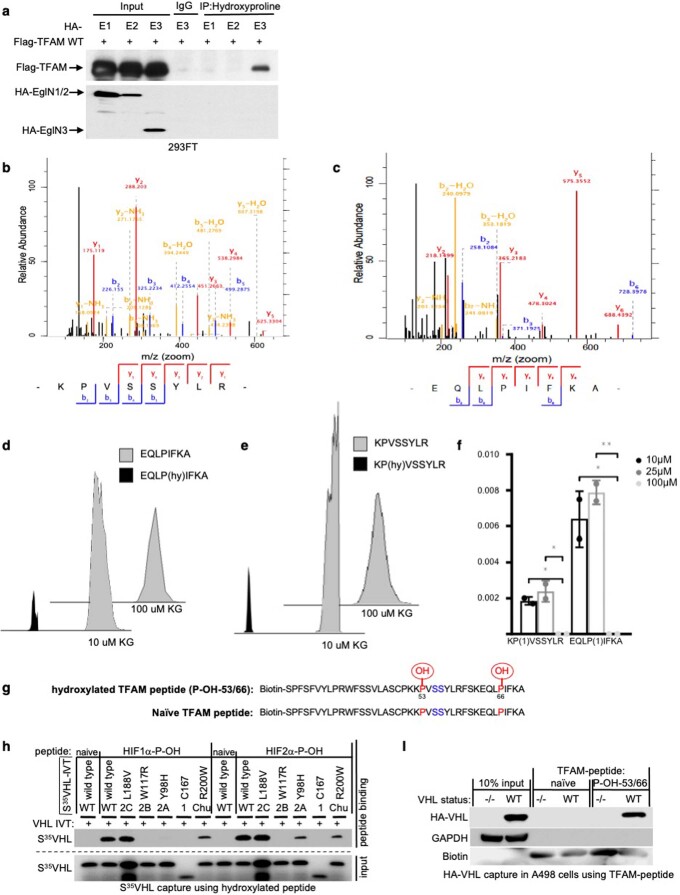
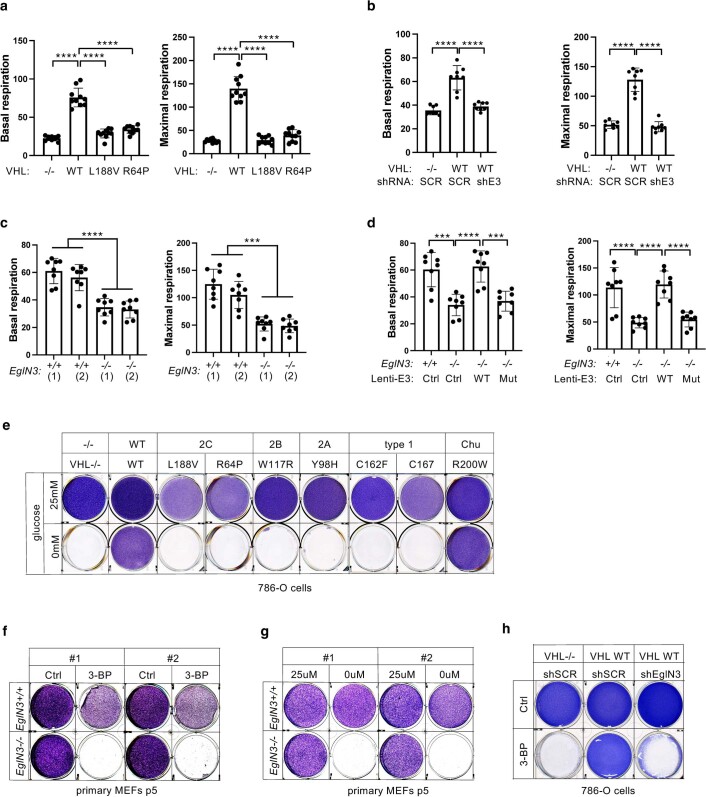
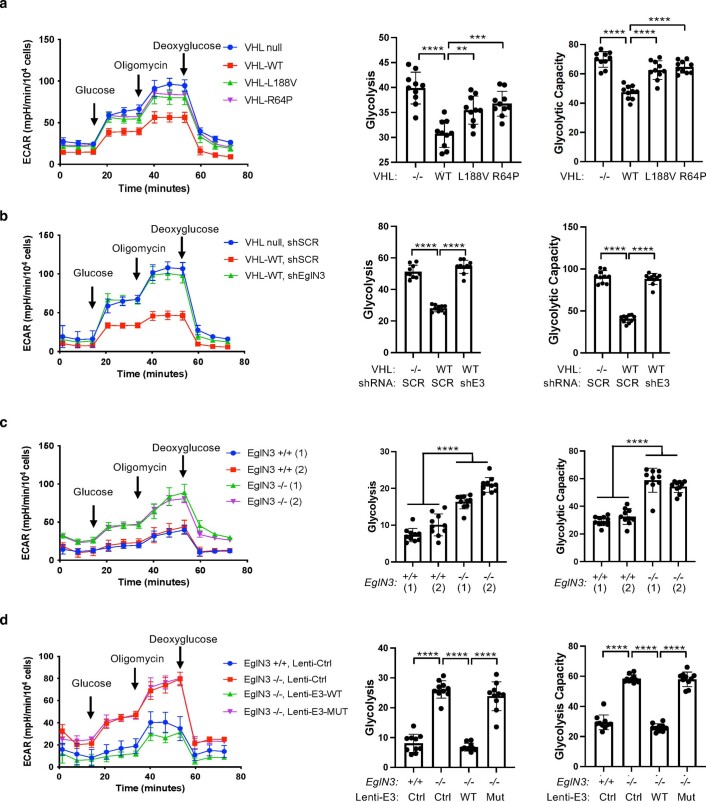
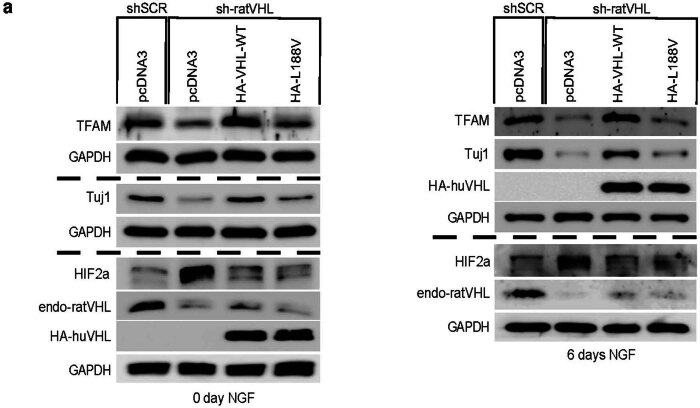
Mitochondria are the main consumers of oxygen within the cell. How mitochondria sense oxygen levels remains unknown. Here we show an oxygen-sensitive regulation of TFAM, an activator of mitochondrial transcription and replication, whose alteration is linked to tumours arising in the von Hippel-Lindau syndrome. TFAM is hydroxylated by EGLN3 and subsequently bound by the von Hippel-Lindau tumour-suppressor protein, which stabilizes TFAM by preventing mitochondrial proteolysis. Cells lacking wild-type VHL or in which EGLN3 is inactivated have reduced mitochondrial mass. Tumorigenic VHL variants leading to different clinical manifestations fail to bind hydroxylated TFAM. In contrast, cells harbouring the Chuvash polycythaemia VHLR200W mutation, involved in hypoxia-sensing disorders without tumour development, are capable of binding hydroxylated TFAM. Accordingly, VHL-related tumours, such as pheochromocytoma and renal cell carcinoma cells, display low mitochondrial content, suggesting that impaired mitochondrial biogenesis is linked to VHL tumorigenesis. Finally, inhibiting proteolysis by targeting LONP1 increases mitochondrial content in VHL-deficient cells and sensitizes therapy-resistant tumours to sorafenib treatment. Our results offer pharmacological avenues to sensitize therapy-resistant VHL tumours by focusing on the mitochondria.


Conflict of interest statement

All authors declare no competing interests.

Figures

Fig. 1
Fig. 1. pVHL regulates of mitochondrial mass independent of HIFα.
a, Volcano plot of proteins detected by nanoLC–MS/MS in human PPGL tumours (VHL-mutant/wild type). The dotted line indicates a P value of 0.05 (−log10 P value = 1.3) in two-tailed unpaired t-test. b, Histogram of mitochondrial proteins regulated in human VHL-mutant compared to VHL wild-type PPGL tumours. c, Heat map of the top 50 downregulated and upregulated proteins in human VHL-related PPGL tumours (VHL-mutant/wild type). Red asterisks indicate mitochondrial proteins. d, Top 5 biological processes of the top 50 upregulated (red) and downregulated (green) proteins for human VHL PPGL tumours. e, Immunoblot of 786-O cells expressing pVHL WT or type 2C pVHL mutants (p.Leu188Val or p.Arg64Pro). n = 3 biological independent experiments. f, The corresponding immunofluorescence images are shown. Cells were stained by MitoTracker Red (top). Flow cytometry analysis of MitoTracker Green-stained cells (bottom). Data are presented as mean values ± s.d. One-way analysis of variance (ANOVA) Tukey’s multiple-comparison test. ****P < 0.0001. n = 3 biological independent experiments. g, The volcano plot shows proteins detected by nanoLC–MS/MS in human ccRCC cells (786-O). VHL-null cells (pRC3) were compared to VHL-WT-expressing cells. The dotted line indicates a P value of 0.05 (−log10 P value = 1.3) in a two-tailed unpaired t-test. The histogram shows fold changes of mitochondrial proteins comparing pRC3 to VHL-WT with indicated median value of log2(fold change) −0.27. h, The volcano plot shows proteins detected by nanoLC–MS/MS in 786-O cells. VHL-L188V mutant cells were compared to VHL-WT-expressing cells as in g. The histogram shows fold changes of mitochondrial proteins comparing VHL-L188V to VHL-WT with indicated median value of log2(fold change) of −0.22. i, Immunoblot of 786-O cells stably transfected to produce the indicated pVHL species. j, Immunoblot of VHL MEFs with indicated genotype. In i and j, n = 3 biological independent experiments. k, Corresponding immunofluorescence of VHL MEFs. Cells were stained by MitoTracker Red to visualize mitochondria (top). Flow cytometry analysis of MitoTracker Green-stained MEFs (bottom). n = 3 biological independent experiments. Data are presented as mean values ± s.d. One-way ANOVA Tukey’s multiple-comparison test. ****P < 0.0001. Source data
Fig. 2
Fig. 2. pVHL regulation of mitochondrial mass is hydroxylation and EGLN3 dependent.
a, Immunoblot analysis of 786-O cells with indicated genotype upon anoxic condition for 16 h or treated with 1 mM DMOG for 8 h. n = 3 biological independent experiments. b, Immunoblot analysis of 786-O cells with indicated VHL status transduced with lentiviral pL.KO shRNA targeting EGLN1 (shE1), EGLN2 (shE2), EGLN3 (shE3) or no targeting control (shSCR). n = 3 biological independent experiments. c, Fluorescence images of 786-O cells with indicated VHL status transduced with lentiviral pL.KO shRNA targeting EGLN3 or no targeting control. Mitochondria are visualized by MitoTracker Red staining. d, Corresponding flow cytometry analysis of MitoTracker Green-stained 786-O cells. Data are presented as mean values ± s.d. One-way ANOVA Tukey’s multiple-comparison Test. ****P < 0.0001. n = 3 biological independent experiments. e, Immunoblot analysis of mouse SCG and adrenal medulla of indicated genotypes. n = 4 biologically independent EGLN3 wild-type or knockout mice. f, Immunoblot analysis of mouse heart of the indicated genotypes. n = 3 biologically independent EGLN3 wild-type or knockout mice. g, Fluorescence images of primary EGLN3 MEFs of the indicated genotypes stably transduced with lentivirus encoding EGLN3 WT, catalytic death mutant EGLN3-H196A or empty control. Mitochondria were visualized by MitoTracker Red staining. Corresponding flow cytometry analysis of MitoTracker Green-stained primary MEFs cells of indicated genotype stably transduced with lentivirus encoding EGLN3 WT, catalytic death mutant EGLN3-H196A or empty control. n = 3 biological independent experiments. Data are presented as mean values ± s.d. One-way ANOVA Tukey’s multiple-comparison test. ****P < 0.0001. h, Corresponding immunoblot of primary EGLN3 MEFs. n = 3 biological independent experiments. i, KO mice aged 56–60 weeks reached exhaustion significantly earlier and performed less work at a comparable performed power (WT n = 16, KO n = 15 independent biological samples per genotype, male mice). Data are presented as mean values ± s.d. Two-tailed unpaired t-test. P = 0.014, P = 0.0318. Source data
Fig. 3
Fig. 3. pVHL regulates TFAM protein stability depending on EGLN3 enzymatic activity.
a, Immunoblot of 786-O cells stably transfected to produce the indicated pVHL species. b, Immunoblot analysis of mitochondrial and cytosolic fractions of 786-O stable cells. c, Immunoblot analysis of subcellular fractionation of 786-O pVHL WT cells. Mitochondrial fractions were treated with 25 μg ml−1 proteinase K with or without 1% Triton X-100. In ac, n = 3 biological independent experiments. d, Representative confocal images of in situ PLA between TFAM and pVHL in 786-O cells with indicated VHL status. PLA signal is shown in green, DAPI in blue and MitoTracker in red. Orthogonal views of three cells identified in pVHL-expressing cells are presented and demonstrate colocalization of PLA signal in mitochondria (yellow). Magnification ×63; scale bar, 5 µm. e, Quantification of the number of PLA signals per cell in both conditions with indicated VHL status; Mann–Whitney U test; ***P value < 0.001 (n > 200 cells per group examined). Similar results were seen more than three times. The term five-number summary is used to describe a list of five values: the minimum, the 25th percentile, the median, the 75th percentile and the maximum. These are the same values plotted in a box-and-whisker plot when the whiskers extend to the minimum and maximum. f, Immunoblots of HA-VHL immunoprecipitation from 786-O cells transduced with lentivirus encoding shRNA targeting EGLN1, EGLN2, EGLN3 or scramble control (SCR). g, HA-VHL immunoprecipitation from 786-O cells with stable expression of either HA-VHL-WT or HA-VHL-L188V. Immunoblots showing co-immunoprecipitation of endogenous TFAM and HA-VHL. h, 786-O VHL-null cells or stable HA-VHL-WT-expressing cells were treated with 10 μg ml−1 cycloheximide (CHX). At the indicated time points, whole-cell lysates were prepared for immunoblot analysis. Corresponding quantification of the band intensities is shown on the right. i, EGLN3 MEFs with indicated genotype were treated with CHX (10 μg ml−1) and whole-cell lysates were prepared for immunoblot analysis at the indicated time points. Corresponding quantification of the band intensities is shown on the right. In fi, n = 3 biological independent experiments. Source data
Fig. 4
Fig. 4. TFAM is hydroxylated by EGLN3 at proline 53/66 causing pVHL recognition.
a, Autoradiograms showing recovery of 35S-labelled VHL protein bound to HA-immunoprecipitated (IP) full-length TFAM that was first subjected before to hydroxylation by EGLN3 WT or EGLN3-H196A catalytic mutant. b, Immunoprecipitation using anti-hydroxyproline antibody (HydroxyP) from 293FT cells that were transiently transfected with plasmids encoding Flag-TFAM and Flag-EGLN3 WT or catalytically dead mutant (H196A) with or without DMOG treatment. Immunoblots show co-immunoprecipitation of Flag-TFAM and Flag-EGLN3. In a and b, n = 3 biological independent experiments. c, Schematic of the hydroxylation assay using the biotinylated synthetic TFAM peptide 31–70. d, Autoradiograms showing recovery of 35S-labelled VHL protein bound to biotinylated TFAM peptide 31–70. Before pulldown, peptides were incubated with EGLN1, EGLN2, EGLN3 or EGLN3 catalytic mutant (Mut) generated by IVT or unprogrammed reticulocyte lysate (−). Expression of IVT-produced EglN proteins in each reaction was verified by immunoblot. n = 3 biological independent experiments. e,f, Mass spectrometry of biotinylated TFAM peptide 31–70 was subjected to EGLN3 hydroxylation assay. Representative fragmentation spectra of hydroxylated Biotin-KP(ox)VSSYLR (e) and hydroxylated Biotin-EQLP(ox)IFKA (f). g, Autoradiograms of EGLN3 hydroxylation and 35S-VHL capture as shown in using biotinylated TFAM peptides containing proline-to-alanine substitutions, or no substitution (WT). h, Autoradiograms showing recovery of 35S-labelled VHL protein (WT) or corresponding disease mutants (as indicated) bound to biotinylated TFAM peptides synthesized with double hydroxyl-prolines on prolines 53 and 66 (TFAM-P-OH-53/66). Synthetic biotinylated HIF1α peptide (residues 556 to 575) with hydroxylated proline 564 (HIF1α-P-OH) was included as a control. Biotinylated TFAM naïve peptide was used as negative controls. i, Autoradiograms showing recovery of 35S-labelled VHL protein (WT) or corresponding disease mutants (as indicated) bound to biotinylated TFAM peptides synthesized with double hydroxyl-prolines on prolines 53 and 66 (TFAM-P-OH-53/66). Synthetic biotinylated HIF2α peptide (residues 521 to 543) with hydroxylated proline 531 (HIF2α-P-OH) was included as a control. Biotinylated TFAM and HIF2α naïve peptides were used as negative controls. j, Peptide pulldown using biotinylated TFAM-P-OH-53/66 peptide incubated with whole-cell lysates from 786-O cells expressing either HA-VHL-WT or HA-VHL disease mutant. Biotinylated TFAM and HIF2α naïve peptides were used as negative controls. In gj, n = 3 biological independent experiments. Source data
Fig. 5
Fig. 5. pVHL protects TFAM from LONP1 degradation.
a,b, Immunoblot analysis of primary Egln3+/+ and Egln3−/− MEFs (a) and 786-O cells (b) treated with 1 μM LONP1 inhibitor bortezomib (BTZ) for 16 h. c, Immunoblot analysis of HEK293 cells transfected with transposon vectors pB-TRE-TFAM-WT-Luc2, pB-TRE-TFAM-mut-Luc2 and transposase vector pCAG-hyPBase. d, Immunoblot analysis of PKA activity assay using biotinylated TFAM peptides with double hydroxyl-prolines 53 and 66. e,f, Immunoblot analysis of 786-O cells treated with 20 μM PKA activator forskolin (24 h) (e) or 5 μM PKA inhibitor H89 (24 h) (f). g, Immunoblot analysis of TFAM degradation assay by LONP1 using purified His-TFAM, GST-VHL, LONP1 and IVT-synthesized Flag-EGLN3 WT or Flag-EGLN3 catalytic mutant. In ag, n = 3 biological independent experiments. h,i, Kaplan–Meier overall survival curve for individuals with high (blue) and low (red) expression of PKA catalytic subunit (PRKACA) (h) and LONP1 (i) using the Kidney Renal Clear Cell Carcinoma dataset from The Cancer Genome Atlas which contains 533 tumour samples (https://hgserver1.amc.nl/cgi-bin/r2/main.cgi; minimal patient group size of 50 in the iterations). The overall survival probability was estimated with the KaplanScanner tool, using a Bonferroni-corrected logrank test between the two groups of patients. The graph depicts the best P value corrected for multiple testing (Bonferroni method). j, Crystal violet staining of 786-O cells pretreated with BTZ (10 nM) for 24 h and then treated for 48 h with sorafenib (Sora; 20 μM), BTZ (10 nM) or a combination (combo) of these two drugs as indicated. k, Cell apoptosis rate was detected by Annexin V-FITC/propidium iodide (PI) staining using flow cytometry. Data are presented as mean values ± s.d. Two-way ANOVA Tukey’s multiple-comparison test. ****P < 0.0001. n = 3 biological independent experiments. l, Female athymic NCrnu/nu mice were implanted subcutaneously with 786-O cells. Sorafenib (n = 4) or vehicle control (DMSO, n = 5) was administered orally, once a day at the dose of 15 mg per kg body weight. BTZ (n = 5) was administered by intraperitoneal injection, twice per week at a dose of 1 mg per kg body weight. Combined treatment: 1 mg per kg body weight BTZ + 15 mg per kg body weight sorafenib (n = 5). Mean (±s.e.m.) tumour volume data are shown. *P < 0.01, **P < 0.01, ***P < 0.001. m, Representative images of tumours after dissection and quantification of tumour weight of each treatment group. n, Representative H&E (scale bar indicates 50 µm, ×100), TFAM and MTCO2 immunofluorescence stainings (scale bar indicates 50 µm, ×400) of tumour tissues including quantification. NS, not significant. Source data
Fig. 6
Fig. 6. pVHL restores cellular oxygen consumption rate.
a, Mitochondrial respiration reflected by OCR of 786-O cells with the indicated genotypes was monitored using the Seahorse XF-96 Extracellular Flux Analyzer with the sequential injection of oligomycin (1 μM), FCCP (1 μM) and rotenone/antimycin (0.5 μM). bd, OCR measurement in 786-O cells with indicated VHL status transduced with lentiviral pL.KO shRNA targeting EGLN3 or no targeting control (b), primary EGLN3+/+ and EGLN3−/− MEFs (c) stably transduced with lentivirus encoding EglN3 WT, catalytic death mutant or empty control (d). In ad, data are presented as mean values ± s.d. n = 3 biological independent experiments. e, Crystal violet staining of 786-O cells with the indicated VHL status treated with high glucose (25 mM) or no glucose (0 mM) for 36 h. Corresponding ADP/ATP ratio is shown in h. f, Crystal violet staining of 786-O cells with the indicated VHL status treated with 100 μM 3-BP for 4 h. Corresponding ADP/ATP ratio is shown in i. g, Crystal violet staining of 786-O cells with the indicated VHL status treated with 25 μM gossypol for 36 h. Corresponding ADP/ATP ratio is shown in j. In hj, data are presented as mean values ± s.d. One-way ANOVA Tukey’s multiple-comparison test. *P < 0.05, ****P < 0.0001. n = 3 biological independent experiments. k, Crystal violet staining of 786-O cells with the indicated VHL status treated with 5 μM PKA inhibitor H89 for 24 h, before glucose deprivation for 36 h. Corresponding ADP/ATP ratio is shown in n. l, Crystal violet staining of 786-O cells treated with 5 μM PKA inhibitor H89 for 24 h, before 100 μM 3-BP treatment for 4 h. Corresponding ADP/ATP ratio is shown in o. m, Crystal violet staining of 786-O cells treated with 5 μM PKA inhibitor H89 for 24 h, before 25 μM gossypol for 36 h. Corresponding ADP/ATP ratio is shown in p. In np, data are presented as mean values ± s.d. One-way ANOVA Tukey’s multiple-comparison test. *P < 0.05, ****P < 0.0001. n = 3 biological independent experiments. Source data
Fig. 7
Fig. 7. Low mitochondrial content in pheochromocytoma cells causes impaired differentiation.
a, Fluorescence images of PC12 cells treated with 50 ng ml−1 NGF at the indicated time points. Cells were stained by MitoTracker Red to visualize mitochondria and endogenous Tuj1 (neuron-specific class III beta-tubulin) was stained in green. b, Corresponding immunoblot analysis. n = 3 biological independent experiments. c, Fluorescence images of stable polyclonal PC12 cells expressing the indicated human VHL (huVHL) species selected with G418 (0.5 mg ml−1) for 2 weeks. PC12 clones were transduced for 48 h with lentivirus encoding shRNA targeting endogenous rat VHL (sh-ratVHL) or scramble control (shSCR) and subsequently treated with NGF for 6 d. Cells were stained by MitoTracker Red to visualize mitochondria and endogenous Tuj1 was stained in green. d, Fluorescence images of polyclonal PC12 cells transduced for 48 h with lentivirus encoding shRNA targeting endogenous rat TFAM (sh-TFAM) or scramble control (shSCR) and subsequently treated with NGF for 6 d. Cells were stained by MitoTracker Red to visualize mitochondria and endogenous Tuj1 in green. e, Corresponding immunoblot analysis. n = 3 biological independent experiments. In a, c and d, similar results were observed more than three times. Source data
Fig. 8
Fig. 8. Schematic of oxygen-dependent regulation of mitochondrial content within the von Hippel–Lindau syndrome.
a, Genotype–phenotype correlation in cancers arising in the VHL syndrome and its association with regulation of HIFα and mitochondrial content. Note that the Cuvash polycythaemia mutation VHLR200W shows total absence of tumour development despite increased HIFα signalling and appears normal with regard to regulating mitochondrial content. b, Schematic of oxygen-dependent regulation of mitochondrial transcription factor TFAM by pVHL, independent of the canonical substrate HIFα. mtDNA, mitochondrial DNA.
Extended Data Fig. 1
Extended Data Fig. 1. VHL regulates of mitochondrial mass independent of HIFa.
(a) List human primary PPGL tumors with characterized mutation status and 1p36 status that were analyzed by by nanoLC-MS/MS in Fig. 1A-D. wt = wild-type. (b) Heatmap of significantly regulated mitochondrial proteins in VHL-mutant compared to VHL wild-type PPGL tumors (p < 0.05, two-tailed unpaired t test). (c) Top 5 cellular component of top 50 up (red)- and down (green)-regulated proteins for human VHL mutant PCC/PGL tumors compared to VHL wild type PCC/PGL tumors according to the false discovery rate (FDR). Medium confidence threshold (0.4) was used to define protein-protein interactions. (d) Immunoblot analysis of A498 VHL-null cells (−/−) stably transfected to generate HA-VHL (WT). n = 3 biological independent experiments. (e) Immunoblot analysis of 786-O cells with indicated genotype stably transduced with lentivirus encoding sgRNA targeting HIF2α. n = 3 biological independent experiments. (f) Venn diagram representing significantly downregulated proteins shared in VHL-null 786-O cells with type 2 C VHL-L188V mutant cells and (g) shared with VHL mutant PPGL. (h, i) GO term enrichment in cellular component of 393 significantly down-regulated proteins (p values < 0.0001, two-tailed unpaired t test) comparing VHL-null to VHL-WT cells (h) and 200 significantly down-regulated proteins (p values < 0.0001, two-tailed unpaired t test) comparing VHL-L188V to VHL-WT cells (i) performed using DAVID and plotted using REVIGO. The size of the bubbles is indicative of the number of proteins annotated with that GO term; bubbles are color coded according to significance. Source data
Extended Data Fig. 2
Extended Data Fig. 2. VHL regulation of mitochondrial mass is hydroxylation and EglN3 dependent.
(a) Immunoblot analysis of 786-O cells with indicated VHL status transduced with lentiviral pL.KO shRNA targeting EGLN3 (shE3) or no targeting control (SCR). n = 3 biological independent experiments. (b) Immunoblot analysis of HeLa cells transduced with lentiviral pL.KO shRNA targeting EGLN1, EGLN2, EGLN3 or no targeting control. n = 3 biological independent experiments. (c) Immunoblot analysis of mouse cerebellum of indicated genotype. n = 4 biologically independent EGLN3 wildtype or knockout mice. (d) Immunoblot analysis of mouse skeletal muscles of indicated genotype. n = 3 biologically independent EGLN3 wildtype or knockout mice. (e) Immunoblot of primary EglN3-MEFs of indicated genotype with different passages. n = 3 biological independent experiments. (f) Immunoblot analysis of primary EGLN3-MEFs of indicated genotype. n = 3 biological independent experiments. (g) Left: Fluorescence images of primary EGLN3-MEFs of indicated genotype. Mitochondria were stained by MitoTracker Red. Right: Flow cytometry analysis of MitoTracker Green-stained primary MEFs of indicated genotype. Data are presented as mean values ± S.D. Two-tailed unpaired t test. ****p < 0.0001. n = 3 biological independent experiments. (h) Immunoblot of EGLN3 primary MEFs with indicated genotype upon normoxic or anoxic conditions for 16 h or treated with 1 mM DMOG or 50 μM FG0041 for 8 h. n = 3 biological independent experiments. (i) In contrast young adult, KO mice (18-19 weeks of age) show a comparable exhaustion time, performed work and performed power (n = 16 per genotype, male mice). Data represent means ± SD and individual measurements. Source data
Extended Data Fig. 3
Extended Data Fig. 3. VHL interacts with TFAM within mitochondria.
(a) Immunoblot analysis of subcellular fractionation of SK-N-F1 cells. Cell lysates were fractionated into cytosolic and mitochondrial fractions. In addition, aliquots of the mitochondrial fractions were treated with 25 μg/ml Proteinase K with or without treatment with 1% Triton X-100. Fractions were analyzed by western blotting and the localization of VHL or EglN3 was assessed in comparison to that of protein markers of the cytosol (tubulin), outer mitochondrial membrane (TOM20), and mitochondrial matrix (mitochondrial ribosomal protein MRPL37). n = 3 biological independent experiments. (b) Representative images of proximity ligation assay (PLA) signal (green), DAPI (blue) and MitoTracker Red (red) triple staining in 786-0 cells expressing VHL wildtype. The images show the maximal intensity projection of the signal/staining. (c) 3D rendering and (d) Orthogonal view showing co-localization of PLA signal in mitochondria (yellow). Magnification 63x; scale bar: 5 µm. (b-d) Similar results were seen more than three times. Source data
Extended Data Fig. 4
Extended Data Fig. 4. TFAM is hydroxylated by EglN3 at Proline 53/66 causing pVHL recognition.
(a) Immunoprecipitation using antihydroxyproline antibody (HydroxyP) from 293FT cells that were transiently transfected with plasmids encoding Flag-TFAM and HA-EGLN1, HA-EGLN2 and HA-EGLN3. Immunoblots show co-immunoprecipitation of Flag-TFAM. n = 3 biological independent experiments. (b-c) Mass spectrometry of unmodified biotinylated TFAM-peptide-30-70. Shown is the representative fragmentation peptide spectra of non-hydroxylated Biotin-KPVSSYLR (b) and non-hydroxylated Biotin-EQLPIFKA (c). (d,e) Extracted ion chromatogram of biotinylated unmodified and mono hydroxylated proline residues 53 (d) or proline residues 66 (e) TFAM peptide following an in vitro hydroxylation reaction with EglN3 with indicated concentration of α-ketoglutarate (KG). Control indicates unmodified biotinylated TFAM-peptide that was not subjected to EGLN3 hydroxylation. (f) Hydroxylation levels of proline residues 53 and 66 of TFAM peptide following hydroxylation with EGLN3 generated via IVT with indicated concentration of KG. Data are presented as mean values ± SD. n = 3 biological experiments. One way ANOVA Tukey’s Multiple Comparison Test. *p < 0.05,**p < 0.01. p = 0.0288, p = 0.0143, p = 0.0148, p = 0.0082. (g) Schematic illustration of synthetic biotinylated TFAM peptide hydroxylated at P-OH-53 and P-OH-66 and naïve TFAM peptide. (h) Autoradiograms showing recovery of 35S-labeled VHL protein (WT) or corresponding disease mutants (as indicated) bound to biotinylated HIF1α peptide (residues 556 to 575) with hydroxylated proline 564 (HIF1α-P-OH) and HIF2α peptide (residues 521 to 543) with hydroxylated proline 531 (HIF2α-P-OH). Biotinylated HIF1α and HIF2α naïve peptides were used as negative controls. n = 3 biological independent experiments. (i) Peptide pulldown using biotinylated TFAM-P-OH-53/66 peptide incubated with whole-cell lysates from A498 cells expressing HA-VHL WT or empty control. Biotinylated TFAM naïve peptide was used as negative control. n = 3 biological independent experiments. Source data
Extended Data Fig. 5
Extended Data Fig. 5. VHL restores cellular oxygen consumption rate.
(a) Seahorse XF-96 analysis of oxygen consumption rate (OCR). Mitochondrial respiration reflected by OCR levels was detected in 786-O cells with indicated genotype. The rates of basal respiration and maximal respiratory capacity were respectively quantified by normalization of amount of cells. One way ANOVA Tukey’s Multiple Comparison Test. ****p < 0.0001. (b) Seahorse XF-96 analysis of oxygen consumption rate (OCR) of 786-O cells with indicated VHL status transduced with lentiviral pL.KO shRNA targeting EGLN3 or no targeting control. The rates of basal respiration and maximal respiratory capacity were respectively quantified as described above. One way ANOVA Tukey’s Multiple Comparison Test. ****p < 0.0001. (c) Seahorse XF-96 analysis of oxygen consumption rate (OCR) of primary EGLN3 + / + and EGLN3-/- MEFs. The rates of basal respiration and maximal respiratory capacity were respectively quantified by normalization of amount of cells. One way ANOVA Tukey’s Multiple Comparison Test. ***p < 0.001, ****p < 0.0001. (d) Seahorse XF-96 analysis of oxygen consumption rate (OCR) of primary EGLN3-MEFs of indicated genotype stably transduced with lentivirus encoding EGLN3 WT, catalytic death mutant or empty control. The rates of basal respiration and maximal respiratory capacity were respectively quantified as described above. ***p < 0.001, ****p < 0.0001. a-d, data are presented as mean values ± SD. n = 3 biological independent experiments. (e) Crystal violet staining of 786-O cells with indicated VHL status treated with high glucose (25 mM) or no glucose respectively for 36 hours. (f) Crystal violet staining of primary EGLN3 + / + and EGLN3-/- MEFs treated with 100 μM 3-bromopyruvic acid (3-BP) for 4 hours. (g) Crystal violet staining of primary EGLN3 + / + and EGLN3-/- MEFs treated with high glucose (25 μM) or no glucose (0 μM) respectively for 48 hours. (h) Crystal violet staining of 786-O cells with indicated VHL status transduced with lentiviral pL.KO shRNA targeting EGLN3 or no targeting control, treated with 100 μM 3-bromopyruvic acid (3-BP) for 4 hours. Source data
Extended Data Fig. 6
Extended Data Fig. 6. VHL decreases glycolysis.
(a) Extracellular acidification rate (ECAR) of 786-O cells with indicated genotype was monitored using the Seahorse XF-96 Extracellular Flux Analyzer with the sequential injection of glucose (10 mM), oligomycin (1 μM) and 2-deoxy-glucose (2-DG) (50 μM). The rates of glycolysis and glycolysis capacity were respectively quantified by normalization of amount of cells. One way ANOVA Tukey’s Multiple Comparison Test. **p = 0.003, ***p = 0.0002, ****p < 0.0001. (b) Extracellular acidification rate (ECAR) of 786-O cells with indicated VHL status transduced with lentiviral pL.KO shRNA targeting EGLN3 or no targeting control was measured as described above. The rates of glycolysis and glycolysis capacity were respectively quantified by normalization of amount of cells. One way ANOVA Tukey’s Multiple Comparison Test. ****p < 0.0001. (c) Extracellular acidification rate (ECAR) of primary EGLN3 + / + and EGLN3-/- MEFs. The rates of glycolysis and glycolysis capacity were respectively quantified by normalization of amount of cells. One way ANOVA Tukey’s Multiple Comparison Test. ****p < 0.0001. (d) Extracellular acidification rate (ECAR) of primary EGLN3-MEFs of indicated genotype stably transduced with lentivirus encoding EGLN3 WT, catalytic death mutant or empty control was monitored as described above. The rates of glycolysis and glycolysis capacity were respectively quantified by normalization of amount of cells. One way ANOVA Tukey’s Multiple Comparison Test. ****p < 0.0001. a-d, data are presented as mean values ± SD. n = 3 biological independent experiments. Source data
Extended Data Fig. 7
Extended Data Fig. 7. Low mitochondrial content in pheochromocytoma cells causes impaired differentiation.
(a) Immunoblot analysis of stable polyclonal PC12 cells expressing the indicated human VHL (huVHL) species. Stable polyclonal PC12 cells were transduced for 48 h with lentivirus encoding shRNA targeting endogenous rat VHL (endg. sh-ratVHL) or scramble control (shSCR) and subsequently treated with NGF for 6 days. n = 3 biological independent experiments. Source data

References

    1. Maxwell, P. H. et al. The tumour suppressor protein VHL targets hypoxia-inducible factors for oxygen-dependent proteolysis. Nature399, 271–275 (1999). - PubMed
    1. Kaelin, W. G. Jr. The von Hippel–Lindau tumour suppressor protein: O2 sensing and cancer. Nat. Rev. Cancer8, 865–873 (2008). - PubMed
    1. Kaelin, W. G. Jr. & Ratcliffe, P. J. Oxygen sensing by metazoans: the central role of the HIF hydroxylase pathway. Mol. Cell30, 393–402 (2008). - PubMed
    1. Zhang, H. et al. HIF-1 inhibits mitochondrial biogenesis and cellular respiration in VHL-deficient renal cell carcinoma by repression of C-MYC activity. Cancer Cell11, 407–420 (2007). - PubMed
    1. Kaelin, W. G. Jr. The von Hippel–Lindau tumour suppressor protein: O2 sensing and cancer. Nat. Rev.8, 865–873 (2008). - PubMed

Publication types