. 2022 Jun;4(6):775-790.
doi: 10.1038/s42255-022-00590-0. Epub 2022 Jun 27.

Brown adipose tissue-derived MaR2 contributes to cold-induced resolution of inflammation

Affiliations

Brown adipose tissue-derived MaR2 contributes to cold-induced resolution of inflammation

Satoru Sugimoto et al. Nat Metab. 2022 Jun.

Abstract

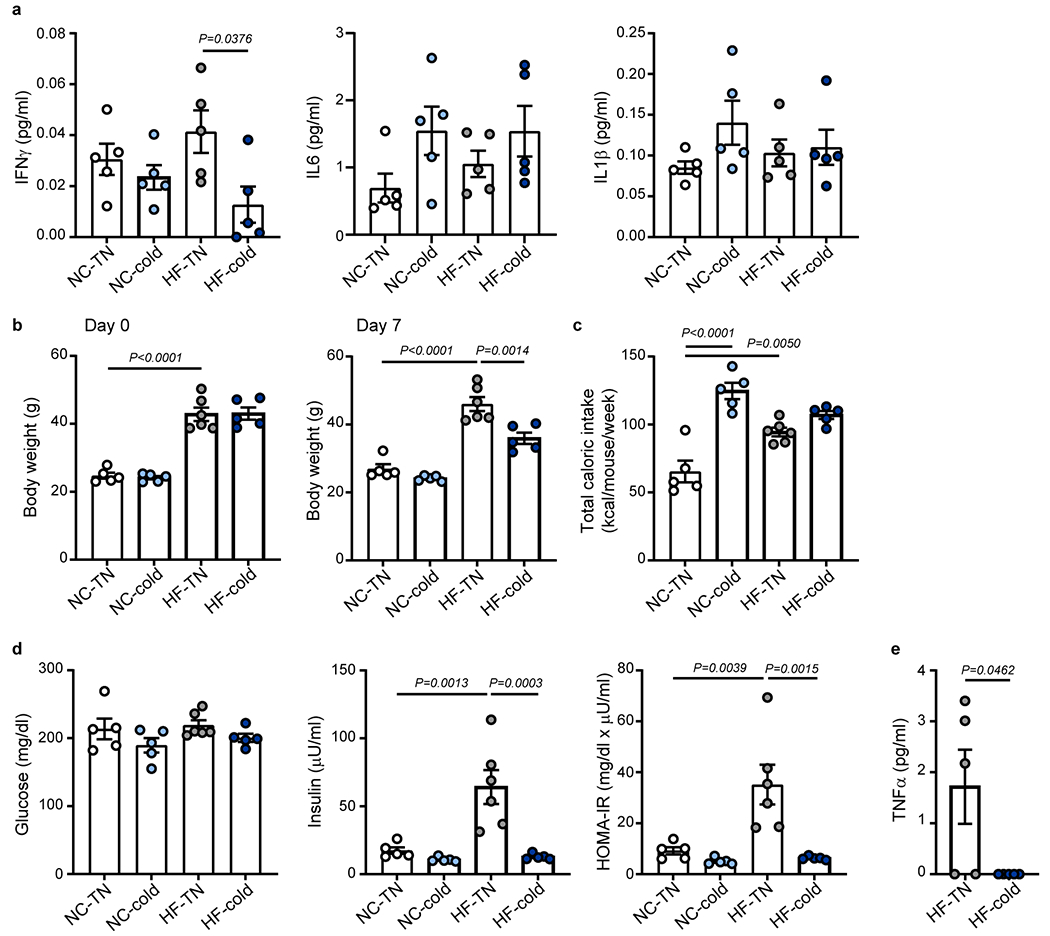
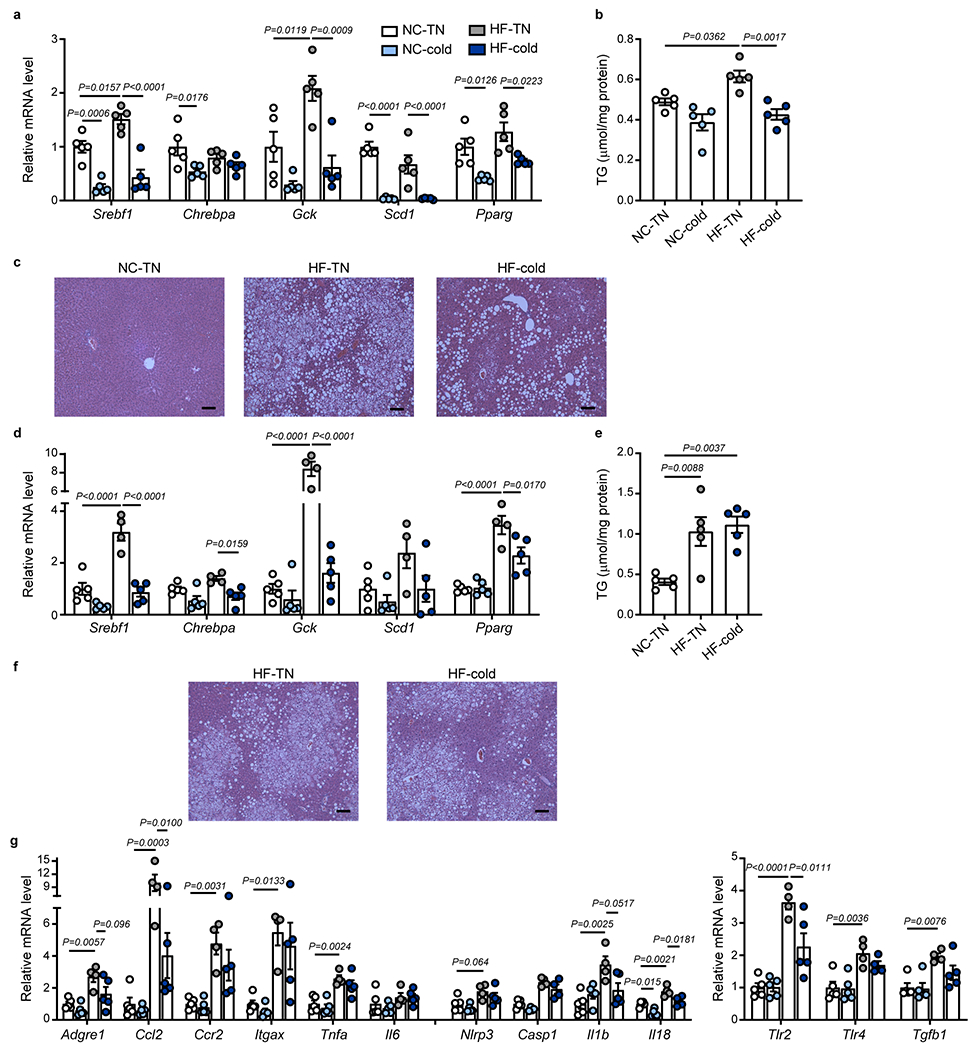
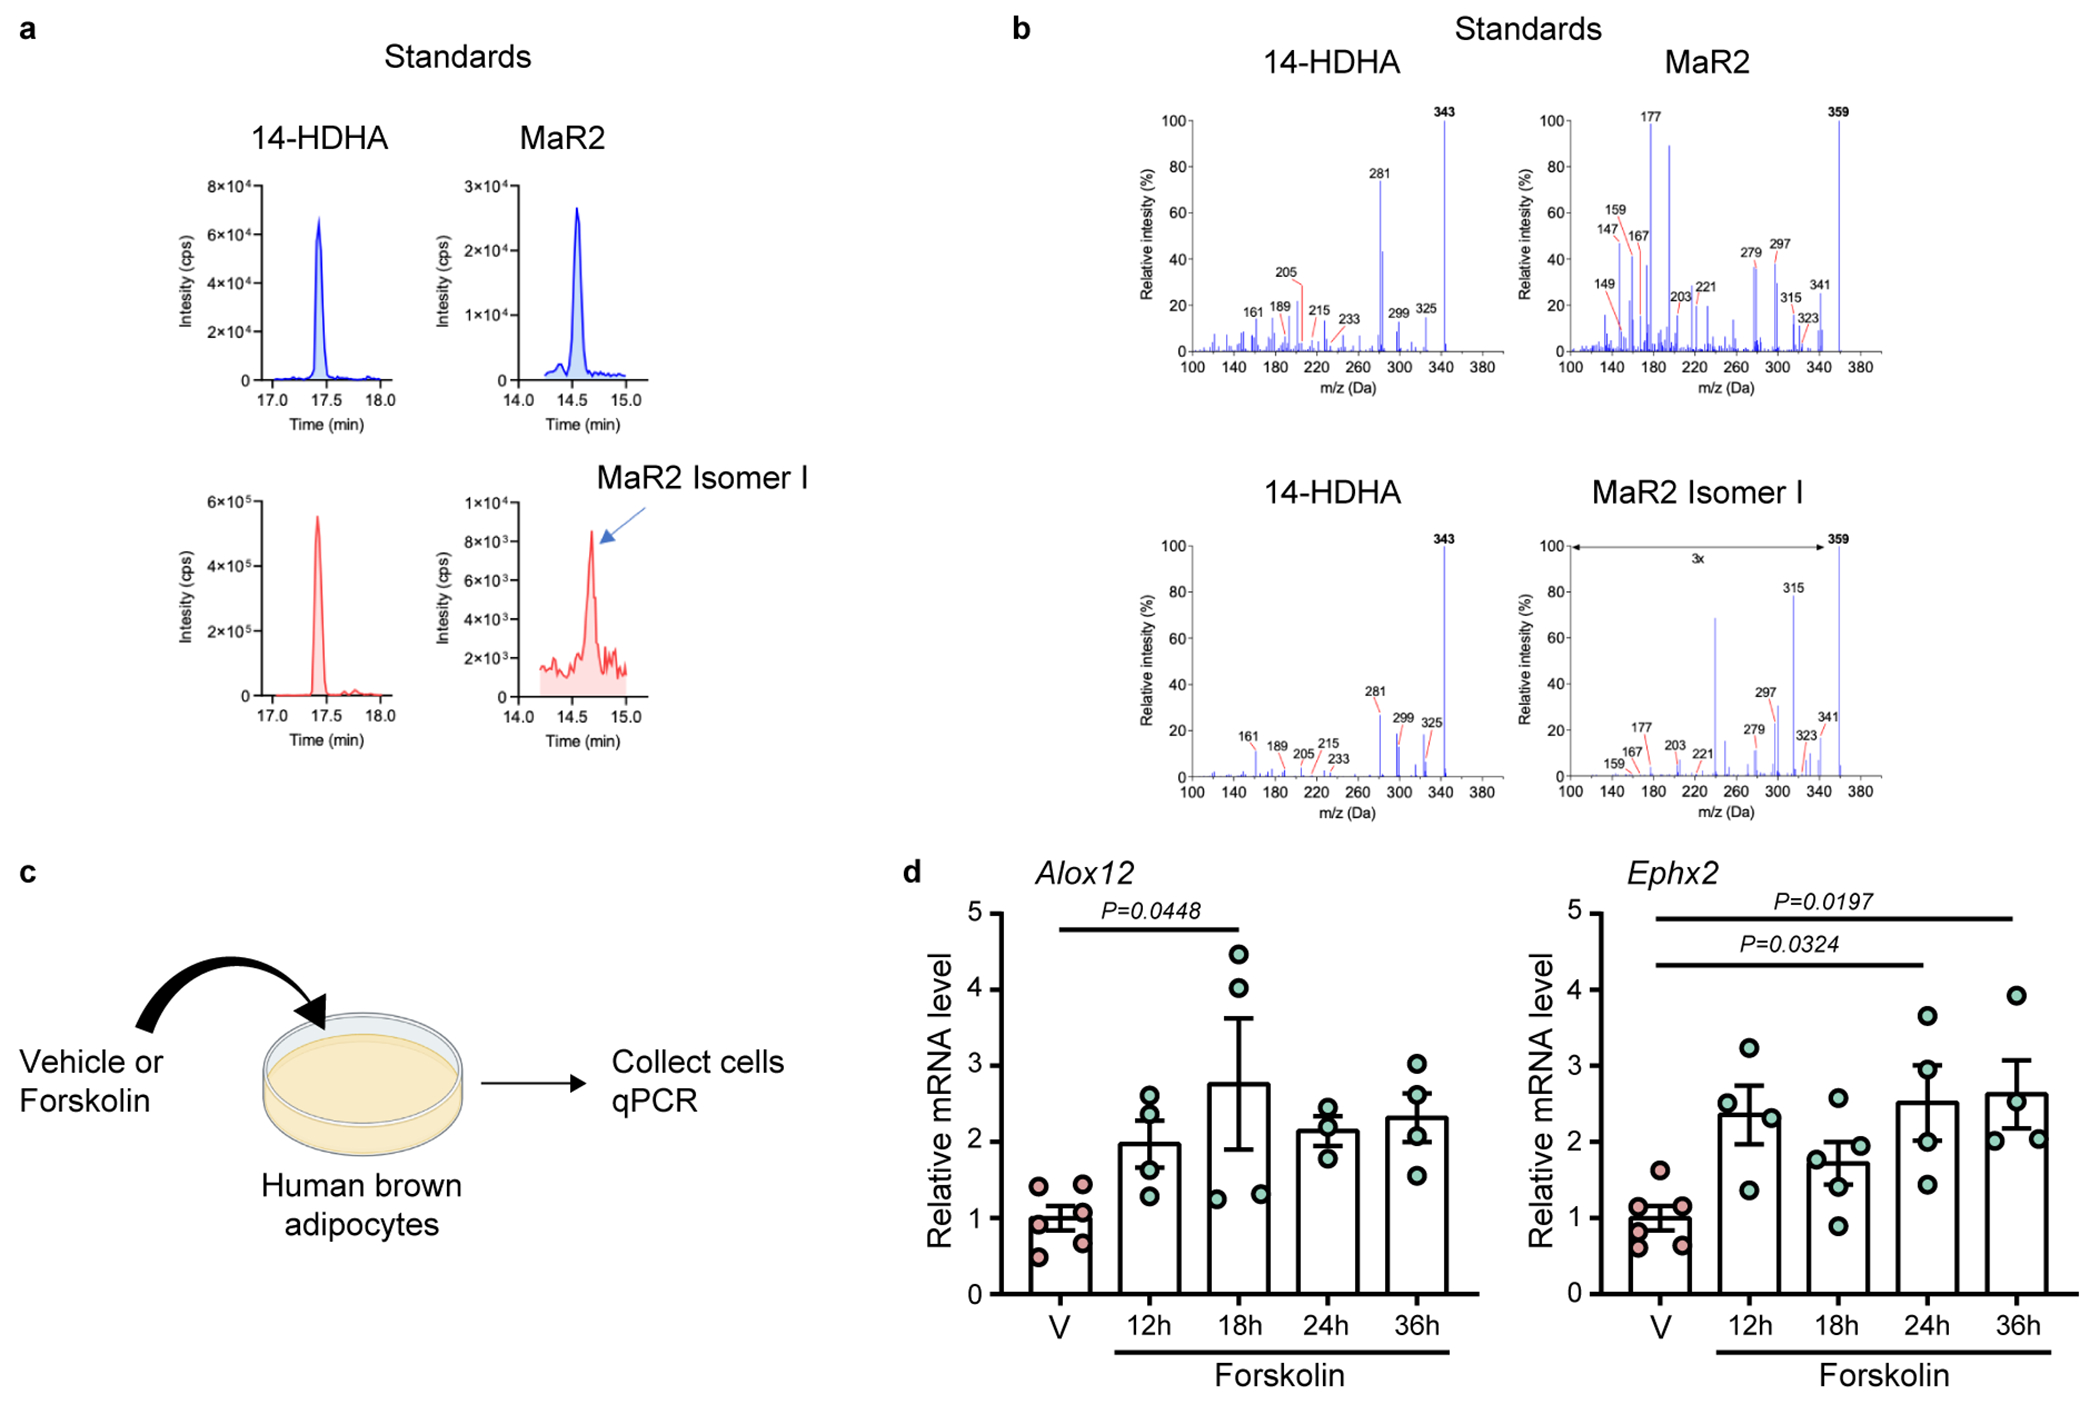
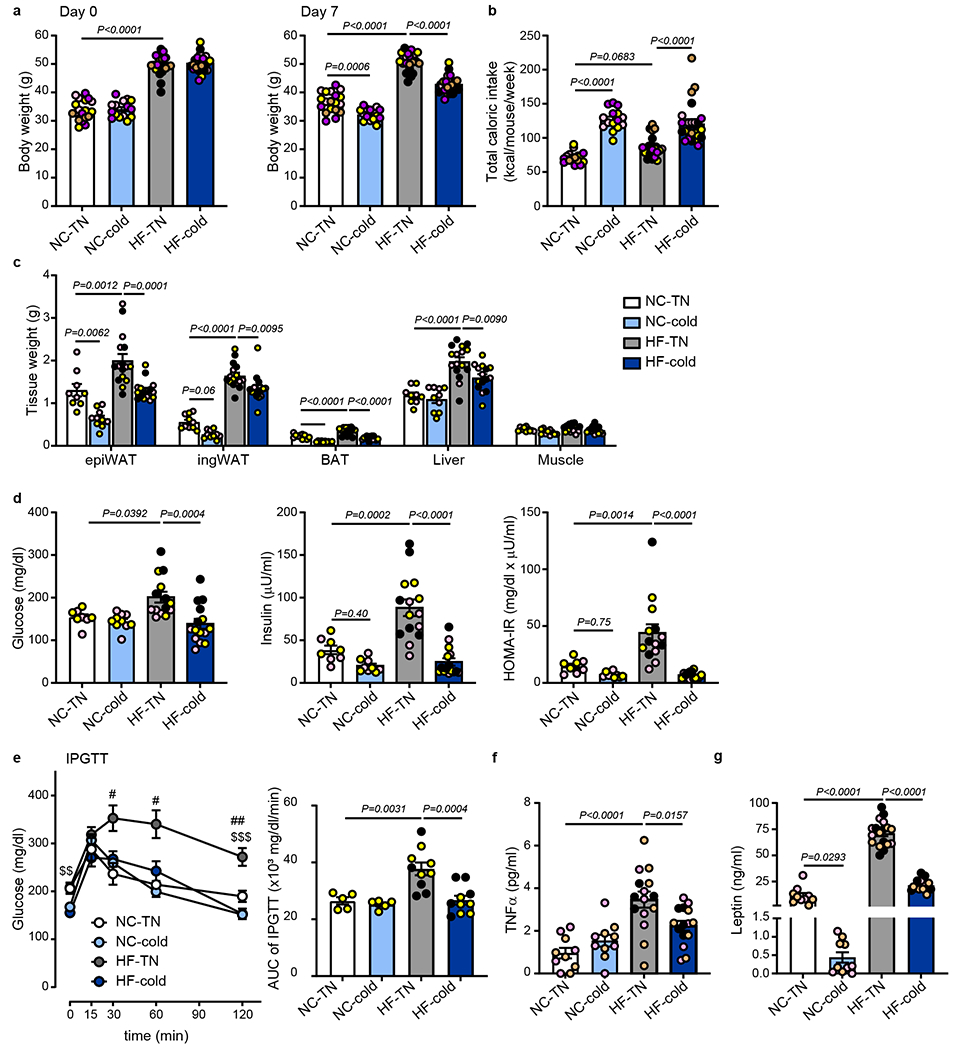
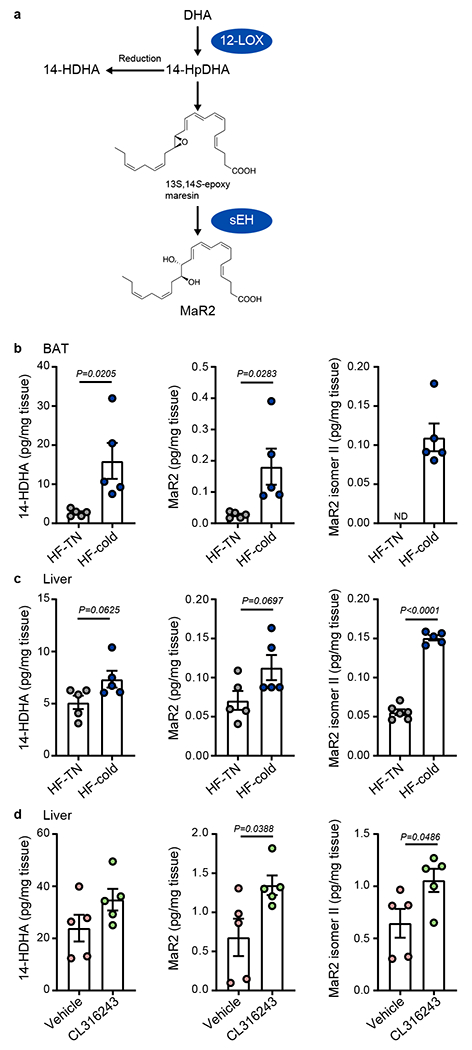
Obesity induces chronic inflammation resulting in insulin resistance and metabolic disorders. Cold exposure can improve insulin sensitivity in humans and rodents, but the mechanisms have not been fully elucidated. Here, we find that cold resolves obesity-induced inflammation and insulin resistance and improves glucose tolerance in diet-induced obese mice. The beneficial effects of cold exposure on improving obesity-induced inflammation and insulin resistance depend on brown adipose tissue (BAT) and liver. Using targeted liquid chromatography with tandem mass spectrometry, we discovered that cold and β3-adrenergic stimulation promote BAT to produce maresin 2 (MaR2), a member of the specialized pro-resolving mediators of bioactive lipids that play a role in the resolution of inflammation. Notably, MaR2 reduces inflammation in obesity in part by targeting macrophages in the liver. Thus, BAT-derived MaR2 could contribute to the beneficial effects of BAT activation in resolving obesity-induced inflammation and may inform therapeutic approaches to combat obesity and its complications.


Conflict of interest statement

Competing Interests Statement

M.S. and Y.-H.T. are inventors of a pending provisional patent application related to maresin 2 and metabolic therapeutics.

Figures

Extended Data Fig. 1
Extended Data Fig. 1. Cold exposure reduces body weight, inflammation and insulin resistance in obese mice, related to Fig. 1.
(a) C57BL6/J male mice were fed with normal chow (NC) or high-fat (HF) diet at room temperature for 14 weeks. The mice were then put in thermoneutral temperature (30 °C, TN) or cold (5 °C) for 7 days. Plasma levels of IFNγ, IL-6 and IL-1β at day 7 following TN or cold exposure (related to Fig. 1, n = 5 biologically independent animals per group, from 1 independent experiment). (b-e) C57BL6/J female mice were fed with normal chow (NC) or high-fat (HF) diet at room temperature for 19 weeks. The mice were then put in thermoneutral temperature (30 °C, TN) or cold (5 °C) for 7 days. (b) Body weight on day 0 or day 7 following TN or cold exposure (n = 5 biologically independent animals for NC-TN, NC-cold and HF-cold, n = 6 for HF-TN, from 1 independent experiment). (c) Total caloric intake during the exposure period (n = 5 biologically independent animals for NC-TN, NC-cold and HF-cold, n = 6 for HF-TN, from 1 independent experiment). (d) Fasting blood glucose, plasma insulin and homeostatic model assessment of insulin resistance (HOMA-IR) (n = 5 biologically independent animals for NC-TN, NC-cold and HF-cold, n = 6 for HF-TN, from 1 independent experiment). (e) Plasma levels of TNF-α (n = 5 biologically independent animals per group, from 1 independent experiment, statistical significance was determined by two-tailed unpaired Student’s t-test). One-Way ANOVA followed by a Tukey’s post hoc test. Data are presented as mean ± SEM.
Extended Data Fig. 2
Extended Data Fig. 2. Two days of cold exposure reduces insulin resistance and inflammation in DIO mice, related to Fig. 1.
C57BL6/J male mice were fed with normal chow (NC) or high-fat (HF) diet at room temperature for 14 weeks to create DIO mice. (a-f) The DIO mice were exposed to thermoneutral (30 °C, TN) or cold (5 °C) conditions for 2 days. (a) Body weight on day 0 or day 2 following TN or cold exposure (n = 5 biologically independent animals for NC-TN and NC-cold, n = 10 for HF-TN and HF-cold, from 2 independent experiments). (b) Total caloric intake during the exposure period (n = 5 biologically independent animals for NC-TN and NC-cold, n = 10 for HF-TN and HF-cold, from 2 independent experiments). (c) Tissue weights at the end of the exposure period (epiWAT, ingWAT, Liver, Muscle: n = 5 biologically independent animals for NC-TN and NC-cold, n = 10 for HF-TN and HF-cold, from 2 independent experiments; BAT: n = 5 per group, from 1 independent experiment). (d) Fasting blood glucose, plasma insulin and homeostatic model assessment of insulin resistance (HOMA-IR) (n = 5 biologically independent animals for NC-TN and NC-cold, n = 10 for HF-TN and HF-cold, from 2 independent experiments). (e) Plasma levels of TNF-α (n = 5 biologically independent animals per group, from 1 independent experiment). (f) Plasma leptin levels (n = 5 biologically independent animals per group, from 1 independent experiment). (g-k) The DIO mice fed a HF diet for 15 weeks were treated with CL316243 (1 mg/kg/day, daily, i.p) for 9 days. (g, h) Body weight on day 0 and day 9 (n = 5 biologically independent animals per group, from 1 independent experiment). (i) Total caloric intake between day 0 and day 9 (n = 5 biologically independent animals per group, from 1 independent experiment). (j) Glucose levels during IPGTT after 7 days of CL316243 treatment (n = 5 biologically independent animals per group, from 1 independent experiment, Two-Way ANOVA followed by a Tukey’s post hoc). (k) Plasma TNF-α levels in mice treated with CL316243 for 9 days (n = 5 biologically independent animals for Vehicle, n = 6 for CL316243, from 1 independent experiment). Two-tailed Unpaired Student’s t-tests were performed to compare only 2 groups and One-Way ANOVA followed by a Tukey’s post hoc test was performed to compare 4 groups. Data are presented as mean ± SEM.
Extended Data Fig. 3
Extended Data Fig. 3. Cold does not resolve inflammation in white fat of DIO mice, related to Fig. 2.
C57BL6/J male mice were fed with normal chow (NC) or high-fat (HF) diet at room temperature for 14 weeks. The mice were then put in thermoneutral temperature (30 °C, TN) or cold (5 °C) for 7 days. (a) Relative mRNA expression of proinflammatory and NLRP3 inflammasome-related genes in ingWAT (n = 5 biologically independent animals per group, from 1 independent experiment). (b) Representative image of F4/80 staining of epiWAT sections from each group (Scale bar=100 μm) (n = 5 biologically independent animals for NC-TN, NC-cold and HF-cold, n = 4 for HF-TN, from 1 independent experiment). (c) The number of crown-like structures in epiWAT was determined by counting F4/80 positive areas per mm2 (n = 5 biologically independent animals for NC-TN, NC-cold and HF-cold, n = 4 for HF-TN, from 1 independent experiment). (d) The percentage of CD11c+ cells or CD206+ cells within the CD45+ F4/80+ population from ingWAT of DIO mice (n = 4 biologically independent animals per group, from 1 independent experiment). (e, f) Gating strategy for identification of CD11c+ and CD206+ cells in the epiWAT, ingWAT and BAT (e) and in the liver (f). One-Way ANOVA followed by a Tukey’s post hoc test. Data are presented as mean ± SEM.
Extended Data Fig. 4
Extended Data Fig. 4. Cold-induced resolution of inflammation precedes changes in lipid accumulation in the liver of DIO mice, related to Fig. 2.
(a-c) C57BL6/J male mice were fed with normal chow (NC) or high-fat (HF) diet at room temperature for 14 weeks. The mice were then exposed to thermoneutral temperature (30 °C, TN) or cold (5 °C) for 7 days. (a) Relative mRNA expression of lipogenesis-related genes in the liver (n = 5 biologically independent animals per group, from 1 independent experiment). (b) Liver TG levels (n = 5 biologically independent animals per group, from 1 independent experiment). (c) Representative images of hematoxylin and eosin (H&E) staining of liver sections from NC-TN, HF-TN and HF-cold groups (Scale bar=100 μm). (d-g) C57BL6/J male mice were fed with normal chow (NC) or high-fat (HF) diet at room temperature for 14 weeks. The mice were then put in thermoneutral temperature (30 °C, TN) or cold (5 °C) for 2 days. (d) Relative mRNA expression of lipogenesis-related genes in the liver (n = 5 biologically independent animals for NC-TN and NC-cold and HF-cold, n = 4 for HF-TN, from 1 independent experiment). (e) Liver TG levels (n = 5 biologically independent animals per group, from 1 independent experiment). (f) Representative images of hematoxylin and eosin (H&E) staining of liver sections from HF-TN and HF-cold groups (Scale bar=100 μm). (g) Relative mRNA expression of proinflammatory, NLRP3 inflammasome-related- and fibrosis-related genes in the liver (n = 5 biologically independent animals for NC-TN, NC-cold and HF-cold, n = 4 for HF-TN, Casp1 NC-cold, Casp1 HF-cold, Il18 HF-cold, Tlr4 HF-cold, from 1 independent experiment). One-Way ANOVA followed by a Tukey’s post hoc test. Data are presented as mean ± SEM.
Extended Data Fig. 5
Extended Data Fig. 5. Identification and quantification of maresin pathway products in BAT and liver, related to Fig. 3.
(a, d) MRM peaks (top) and MS/MS spectra with diagnostic ions labeled (bottom) of authentic MaR2 standard (blue) and of MaR2 and a structural isomer (denoted isomer II, red) identified in a selected sample from BAT (a) and liver (d) of 14 weeks high-fat (HF)-fed mice exposed to cold (5 °C) or thermoneutral (30 °C, TN) conditions for 7 days. (b, c) Quantification of 14-HDHA, MaR2, and MaR2 isomer II in BAT of C57BL6/J mice fed a high-fat diet (HF; b; normalized to protein concentration; n = 5 biologically independent animals per group, from 1 independent experiment) or normal chow (NC; 14 weeks; c; n = 5 biologically independent animals for NC-TN and n = 4 for NC-cold, from 1 independent experiment) exposed to thermoneutral temperature (30 °C, TN) or cold (5 °C) for 7 days. ND: not detected. (e, f) Quantification of 14-HDHA, MaR2, and MaR2 isomer II in the liver of C57BL6/J mice fed HF (e; normalized to protein concentration; n = 5 biologically independent animals per group, except n = 4 for 14-HDHA HF-cold, from 1 independent experiment) or NC (f; n = 5 biologically independent animals per group, from 1 independent experiment) exposed to thermoneutral temperature (30 °C, TN) or cold (5 °C) for 7 days. (g) Quantification of 14-HDHA, MaR2, and MaR2 Isomer II (normalized to protein concentration) in the liver of HF-fed (15 weeks) male C57BL6/J mice treated with vehicle or CL316243 (1 mg/kg/day, daily i.p.) for 9 days (n = 5 biologically independent animals per group, from 1 independent experiment). Two-tailed Unpaired Student’s t-tests. Data are presented as mean ± SEM.
Extended Data Fig. 6
Extended Data Fig. 6. Identification of maresin pathway products in ingWAT of obese mice exposed to cold and in plasma of mice with BAT removal, related to Fig. 4 and Fig. 5.
(a) Relative expression of Ucp1 mRNA in ingWAT of HF-fed (14 weeks) C57BL6/J mice exposed to TN or cold for 7 days (n = 5 biologically independent animals per group, from 1 independent experiment). (b, c) Quantification of 14-HDHA, MaR1, and MaR2 in ingWAT and normalized to tissue weight (n = 6 biologically independent animals for HF-TN, n = 5 for HF-cold, from 1 independent experiment; b) or protein concentration (n = 6 biologically independent animals for HF-TN, n = 5 for HF-cold, from 1 independent experiment; c). (d, e) MRM peaks (d) and MS/MS spectra with diagnostic ions labeled (e) of authentic MaR2 standard and of two MaR2 isomers (denoted isomer I and II) identified in a selected sample of plasma of HF-fed mice following BAT removal. ND: not detected. Two-tailed Unpaired Student’s t-tests. Data are presented as mean ± SEM.
Extended Data Fig. 7
Extended Data Fig. 7. Identification of maresin pathway products in plasma of humans and expression of 12-LOX and sEH in human brown adipocytes, related to Fig. 6.
(a, b) MRM peaks (a) and MS/MS spectra with diagnostic ions labeled (b) of authentic 14-HDHA and MaR2 standards (top) and of 14-HDHA and MaR2 Isomer I identified in a selected sample of human plasma (bottom) following mirabegron administration. (c) Schematic of the treatment of human brown adipocytes with vehicle control or Forskolin (10μM), followed by the collection of the cells for qPCR (d) Relative mRNA expression of Alox12 and Ephx2 in human brown adipocytes treated with vehicle or Forskolin for indicated times (Alox12: n = 6 biologically independent cells for Vehicle, n = 4 biologically independent cells for 12 h, 18 h and 36 h, n = 3 biologically independent cells for 24 h, Ephx2: n = 6 biologically independent cells for Vehicle, n = 4 biologically independent cells for 12 h, 24 h and 36 h, n = 5 biologically independent cells for 18 h). One-Way ANOVA followed by a Tukey’s post hoc test. Data are presented as mean ± SEM.
Extended Data Fig. 8
Extended Data Fig. 8. MaR2 resolves inflammation systemically and in the liver of DIO mice, related to Fig. 8.
(a) Schematic of the experimental design of MaR2 treatment. C57BL6/J male mice were fed with a high-fat (HF) diet at room temperature for 14 weeks. Then the mice were administered vehicle or MaR2 (5 μg/kg/day; daily i.p.) for 28 days. (b) Body weight at day 0 and day 28 post-treatment (n = 5 biologically independent animals per group, from 1 independent experiment). (c) Plasma TNF-α levels post-treatment (n = 5 biologically independent animals per group, from 1 independent experiment). (d) Relative mRNA expression of proinflammatory, NLRP3-inflammasome-related- and fibrosis-related genes in the liver post-treatment (n = 5 biologically independent animals per group, from 1 independent experiment). (e) Schematic of the experimental design of MaR2 treatment. C57BL6/J male mice were fed with a high-fat (HF) diet at room temperature for 16 weeks. Then, the mice were administered vehicle or MaR2 (10 μg/kg/day; daily i.p.) for 26 days. (f) Body weight at day 0 and day 25 post-treatment, and the body weight change from baseline (n = 6 biologically independent animals per group, from 1 independent experiment). (g) Total caloric intake (n = 6 biologically independent animals per group, from 1 independent experiment). (h, i) Liver weight and TG levels in liver (n = 6 biologically independent animals per group, from 1 independent experiment). (j) Relative mRNA expression of lipogenesis-related genes in liver (n = 6 biologically independent animals per group, from 1 independent experiment). (k) Representative liver H&E staining from each group (Scale bar=100 μm). (l) Plasma levels of ALT in mice treated with vehicle or MaR2 (n = 6 biologically independent animals per group, from 1 independent experiment). (m, n) Relative mRNA expression of inflammation and NLRP3-inflammasome-related genes in the BAT (n = 6 biologically independent animals per group, from 1 independent experiment, m) and epiWAT (n = 5 for Vehicle, except Casp1 n = 4, n = 6 for MaR2, from 1 independent experiment, n) of mice treated with vehicle or MaR2. Two-tailed Unpaired Student’s t-tests. Data are presented as mean ± SEM.
Extended Data Fig. 9
Extended Data Fig. 9. Absorption kinetics of d5-MaR2 and regulation of liver monocytes/macrophages by MaR2, related to Fig. 8.
(a) Recovery of d5-MaR2 spiked into murine plasma and subjected to solid phase extraction and LC-MS/MS analysis, with mean d5-MaR2 recovered indicated along with the calculated coefficient of variation (CV) from 4 individual replicates. (b) Schematic of the administration of d5-MaR2 to male mice fed a high-fat diet for 15 weeks, followed by collection of blood at the indicated time points. The red circle indicates the position of the deuterium (D) atoms at the omega end of MaR2. (c) Quantification of d5-MaR2 in plasma after intraperitoneal administration to obese mice, as determined by LC-MS/MS (n = 3 biologically independent animals per group, from 1 independent experiment, Kruskal-Wallis test, followed by Dunn’s multiple comparisons post-tests). (d) Flow cytometry gating strategy of monocyte and macrophage populations in the liver. Representative dot plots showing Single cells, Live cells and CD45 + cells (related to Fig. 8e). (e, f) Quantification of monocyte (e) and macrophage (f) populations in the liver of mice treated with vehicle or MaR2 (10 μg/kg/day; daily i.p.) for 5 days (related to Fig. 8; n = 5 biologically independent animals per group, from 1 independent experiment) (g) Primary rat Kupffer cells were incubated with vehicle or MaR2 (50 nM) for 18 hours, then RNA was harvested for qPCR to measure relative mRNA expression of proinflammatory, NLRP3-inflammasome-related- and fibrosis-related genes (n = 3 technical replicates per group). Two-tailed Unpaired Student’s t-tests, except c. Data are presented as mean ± SEM.
Fig. 1:
Fig. 1:. Cold exposure reduces inflammation and insulin resistance and improves glucose tolerance in diet-induced obese (DIO) mice.
C57BL6/J male mice were fed with normal chow (NC) or high fat (HF) diet at room temperature for 14 weeks. The mice were then put in thermoneutral temperature (30°C, TN) or cold (5°C) for 7 days. (a) Body weight at day 0 and at day 7 following TN or cold exposure (n=19 biologically independent animals for NC-TN, n=15 for NC-cold and n=23 for HF-TN and HF-cold, from 5 independent experiments). (b) Total caloric intake for 7 days during the exposure period (n=18 biologically independent animals for NC-TN, n=15 for NC-cold, n=23 for HF-TN, n=24 for HF-cold, from 5 independent experiments). (c) Tissue weight at day 7 following TN or cold exposure (epiWAT, Liver: n=9 biologically independent animals for NC-TN, n=10 for NC-cold, n=16 for HF-TN, n=15 for HF-cold; ingWAT, BAT, Muscle: n=10 for NC-TN and NC-cold, n=16 for HF-TN, n=15 for HF-cold, from 3 different experiments). (d) Fasting blood glucose, plasma insulin, and homeostatic model assessment of insulin resistance (HOMA-IR) at day 7 following TN or cold exposure (Glucose: n=8 biologically independent animals for NC-TN, n=10 for NC-cold, n=14 for HF-TN, n=15 for HF-cold; Insulin: n=8 for NC-TN, n=9 for NC-cold, n=15 for HF-TN, HF-cold; HOMA-IR: n=8 for NC-TN, n=9 for NC-cold, n=14 for HF-TN, HF-cold, from 3 independent experiments). (e) Glucose levels during IPGTT at day 5 following TN or cold exposure (n=5 biologically independent animals for NC-TN and NC-cold, n=10 for HF-TN and HF-cold, #p<0.05, from 2 independent experiments, ##p<0.01 vs NC-TN, $$p<0.01, $$$p<0.001 vs HF-cold, Two-Way ANOVA followed by a Tukey’s post-hoc). Area under the curve (AUC) of IPGTT shown in the right panel. (f) Plasma TNFα levels at day 7 following TN or cold exposure (n=10 biologically independent animals for NC-TN and NC-cold, n=15 for HF-TN and HF-cold, from 3 independent experiments). (g) Plasma leptin levels at day 7 following TN or cold exposure (n=10 biologically independent animals for NC-TN and NC-cold, n=18 for HF-TN, n=15 HF-cold, from 3 independent experiments). One-Way ANOVA followed by a Tukey’s post-hoc test, except panel e. Different colors of circles represent mice from different study cohorts.
Fig. 2:
Fig. 2:. Cold resolves obesity-induced inflammation in BAT and liver of DIO mice.
C57BL6/J male mice were fed with normal chow (NC) or high fat (HF) diet at room temperature for 14 weeks. The mice were then put in thermoneutral temperature (30°C, TN) or cold (5°C) for 7 days. (a, c, and e) Relative expression of mRNA in pro-inflammatory and NLRP3 inflammasome-related genes in epididymal white fat (epiWAT) (n= 5 biologically independent animals per group, except n=4 for Il6 and Il1b HF-cold, from 1 independent experiment; a), BAT (n= 5 biologically independent animals per group, from 1 independent experiment, c), and liver (n= 5 biologically independent animals per group, from 1 independent experiment, e). (b and d) Ratio of CD11c+/CD206+ cells within the CD45+ F4/80+ population, as determined by flow cytometry analysis in epiWAT (n=5 biologically independent animals for NC-TN, n=8 for HF-TN and HF-cold, from 2 independent experiments, b) and BAT (n=5 biologically independent animals for NC-TN, n=6 for HF-TN, n=7 for HF-cold, from 2 independent experiments, d). (f) Ratio of CD11c+/CD206+ cells within the CD45+ F4/80+ CD11blow population as determined by flow cytometry analysis in the liver (n=7 biologically independent animals for NC-TN and HF-TN, n=6 for HF-cold, from 2 independent experiments). (g) Relative mRNA expression of toll-like receptors (Tlr) and Tgfb1 in the liver. (n= 5 biologically independent animals for NC-TN, NC-cold, from 1 independent experiment). (h) Plasma levels of ALT. (n=6 biologically independent animals for NC-TN, n=5 for NC-cold, n=12 for HF-TN, n=13 for HF-cold, from 3 independent experiments). One-Way ANOVA followed by a Tukey’s post-hoc test. Data are presented as mean ± SEM.
Fig. 3:
Fig. 3:. Cold increases DHA-derived MaR2 and related structural isomers in BAT and liver of DIO mice.
(a) Schematic of the Maresin 2 (MaR2) biosynthetic pathway including key enzymes (12-lipoxygenase, 12-LOX; and soluble Epoxide Hydrolase; sEH) and biosynthetic intermediates, 14-hydroperoxydocosahexaenoic acid (14-HpDHA) and 13S, 14S-epoxy maresin. Reduction of 14-HpDHA to 14-hydroxydocosahexaenoic acid (14-HDHA) is indicated and this product serves as a biosynthetic marker of the maresin pathway. (b, c) Quantification of 14-HDHA, MaR2, and MaR2 Isomer II in BAT (n=5 biologically independent animals per group, from 1 independent experiment, b) and liver (14HDHA and MaR2; n=5 biologically independent animals per group; MaR2 isomer II: n=6 per group, from 1 independent experiment, c) of 14 weeks HF-fed male C57BL6/J mice exposed to cold (5°C) or thermoneutral temperature (30°C, TN) for 7 days. (d) Quantification of 14-HDHA, MaR2, and MaR2 Isomer II in liver of 15 weeks HF-fed male C57BL6/J mice treated with vehicle control or CL316243 (1 mg/kg/day, i.p.) for 9 days (n=5 biologically independent animals per group, from 1 independent experiment). Two-tailed Unpaired Student’s t tests. Data are presented as mean ± SEM.
Fig. 4:
Fig. 4:. Cold specifically enhances the expression of 12-LOX and sEH in BAT, but not in the liver of DIO mice.
C57BL6/J male mice were fed with high fat (HF) diet at room temperature for 14 weeks to create DIO mice. The DIO mice were then put in thermoneutral temperature (30°C, TN) or cold (5°C) for 7 days. n = 5 mice/group. (a, b) Relative expression of 12-LOX mRNA (Alox12, n=5 biologically independent animals per group, from 1 independent experiment, a) and sEH mRNA (Ephx2, n=5 biologically independent animals per group, from 1 independent experiment, b) in BAT, epiWAT, ingWAT, liver and muscle. (c) Relative mRNA expression of 5-LOX (Alox5), 12/15-LOX (Alox15), COX-1 (Ptgs1) and COX-2 (Ptgs2) in BAT (n=5 biologically independent animals per group, from 1 independent experiment). (d) Western blot analysis of 12-LOX and sEH protein in the liver. Total proteins from the stain-free gel were used as loading control. Bottom panels: quantification of 12-LOX or sEH relative to total proteins (n=5 biologically independent animals per group, from 1 independent experiment). (e) DIO mice were treated with vehicle control or CL316243 (1mg/kg/day, daily i.p.) for 9 days. Relative mRNA expression of Alox12 and Ephx2 in the liver were then determined (n=5 biologically independent animals per group, from 1 independent experiment). Two-tailed Unpaired Student’s t tests. Data are presented as mean ± SEM.
Fig. 5.
Fig. 5.. BAT secretes MaR2 isomers in circulation.
(a) Left panel: Schematic of the experimental design of BAT removal study. Male C57BL6/J mice fed a high fat (HF) diet for 16 weeks at room temperature underwent surgical removal of their interscapular BAT or a sham procedure. Following a 10-day recovery period, the mice with BAT removal were placed in cold (5°C) for 2 days while sham mice were placed at thermoneutrality (30°C, TN) or cold (5°C). Right panel: Quantification of 14-HDHA, MaR2 Isomer I, and MaR2 Isomer II in plasma of HF-fed mice kept at thermoneutrality (TN) or exposed to cold (5°C) and subjected to sham or BAT removal (no BAT) surgery (14HDHA and MaR2 isomer II; n=5 biologically independent animals per group, MaR2 isomer I: n=5 for TN-sham and cold-no BAT, n=4 for Cold-sham, from 1 independent experiment). (b) Left panel: Schematic of the experimental design of BAT transplant study. BAT was removed from male mice exposed to TN or cold for 7 days and then transplanted to recipient male mice. After 7 weeks of HF diet feeding, plasma from recipient mice was subjected to LC-MS/MS analysis. Right panel: Quantification of 14-HDHA, MaR2 Isomer I, and MaR2 Isomer II in plasma of mice that received transplanted BAT from TN- or cold-exposed donor mice (n=5 biologically independent animals per group, from 1 independent experiment). (c) Left panel: Schematic of the experimental design whereby male mice fed a HF diet for 15 weeks were treated with vehicle control or CL316243 (1 mg/kg/day, daily i.p.) for 9 days. Right panel: Quantification of 14-HDHA, MaR2 Isomer I, and MaR2 Isomer II in plasma of mice administered vehicle control or CL316243 (n=5 biologically independent animals per group, from 1 independent experiment). (d) Left panel: Schematic illustrating the collection of cell culture media from in vitro differentiated murine brown adipocytes stimulated with vehicle control or CL316243 (1μM) for 4 hours. Right panel: Quantification of MaR2 Isomer I in cell culture media from brown adipocytes after 4 hours of treatment (n=5 wells per group, from 1 independent experiment). Two-tailed Unpaired Student’s t tests were performed to compare only 2 groups and One-Way ANOVA followed by a Tukey’s post-hoc test was performed to compare 3 groups. Data are presented as mean ± SEM.
Fig. 6:
Fig. 6:. Mirabegron increases maresin pathway products in humans.
(a, b) Quantification of 14-HDHA and MaR2 Isomer I in human plasma after administration of placebo or mirabegron (n=11 biologically independent samples). Two-tailed Paired t test. Data are expressed as paired samples from the same individual following the indicated treatment. (c, d) Relationship between circulating 14-HDHA or MaR2 isomer I and log10 BAT activity as determined by a linear mixed model. BAT activity was defined using PET-CT.
Fig. 7:
Fig. 7:. BAT-specific loss of Alox12 increases inflammation in the liver of DIO mice.
(a) Schematic illustrating the experimental design for cold-exposed UCP1CRE/Alox12-KD obese male mice using UCP1CRE and CRISPR-Cas9 knock-in mice. UCP1CRE/Cas9 knockin male mice and WT/Cas9 knockin male mice were generated by mating between UCP1CRE strain and the homozygous Rosa26-floxed STOP-Cas9 knockin mice. Each strain of mice was injected with AAV/Alox12 gRNA and AAV/Empty vector (EV) respectively, after 8 weeks of high fat (HF) diet feeding. The resultant BAT-specific Alox12-KD obese mice (UCP1CRE/Alox12-KD) and wild type obese mice (EV) were subsequently exposed to 7 days of cold (5°C). (b)Protein levels of 12-LOX in BAT as determined by Western blot. Vinculin was used as loading control. Bottom panels: quantification of 12-LOX relative to vinculin. (n=5 biologically independent animals for EV Cold, n=6 for UCP1cre/ALOX12-KD Cold, from 1 independent experiment). (c) Relative mRNA expression of pro-inflammatory, NLRP3-inflammasome related- and fibrosis related genes in the liver (n=5 biologically independent animals for EV Cold, n=6 for UCP1cre/ALOX12-KD Cold, from 1 independent experiment). (d) Plasma ALT levels. (n=4 biologically independent animals for EV Cold, n=5 for UCP1cre/ALOX12-KD Cold, from 1 independent experiment). (e, f) Liver weight and triglyceride (TG) levels (n=5 biologically independent animals for EV Cold, n=6 for UCP1cre/ALOX12-KD Cold, from 1 independent experiment). (g) Representative image of hematoxylin and eosin (H&E) staining of liver sections from each group (Scale bar=100 μm). Two-tailed Unpaired Student’s t tests. Data are presented as mean ± SEM.
Fig. 8:
Fig. 8:. MaR2 resolves inflammation in obesity in part by targeting macrophages.
(a) Schematic of the experimental design of MaR2 treatment. C57BL6/J male mice were fed with a high fat (HF) diet at room temperature for 16 weeks. Then, the mice were administered vehicle or MaR2 (10 μg/kg/day; daily i.p.) for 26 days. (b) Plasma TNFα levels (n=6 biologically independent animals per group, from 1 independent experiment). (c) Relative mRNA expression of pro-inflammatory, NLRP3-inflammasome related- and fibrosis related genes in the liver (n=6 biologically independent animals per group, except Tnfa Vehicle: n=5, Tnfa Mar2: n=4, from 1 independent experiment). (d) Schematic of the experimental design of MaR2 treatment. C57BL6/J male mice were fed with a high fat (HF) diet at room temperature for 17 weeks. Then, the mice were administered vehicle or MaR2 (10 μg/kg/day; daily i.p.) for 5 days. (e) Flow cytometry gating strategy of monocyte and macrophage populations in the liver. Representative dot plots showing CD45+F4/80CD11bhi monocytes with differential expression of Ly6C and CCR2 (top) and CD45+F4/80+CD11bint macrophages (bottom) are shown. Macrophages were further delineated based on expression of TIM4 and MHCII, with TIM4hiMHCII+VISIG4+CCR2 macrophages defined as resident Kupffer cells (KCs) and TIM4loMHCII+VISIG4+CCR2 macrophages defined as monocyte-derived Kupffer cells (mo-KCs). (f) Representative contour plots showing TREM2 expression on KCs of mice treated with vehicle or MaR2, with isotype control indicated. (g, h, i) Quantification of TREM2+ monocyte subsets in the liver (n=5 biologically independent animals per group, from 1 independent experiment). (j) Quantification of TREM2+ KCs in the liver (n=4 biologically independent animals per group, from 1 independent experiment). (k) Quantification of TREM2+ mo-KCs in the liver (n=5 biologically independent animals for Vehicle, n=4 for MaR2, from 1 independent experiment). (l) Schematic of the treatment protocol whereby resting or LPS-primed (100 ng/ml; 3 hours) bone marrow-derived macrophages (BMDM) were stimulated with palmitate conjugated to BSA (PA-BSA, 200μM, 24 hours) with or without MaR2 (10nM). Supernatants were collected and the concentrations of IL-1β and TNFα were measured by ELISA (n=7 biologically independent animals per group, from 3 independent experiments, Paired parametric 1-way ANOVA followed by Fisher’s LSD test). Two-tailed Unpaired Student’s t test, except panel l. Data are presented as mean ± SEM.

Comment in

References

    1. Blüher M Obesity: global epidemiology and pathogenesis. Nature reviews. Endocrinology 15, 288–298 (2019). - PubMed
    1. Weisberg SP, et al. Obesity is associated with macrophage accumulation in adipose tissue. The Journal of clinical investigation 112, 1796–1808 (2003). - PMC - PubMed
    1. Romeo GR, Lee J & Shoelson SE Metabolic syndrome, insulin resistance, and roles of inflammation--mechanisms and therapeutic targets. Arteriosclerosis, thrombosis, and vascular biology 32, 1771–1776 (2012). - PMC - PubMed
    1. Hotamisligil GS, Arner P, Caro JF, Atkinson RL & Spiegelman BM Increased adipose tissue expression of tumor necrosis factor-alpha in human obesity and insulin resistance. The Journal of clinical investigation 95, 2409–2415 (1995). - PMC - PubMed
    1. Esser N, Legrand-Poels S, Piette J, Scheen AJ & Paquot N Inflammation as a link between obesity, metabolic syndrome and type 2 diabetes. Diabetes research and clinical practice 105, 141–150 (2014). - PubMed

Publication types

Substances