Glacier fluctuations in the northern Patagonian Andes (44°S) imply wind-modulated interhemispheric in-phase climate shifts during Termination 1
- PMID: 35761034
- PMCID: PMC9237032
- DOI: 10.1038/s41598-022-14921-4
Glacier fluctuations in the northern Patagonian Andes (44°S) imply wind-modulated interhemispheric in-phase climate shifts during Termination 1
Abstract
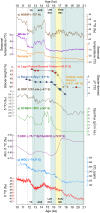
The Last Glacial Termination (T1) featured major changes in global circulation systems that led to a shift from glacial to interglacial climate. While polar ice cores attest to an antiphased thermal pattern at millennial timescales, recent well-dated moraine records from both hemispheres suggest in-phase fluctuations in glaciers through T1, which is inconsistent with the bipolar see-saw paradigm. Here, we present a glacier chronology based on 30 new 10Be surface exposure ages from well-preserved moraines in the Lago Palena/General Vintter basin in northern Patagonia (~ 44°S). We find that the main glacier lobe underwent profound retreat after 19.7 ± 0.7 ka. This recessional trend led to the individualization of the Cerro Riñón glacier by ~ 16.3 ka, which underwent minor readvances at 15.9 ± 0.5 ka during Heinrich Stadial 1, during the Antarctic Cold Reversal with successive maxima at 13.5 ± 0.4, 13.1 ± 0.4, and 13.1 ± 0.5 ka, and a minor culmination at 12.5 ± 0.4 ka during Younger Dryas time. We conclude that fluctuations of Patagonian glaciers during T1 were controlled primarily by climate anomalies brought by shifts in the Southern Westerly Winds (SWW) locus. We posit that the global covariation of mountain glaciers during T1 was linked to variations in atmospheric CO2 (atmCO2) promoted by the interplay of the SWW-Southern Ocean system at millennial timescales.
© 2022. The Author(s).
Conflict of interest statement
The authors declare no competing interests.
Figures


References
-
- Denton GH, et al. The last glacial termination. Science. 2010;328:1652–1656. - PubMed
-
- WAIS, Divide Project Members. Onset of deglacial warming in West Antarctica driven by local orbital forcing. Nature. 500 (7463), 440–444 (2013). - PubMed
-
- Rasmussen SO, et al. A new Greenland ice core chronology for the last glacial termination. J. Geophys. Res. Atm. 2006;111(6):1–16.
-
- Wittmeier HE, et al. Late Glacial mountain glacier culmination in Artic Norway prior to Younger Dryas. Quat. Sci. Rev. 2020;245:106461.
Publication types
MeSH terms
LinkOut - more resources
Full Text Sources

