. 2022 Jul;23(7):1121-1131.
doi: 10.1038/s41590-022-01229-8. Epub 2022 Jun 27.

Tissue-resident memory CD8+ T cells possess unique transcriptional, epigenetic and functional adaptations to different tissue environments

Affiliations

Tissue-resident memory CD8+ T cells possess unique transcriptional, epigenetic and functional adaptations to different tissue environments

John T Crowl et al. Nat Immunol. 2022 Jul.

Abstract

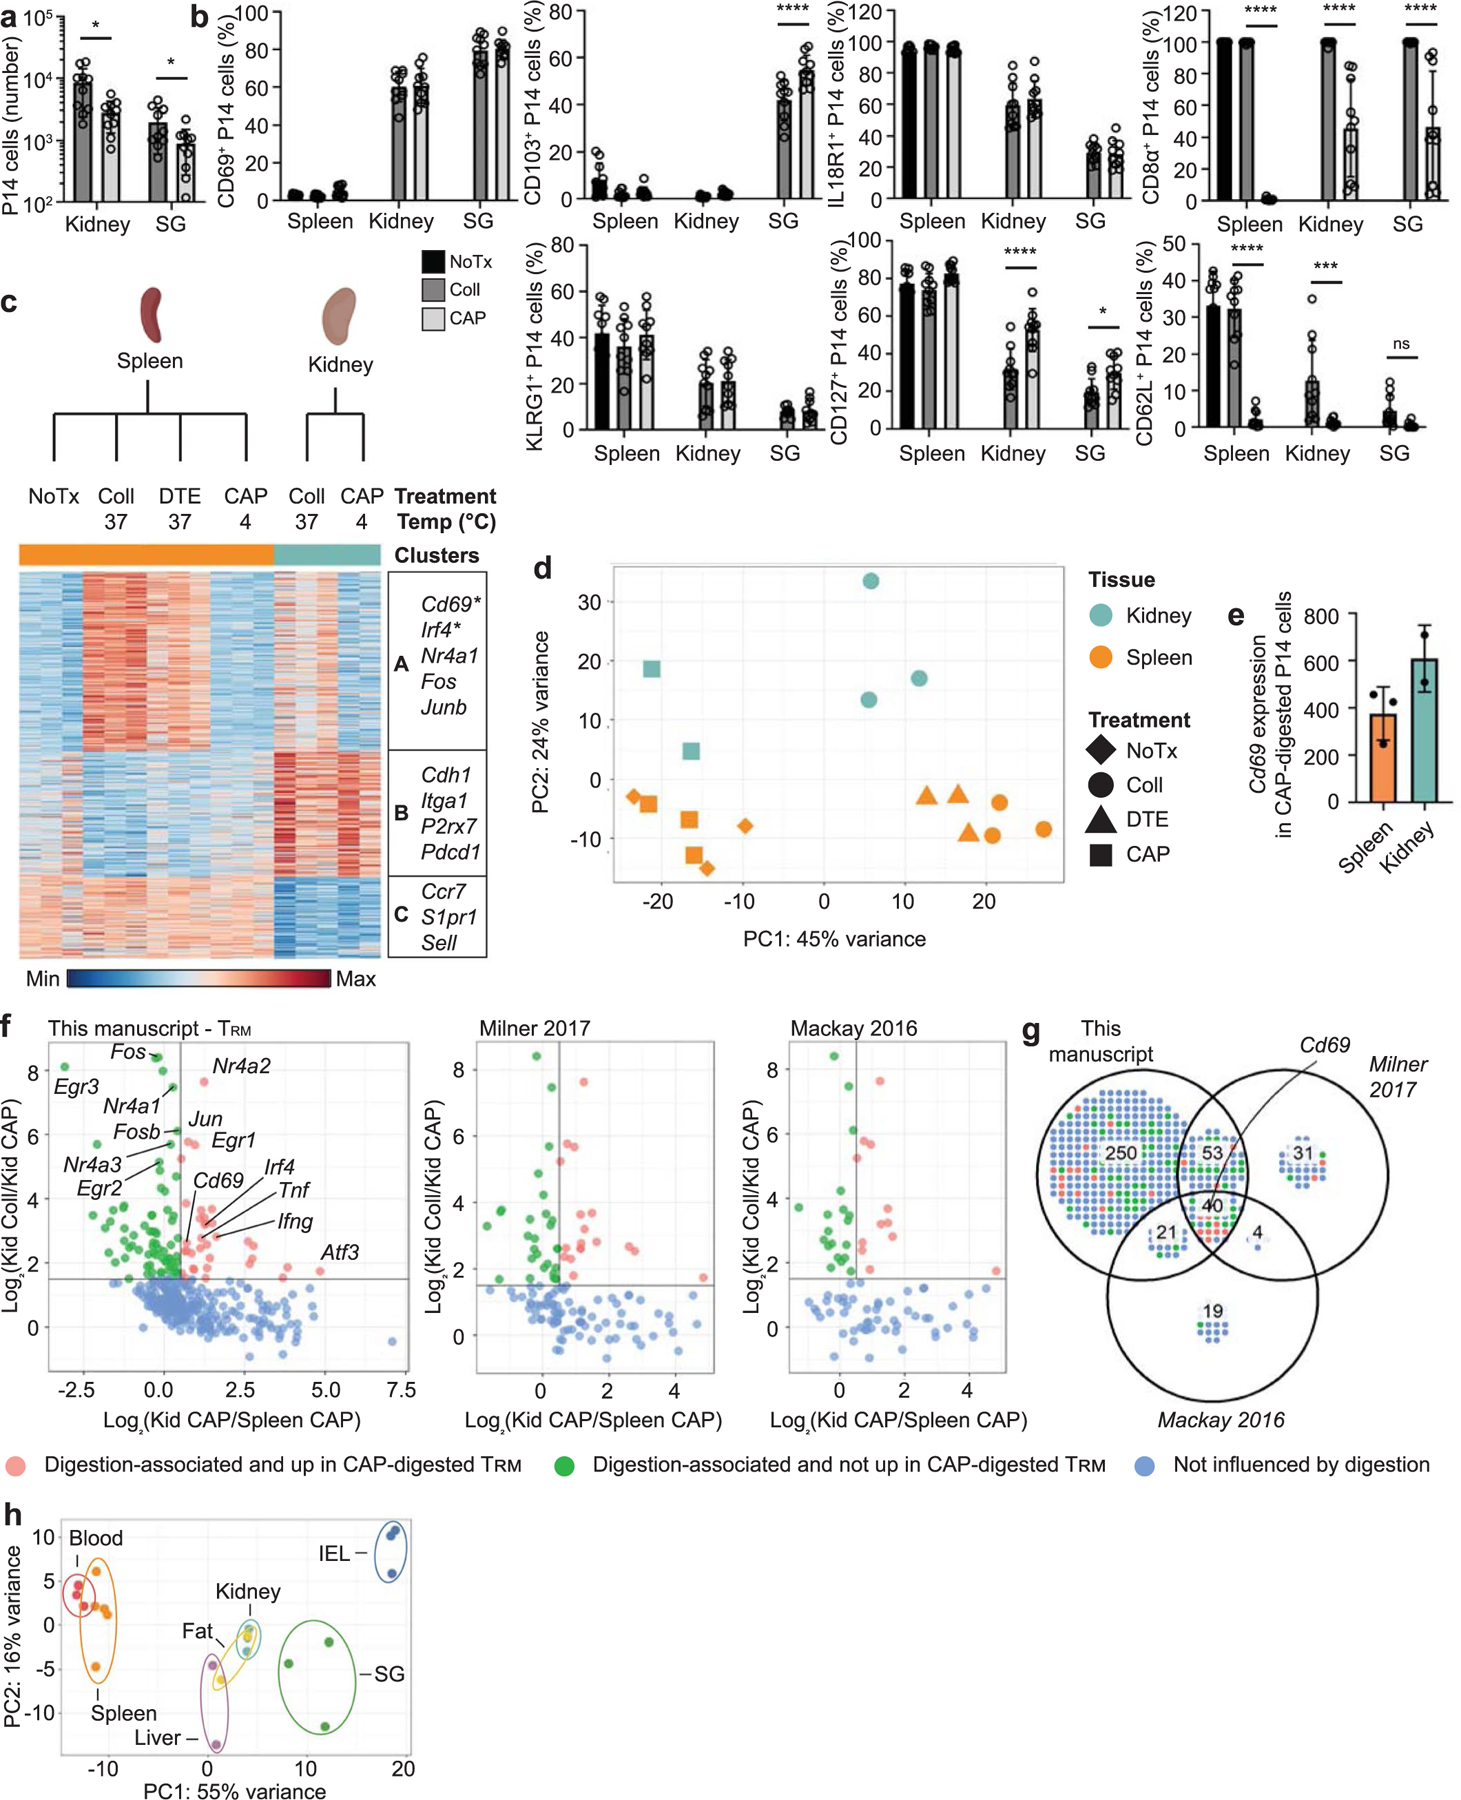
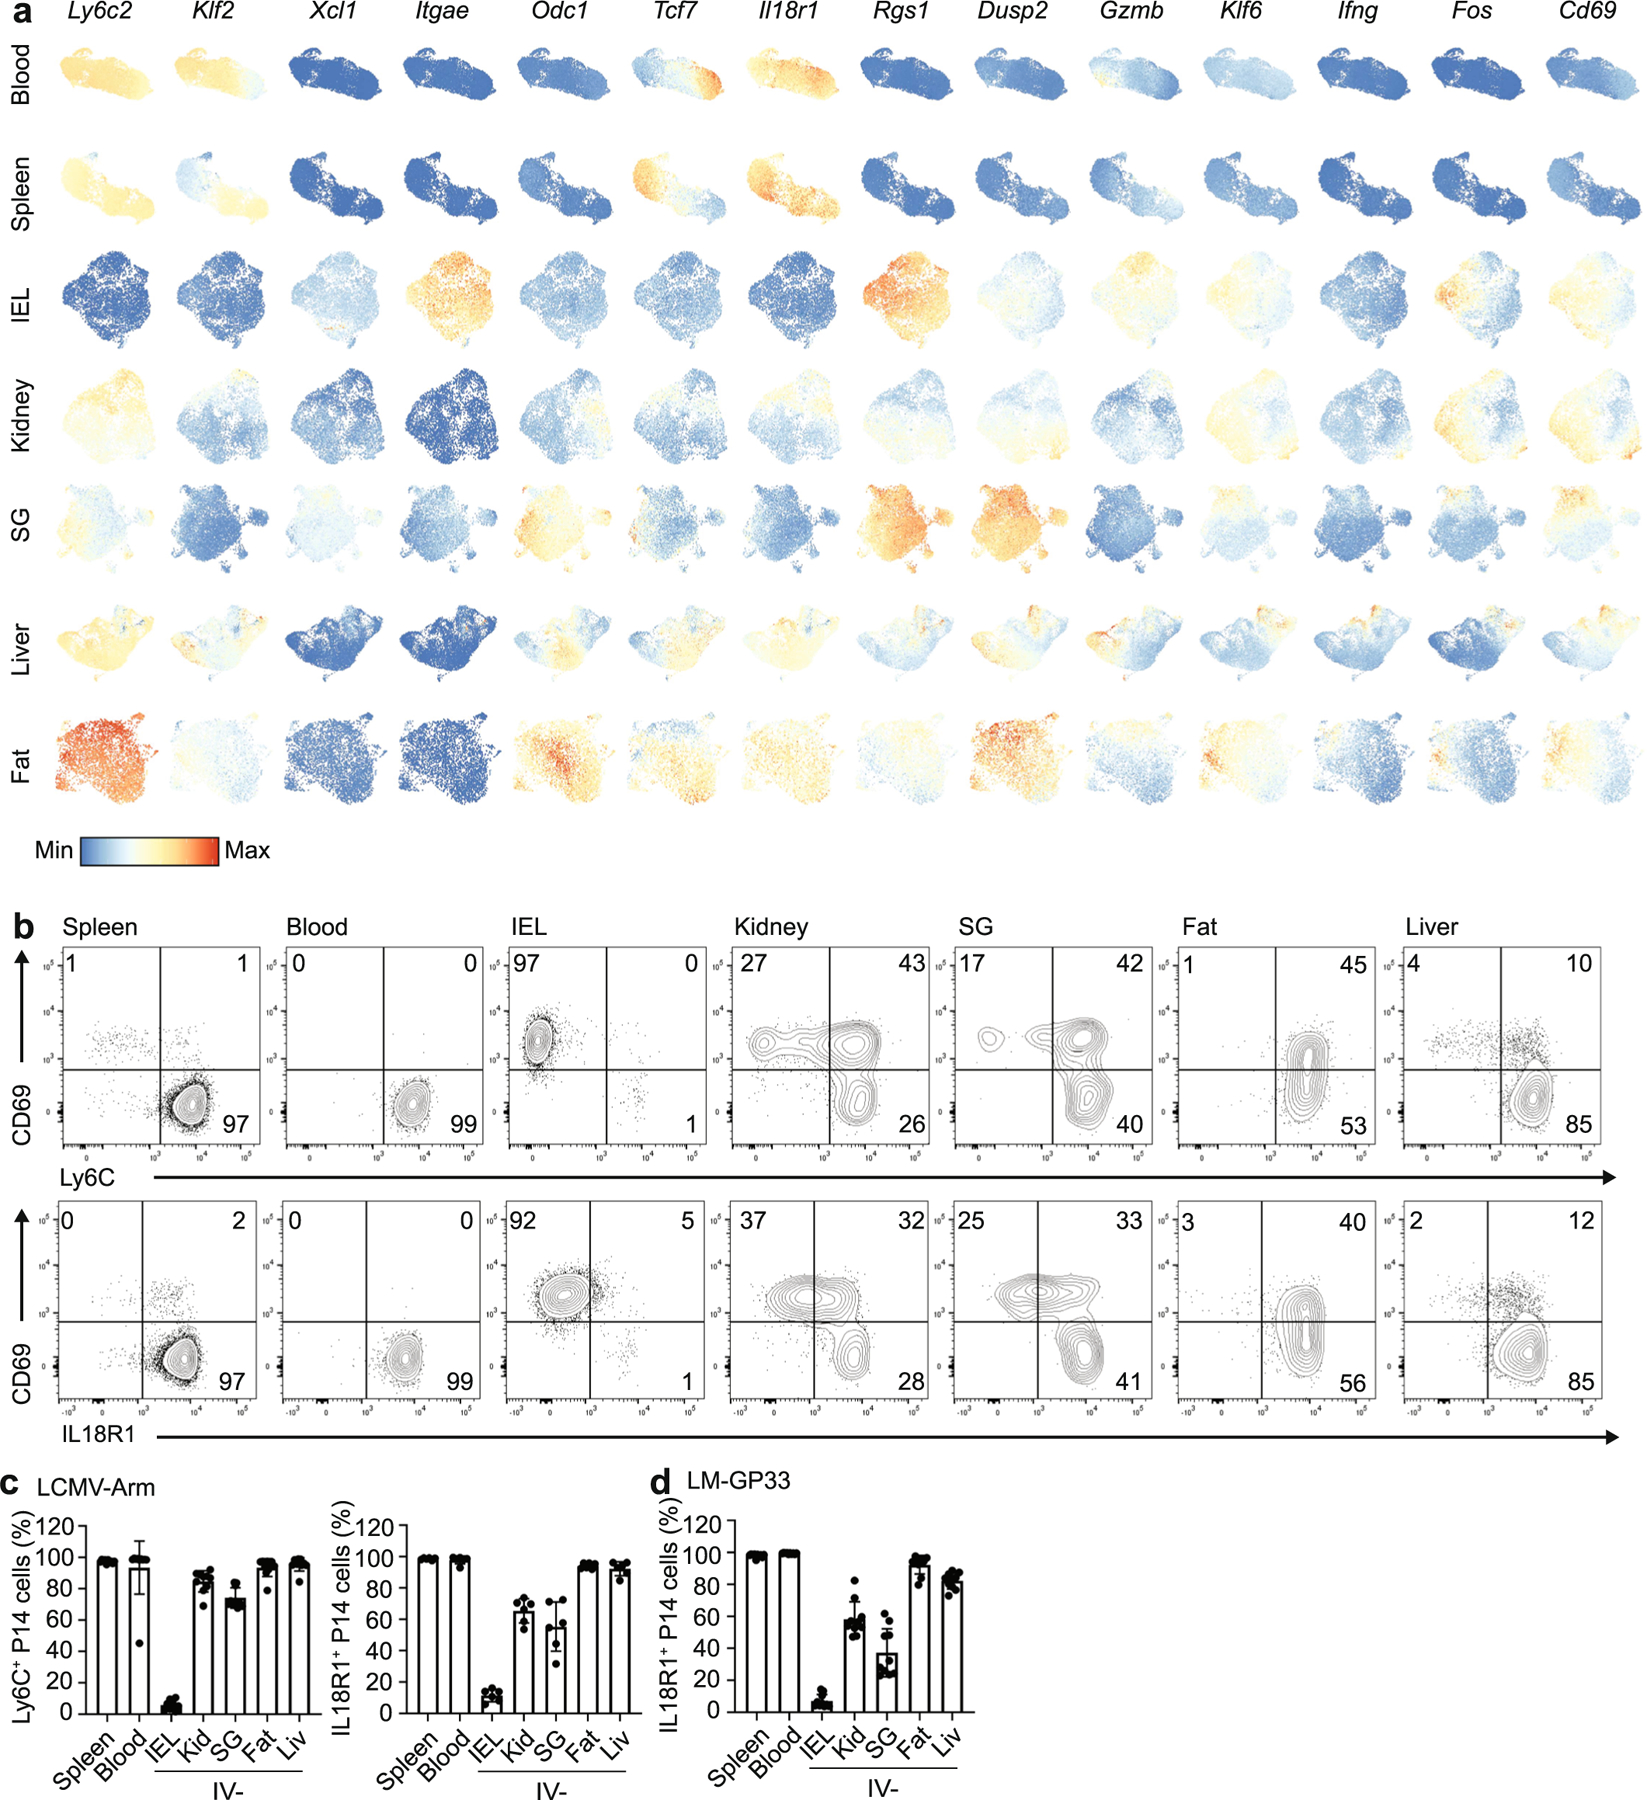
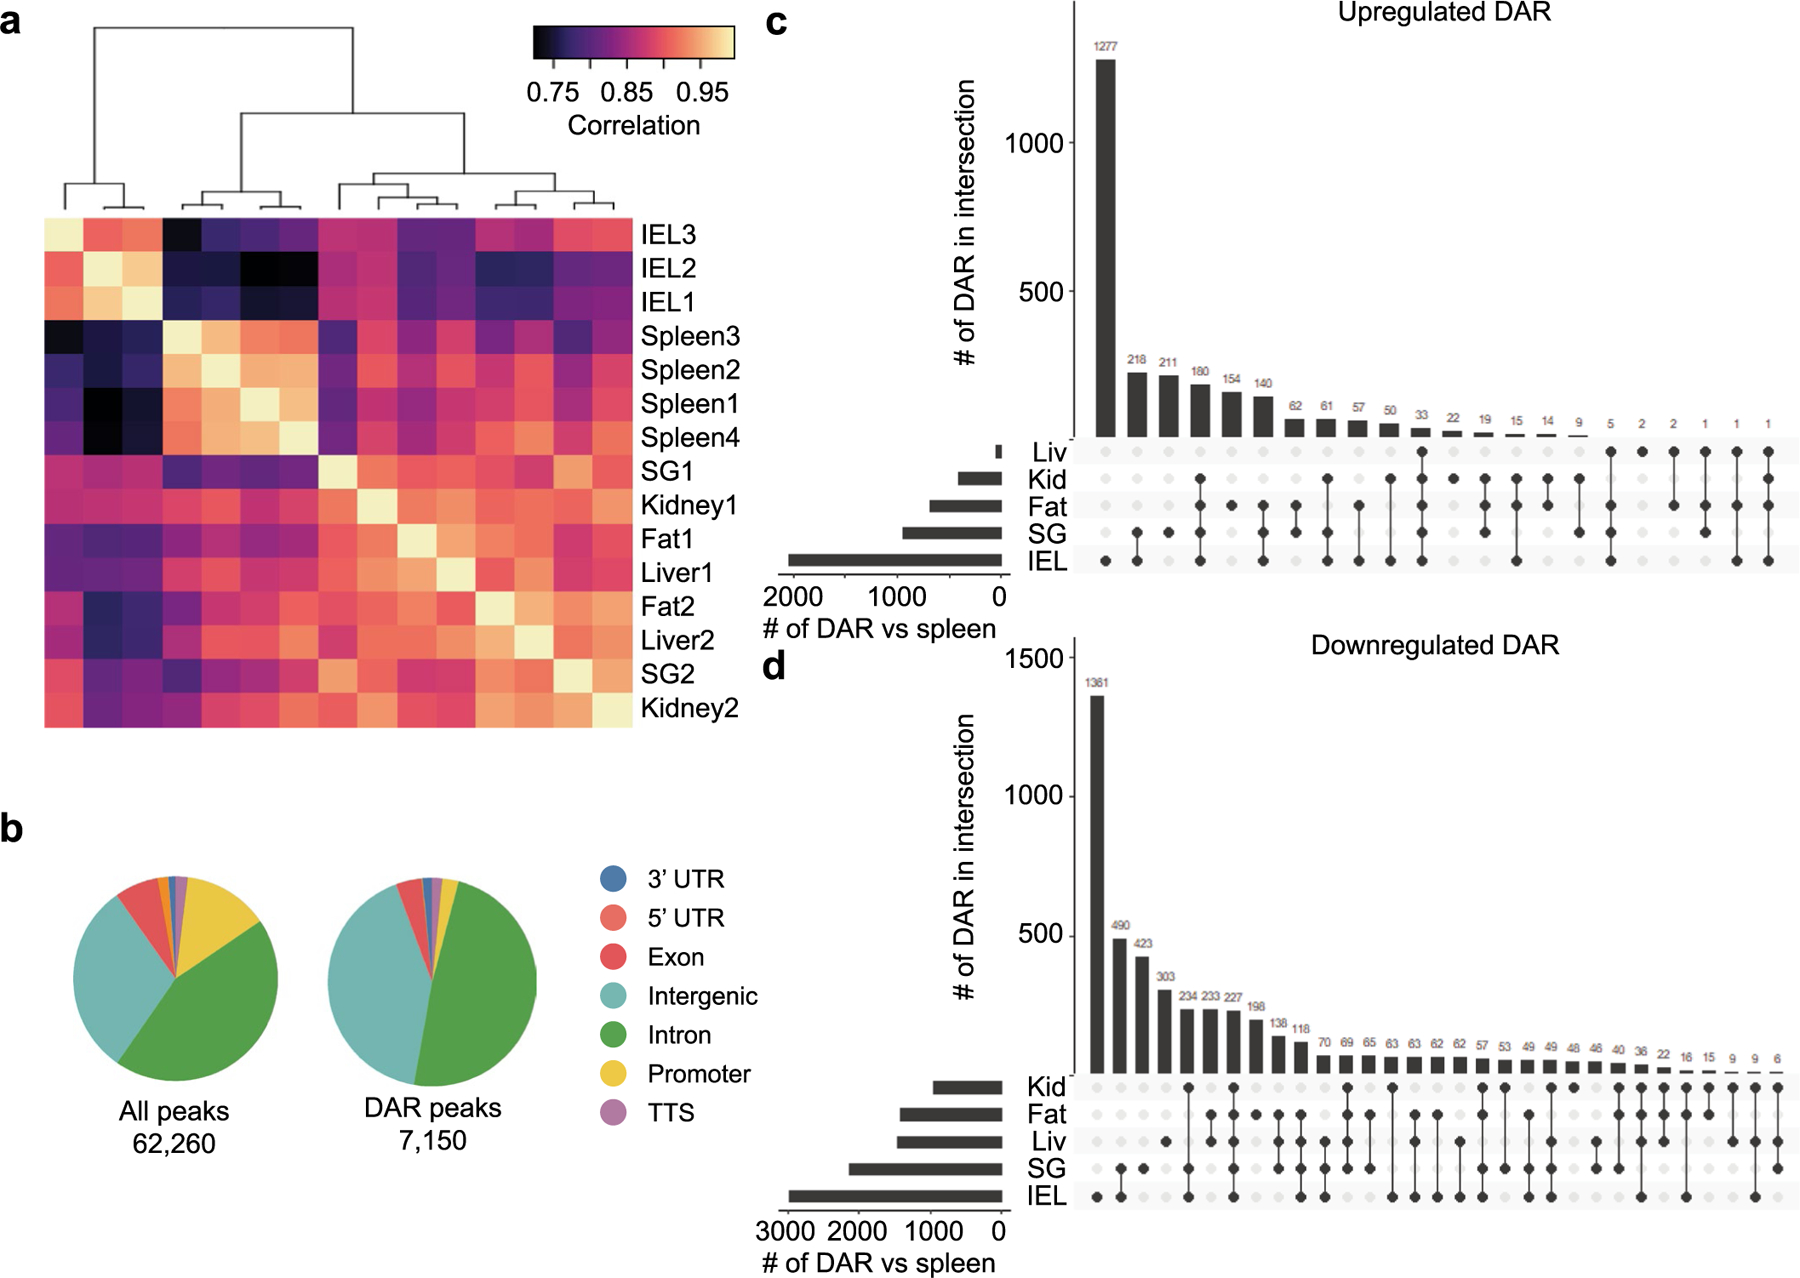
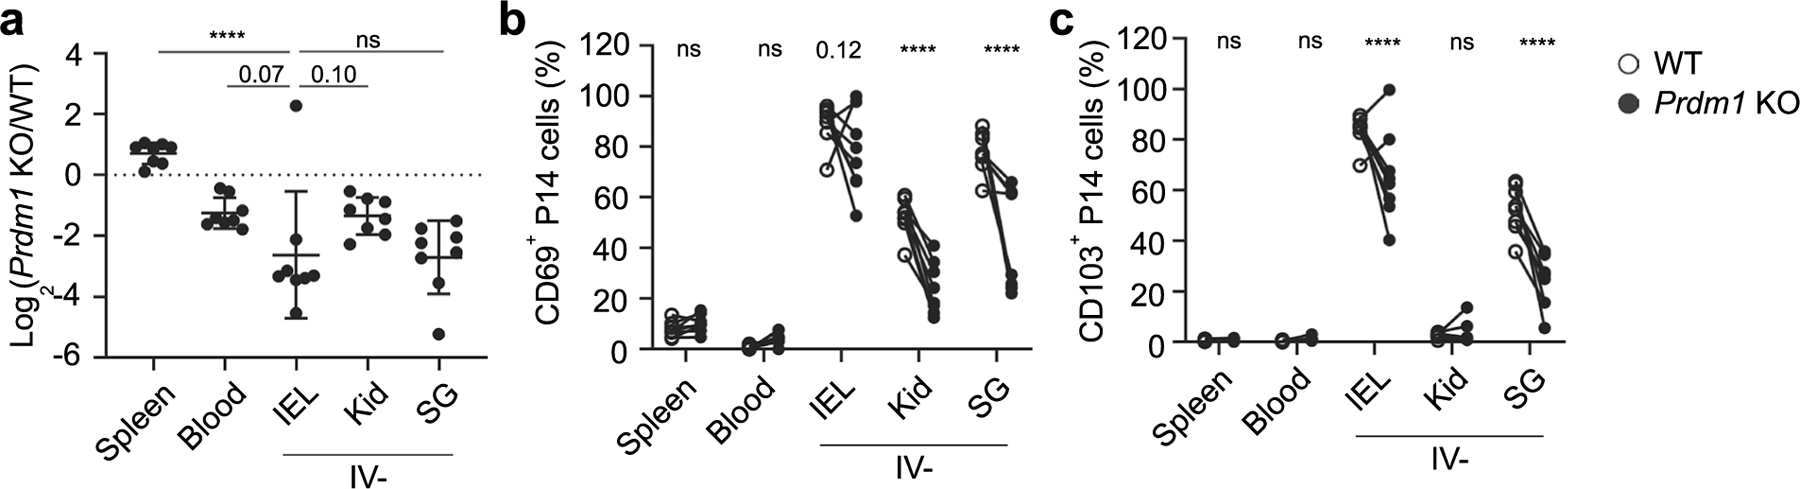
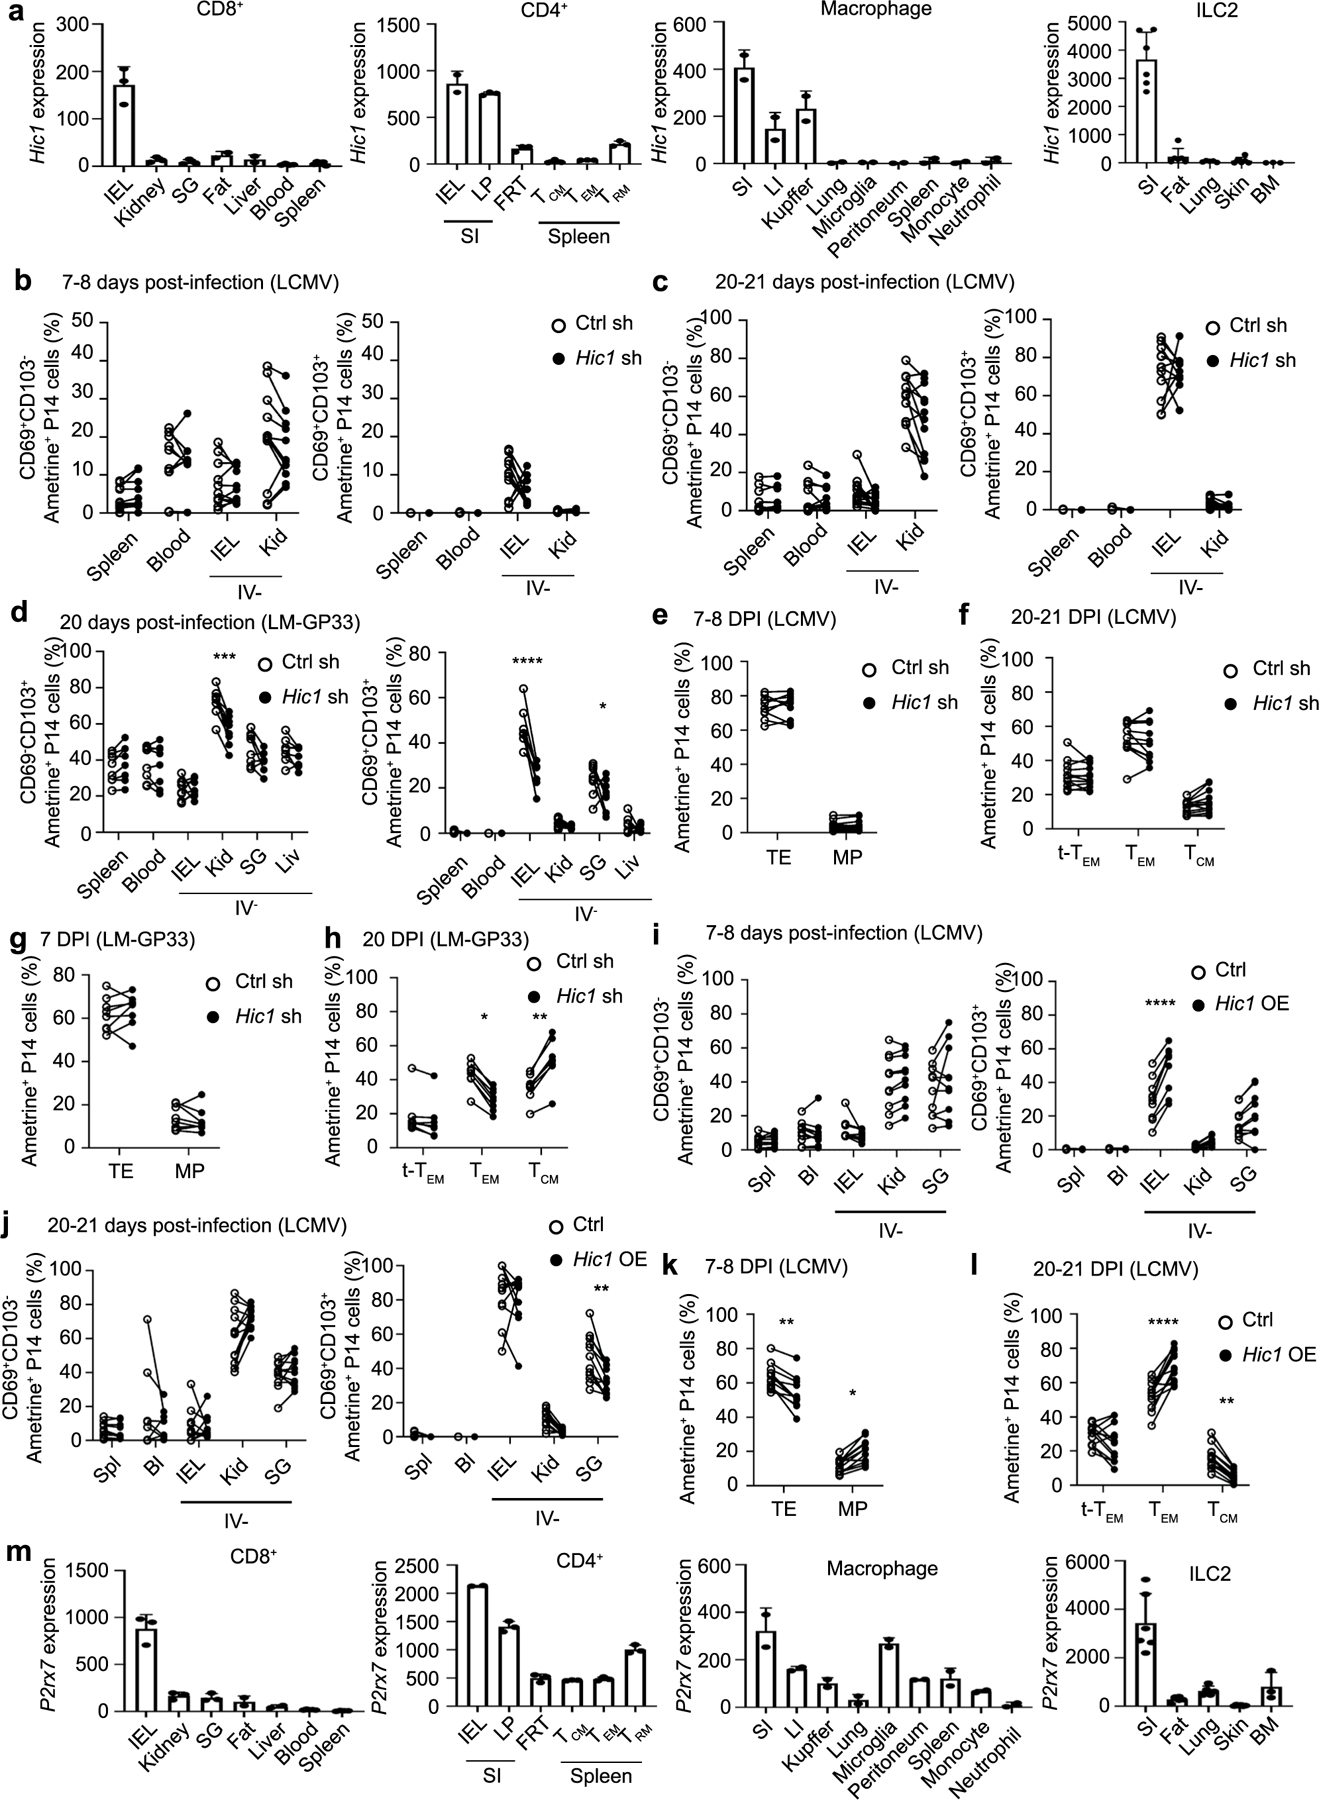
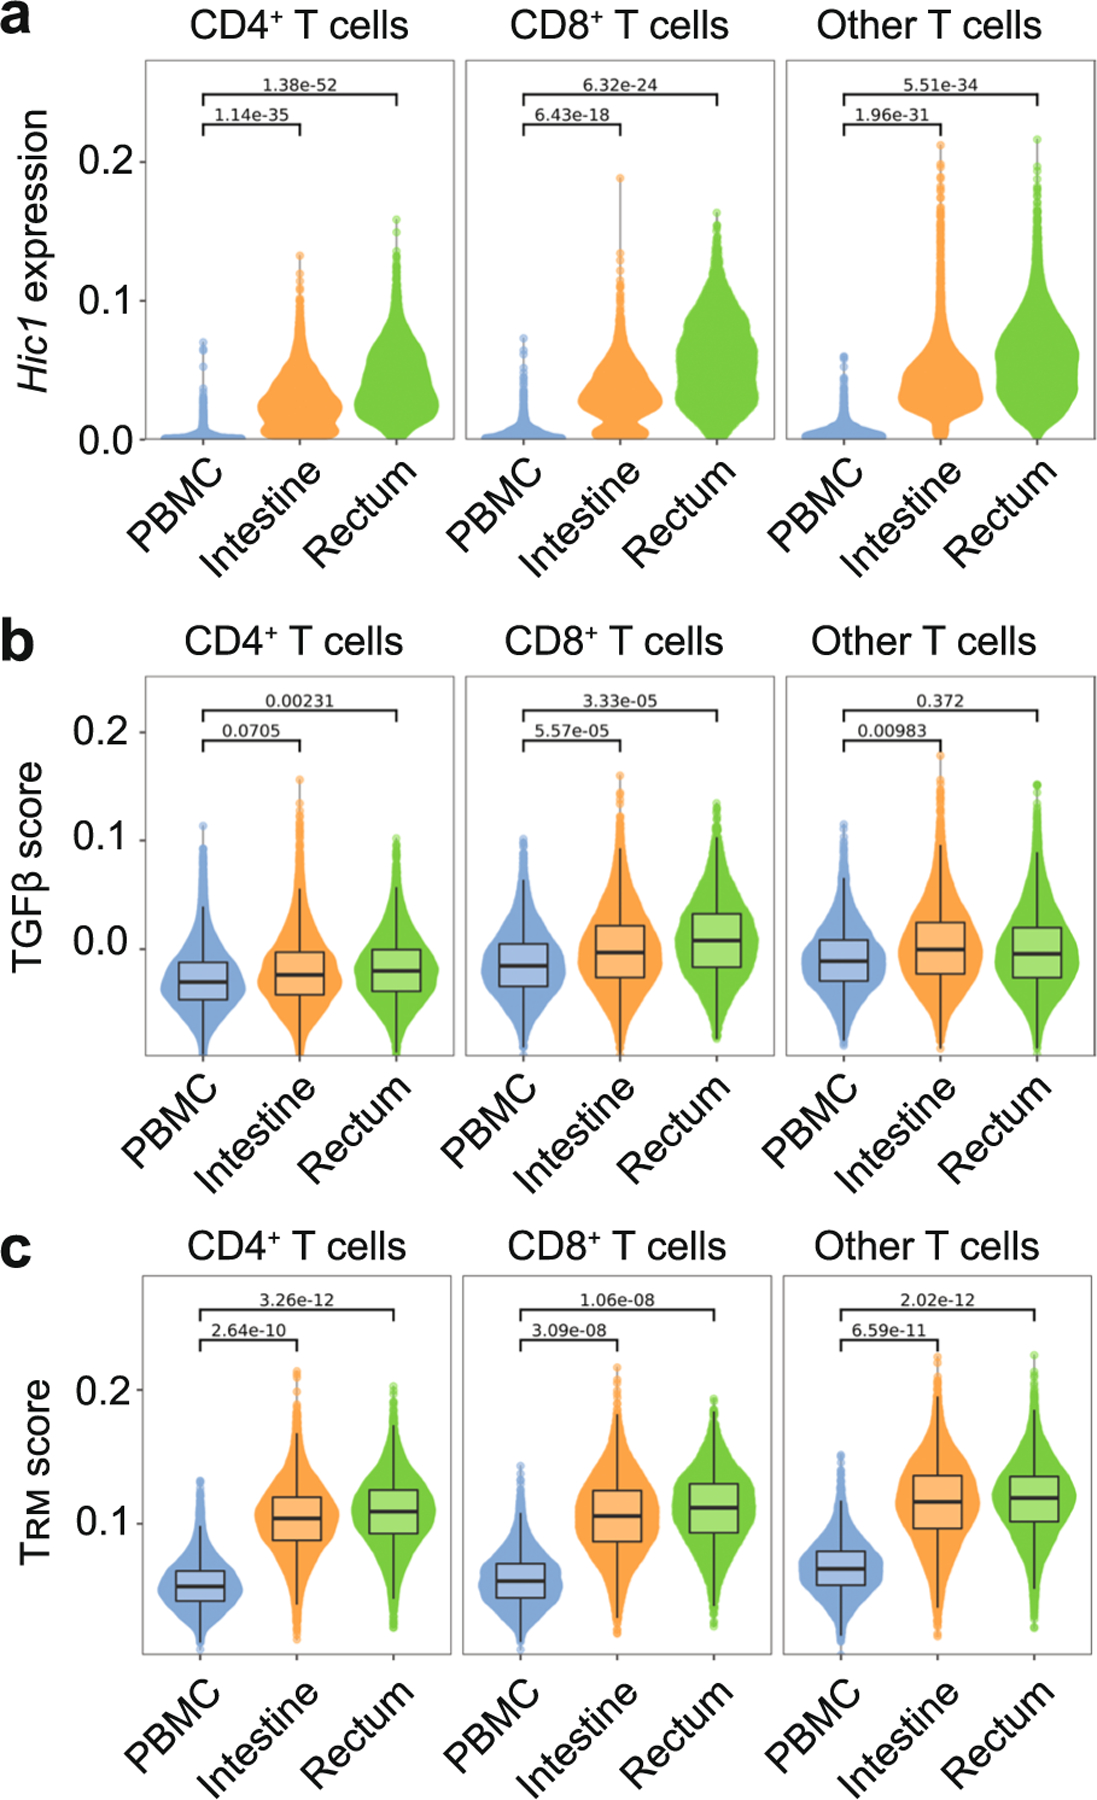
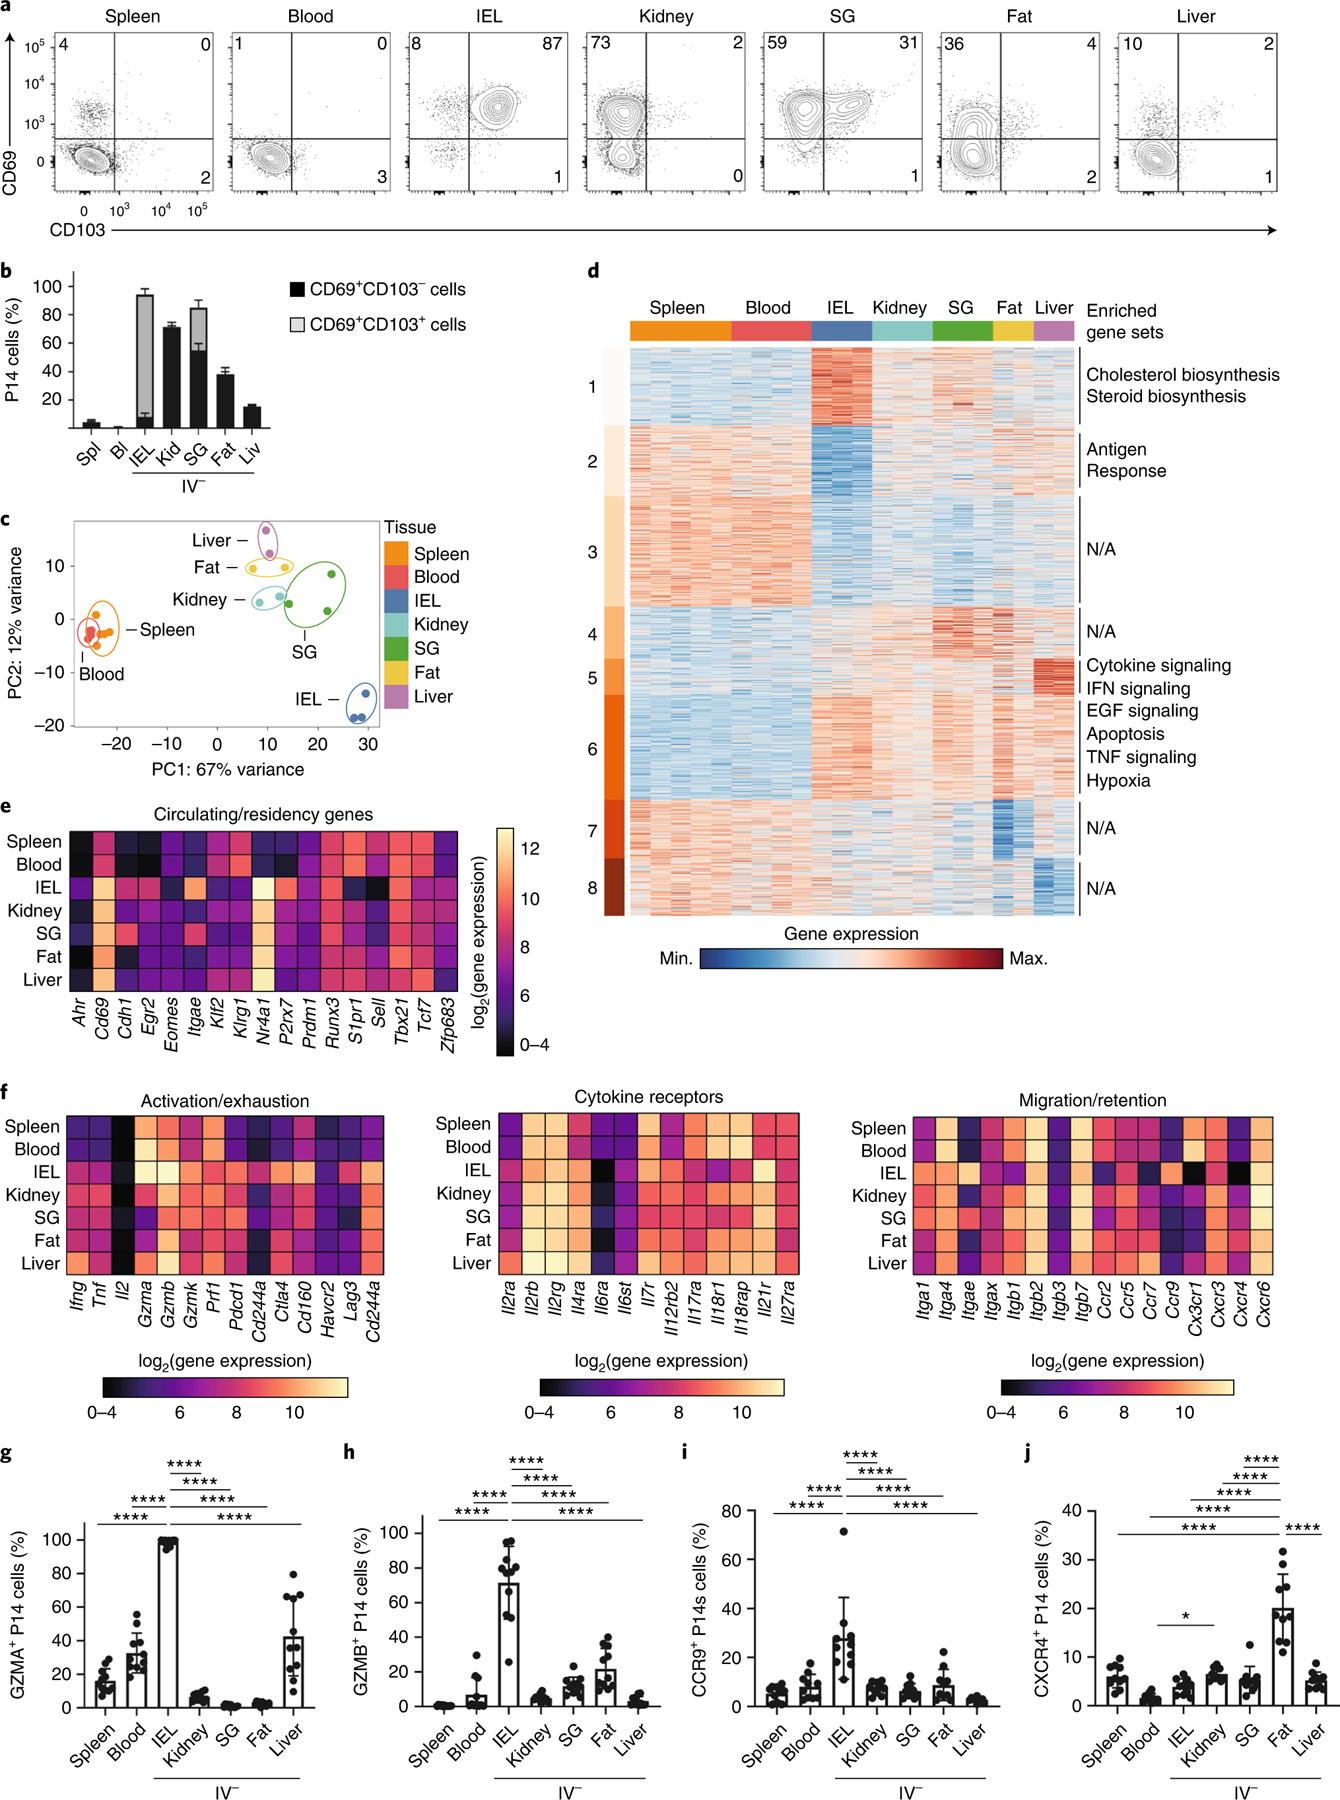
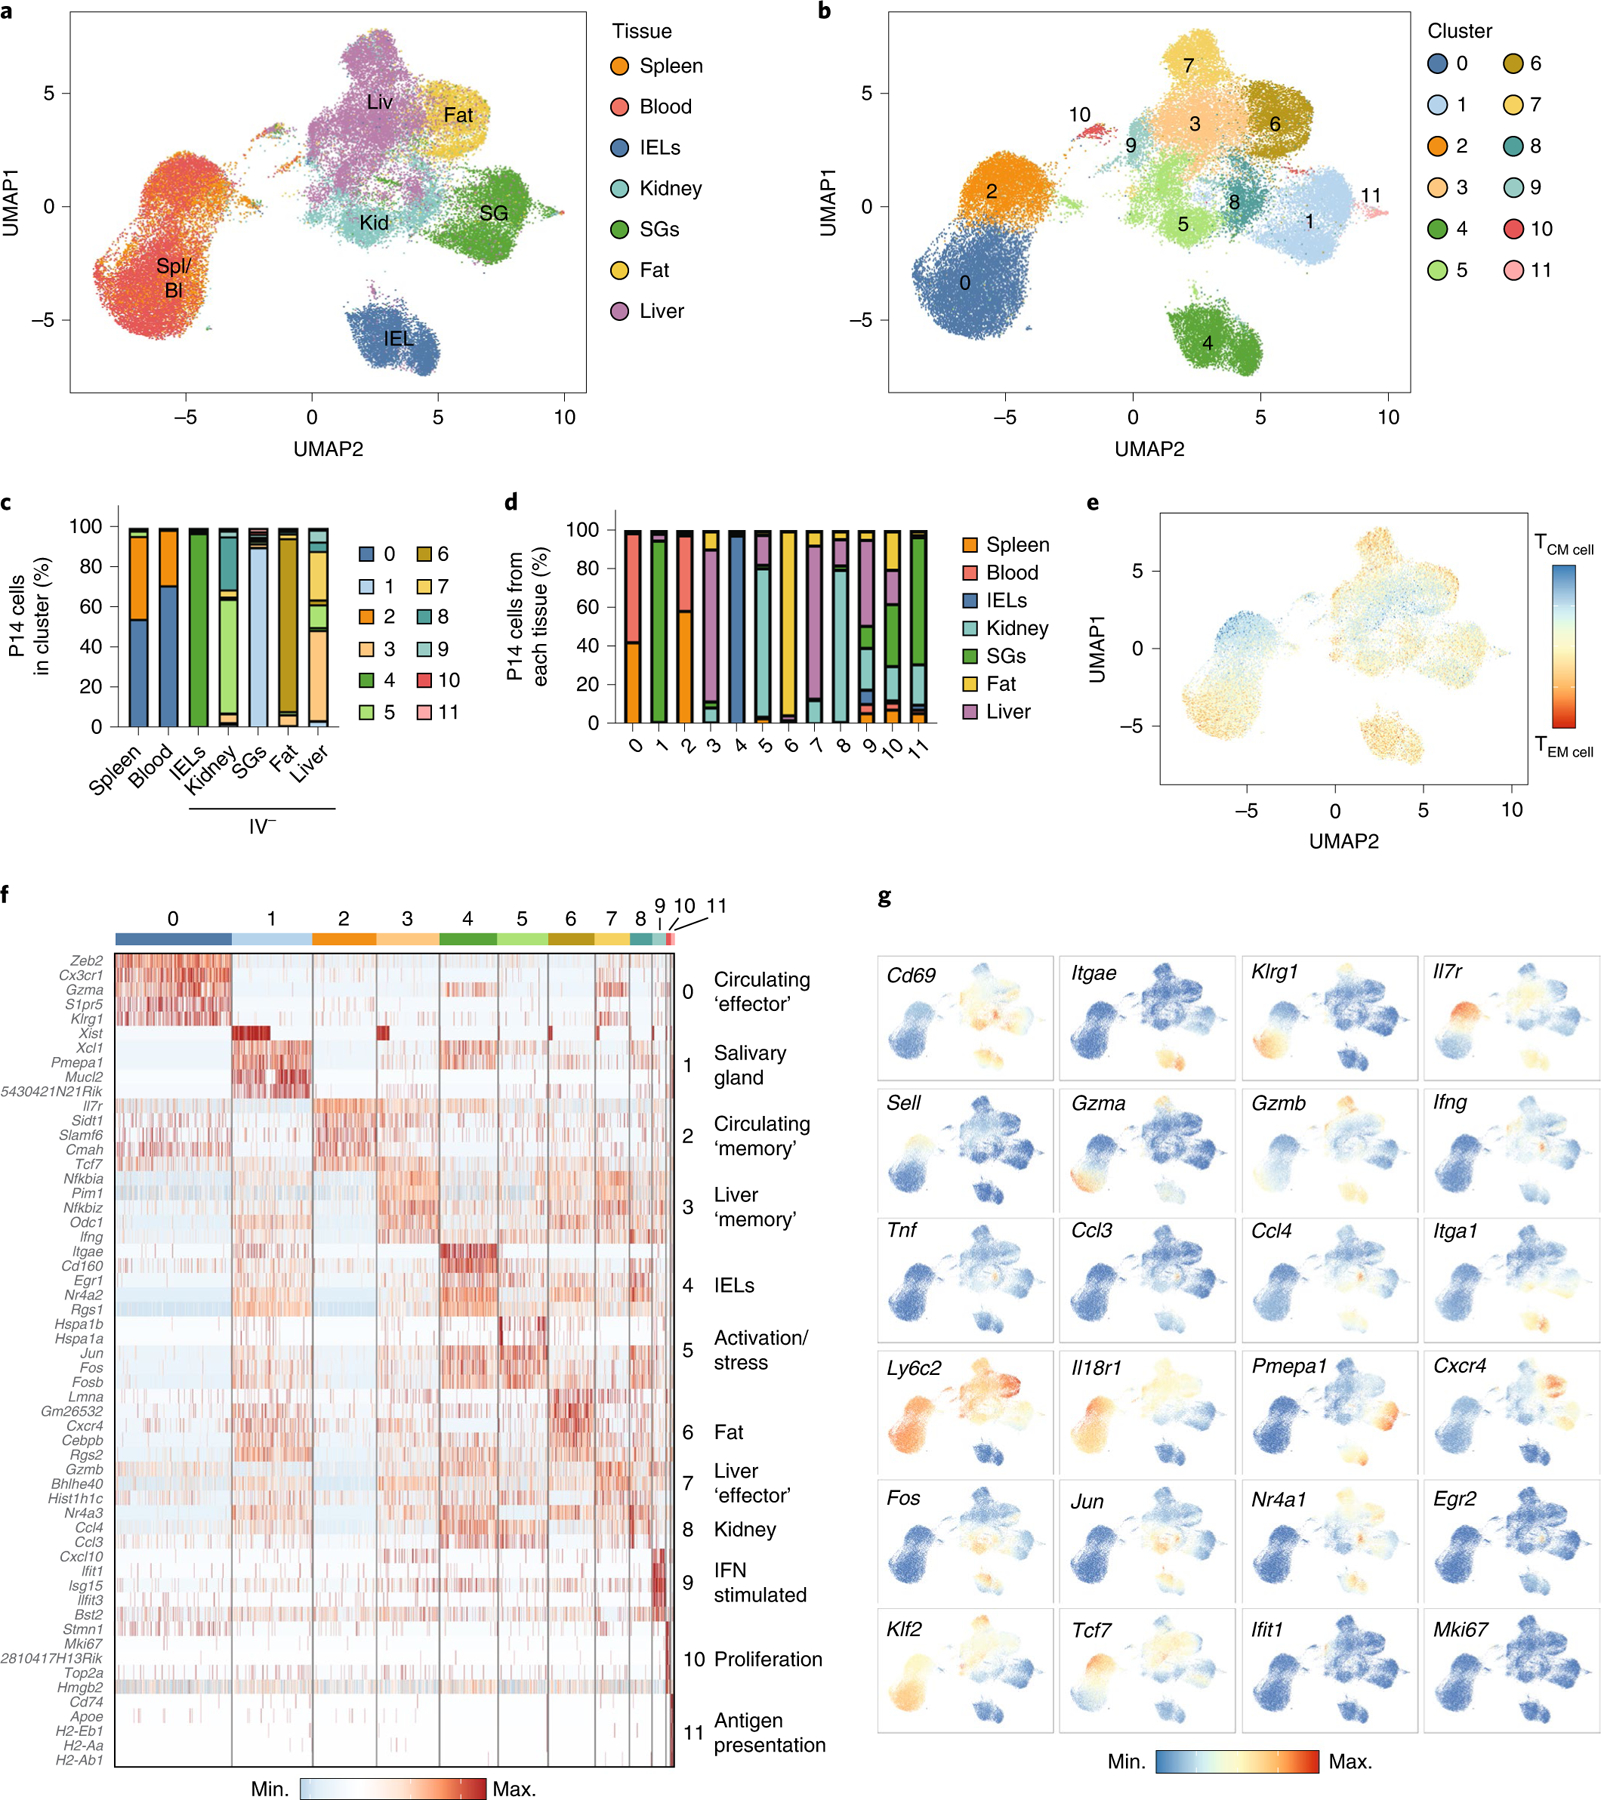
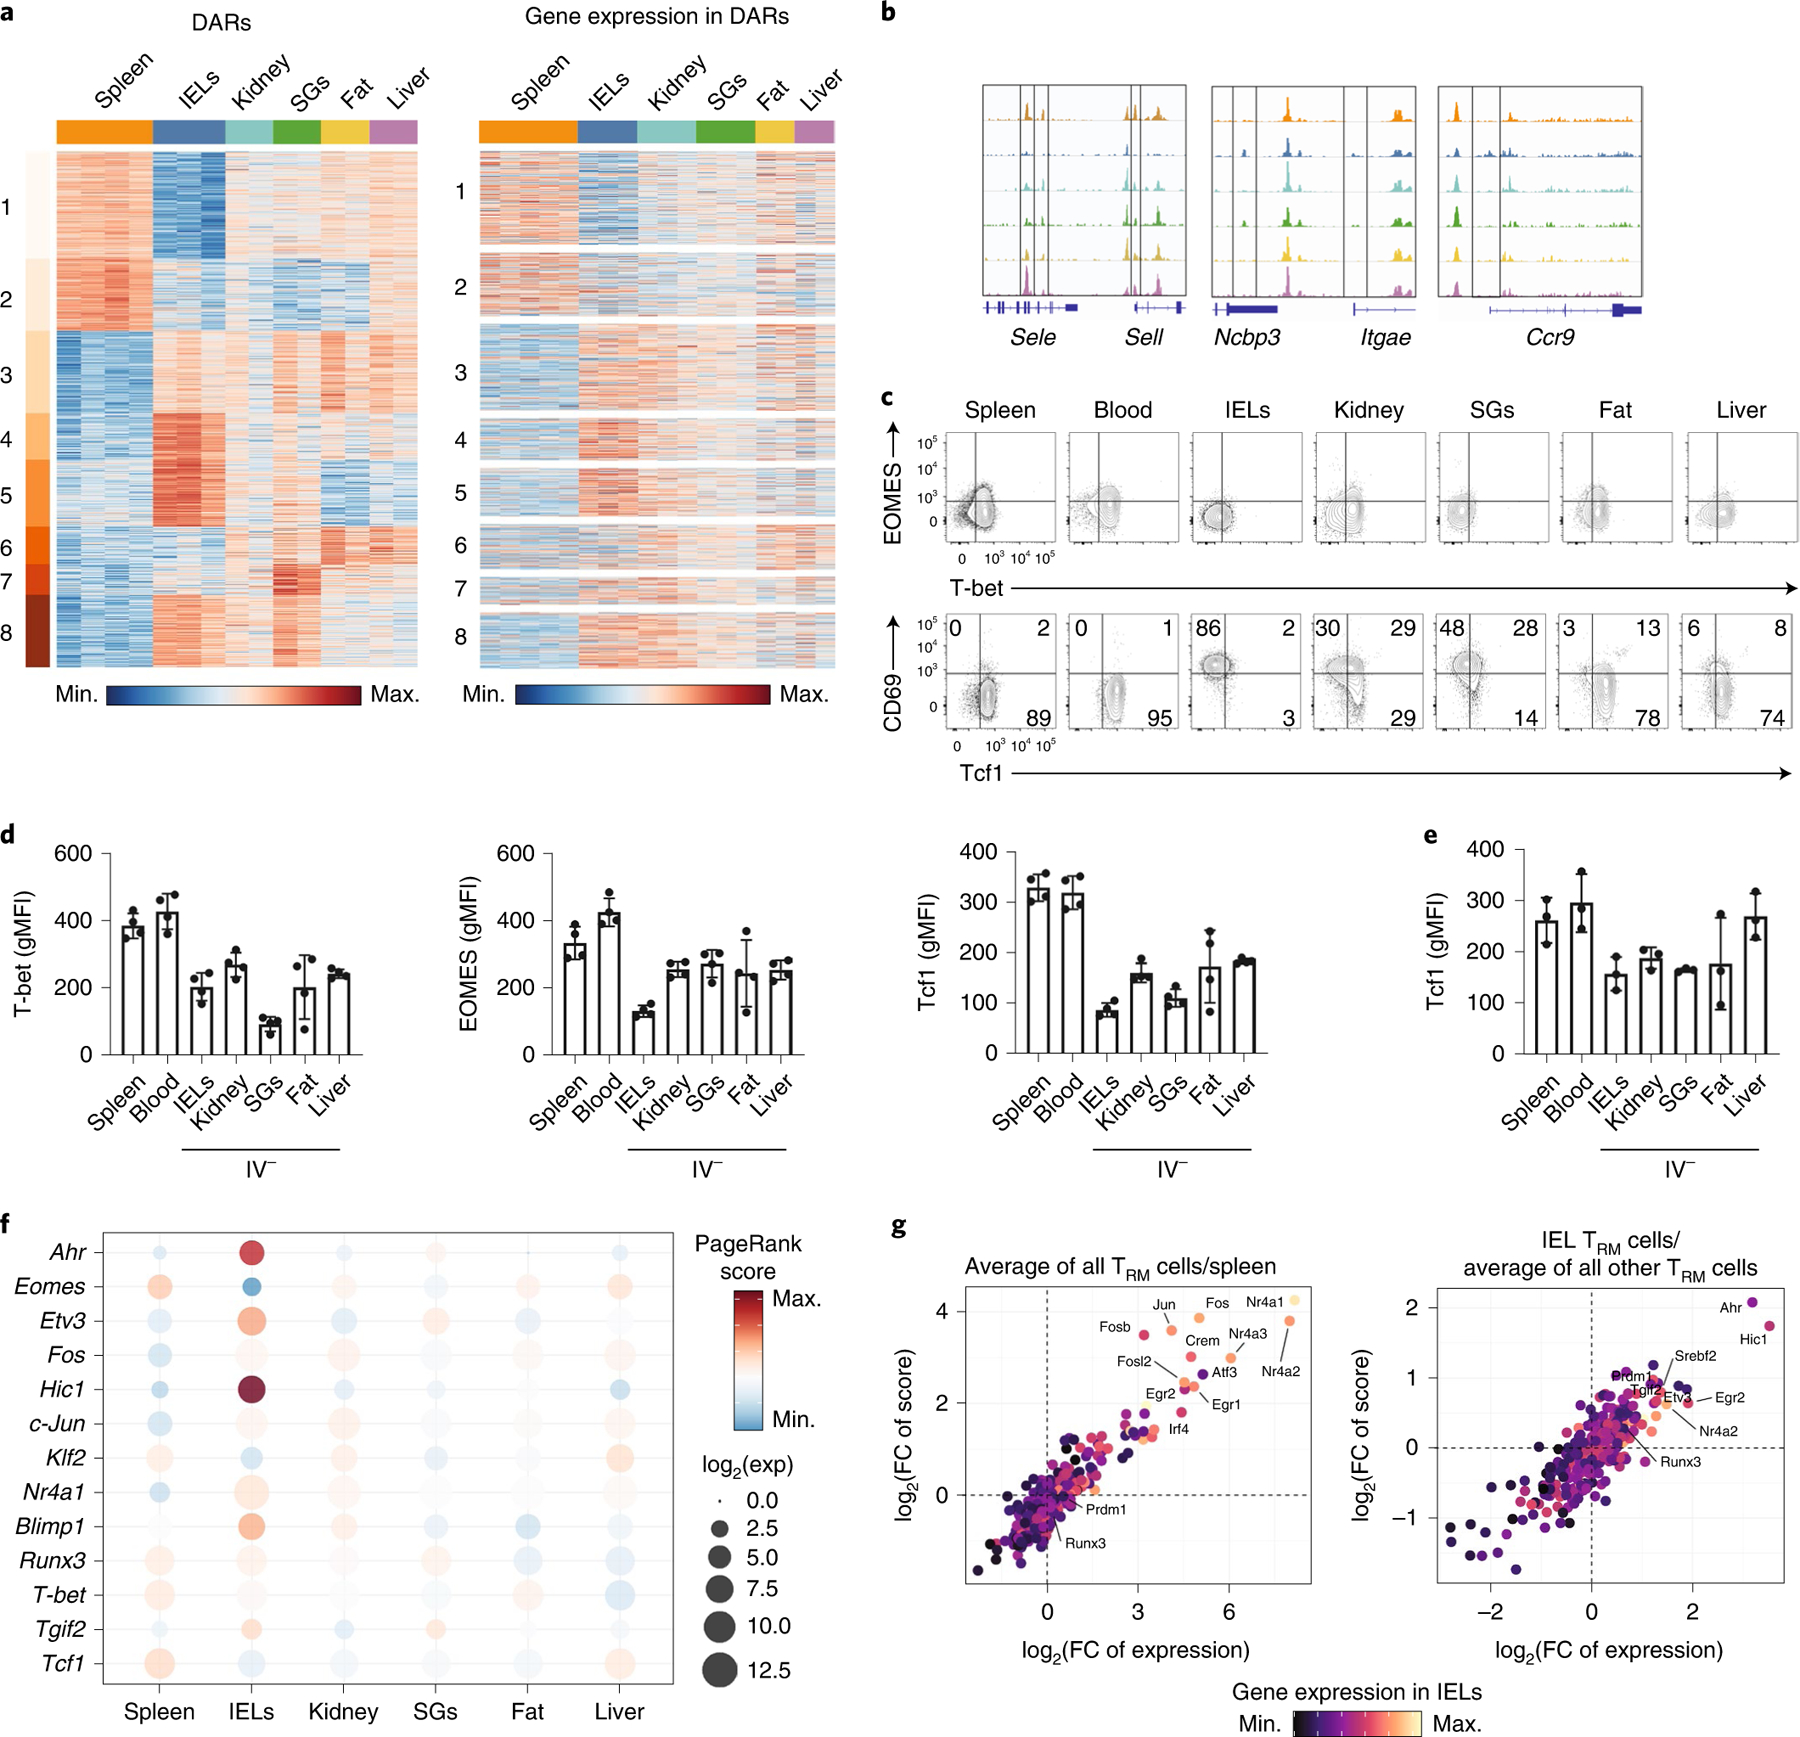
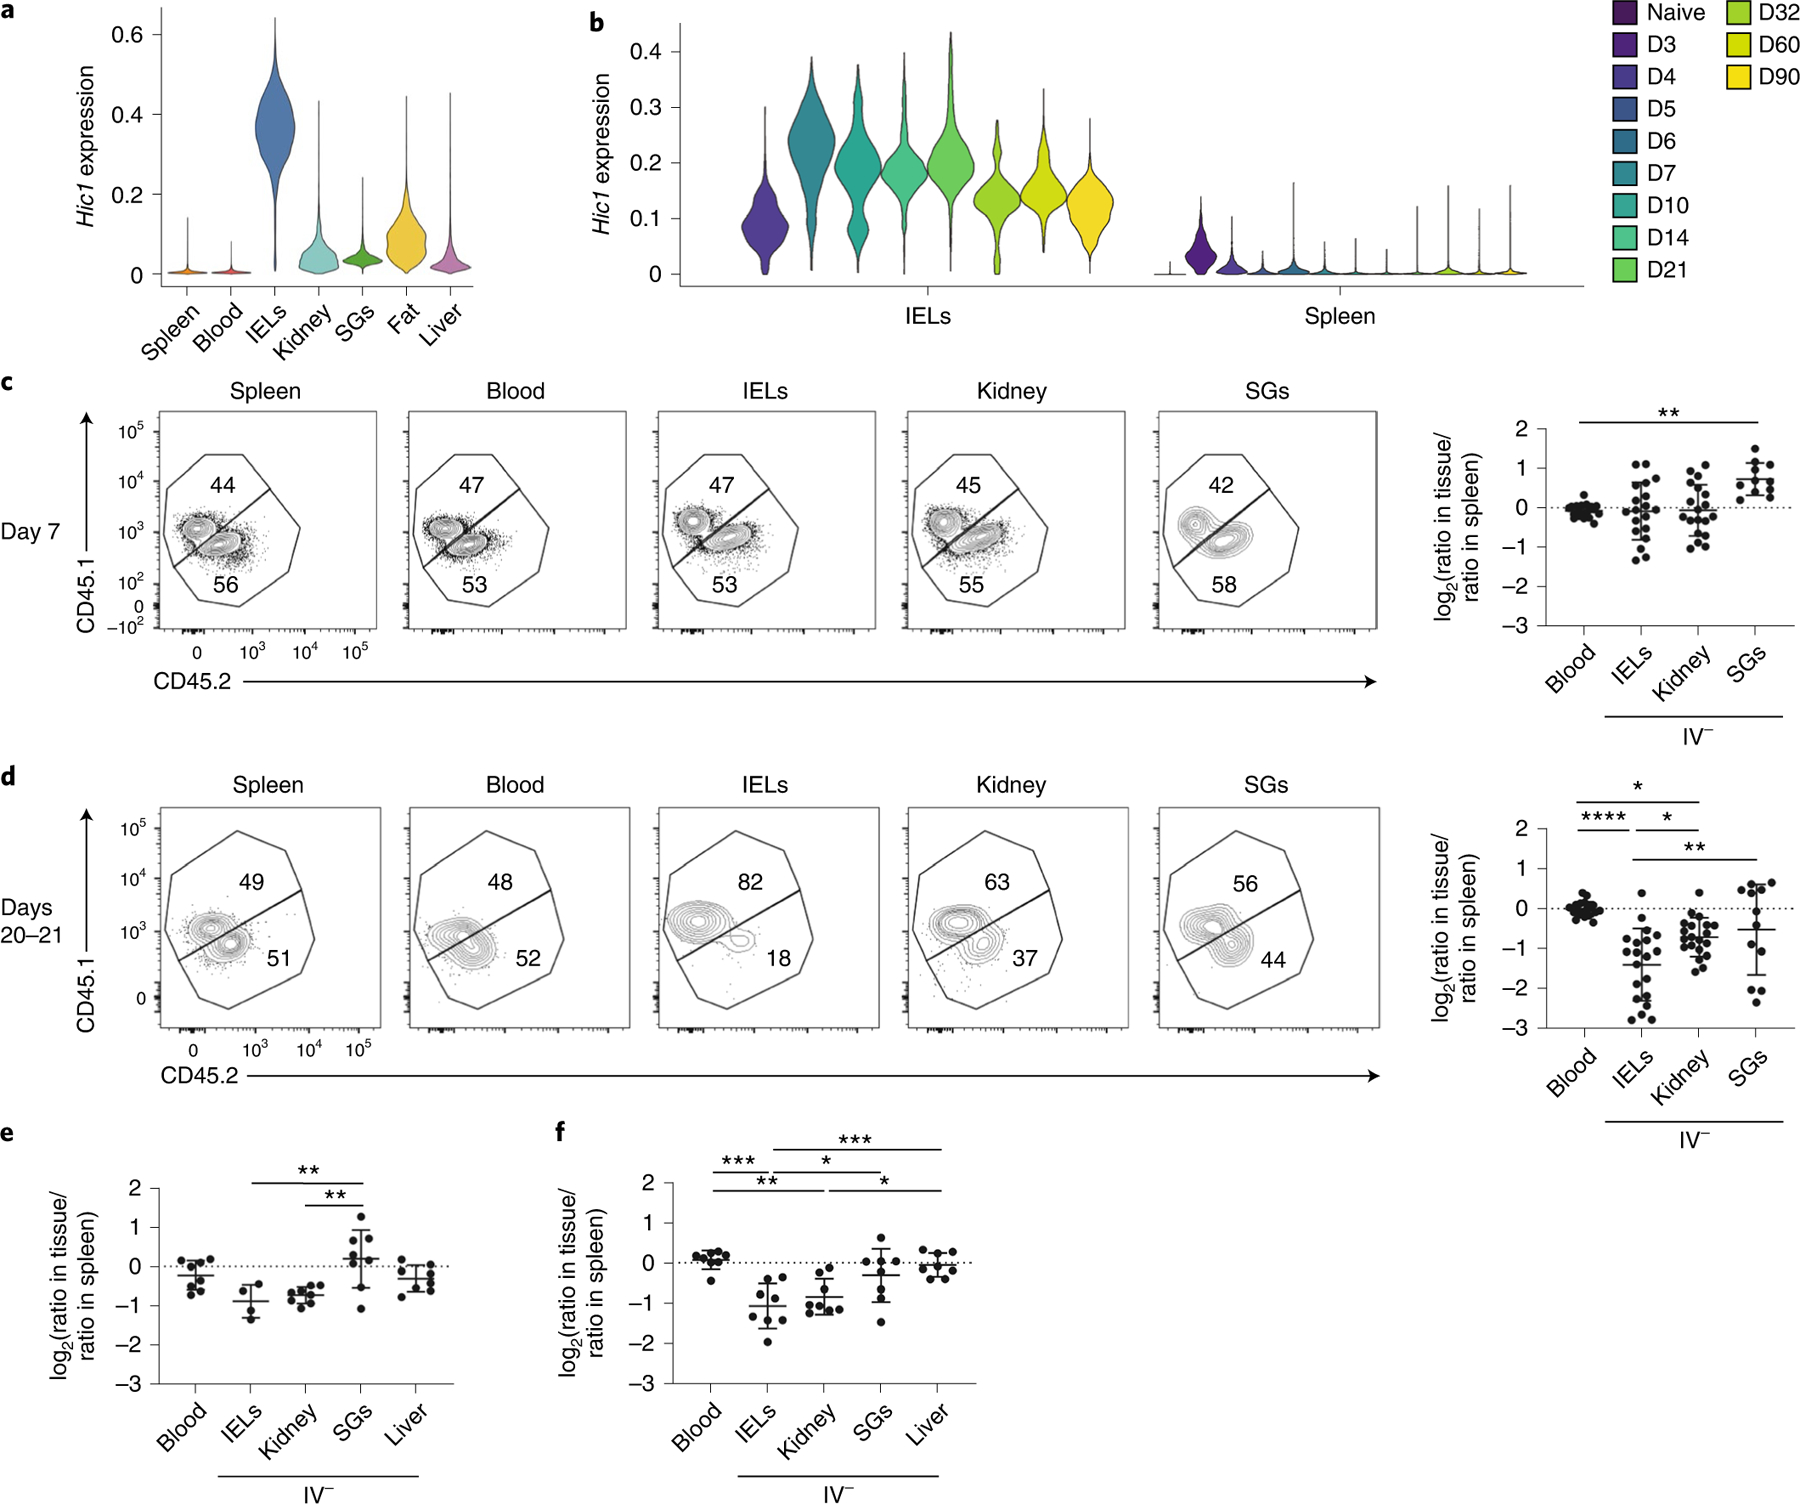
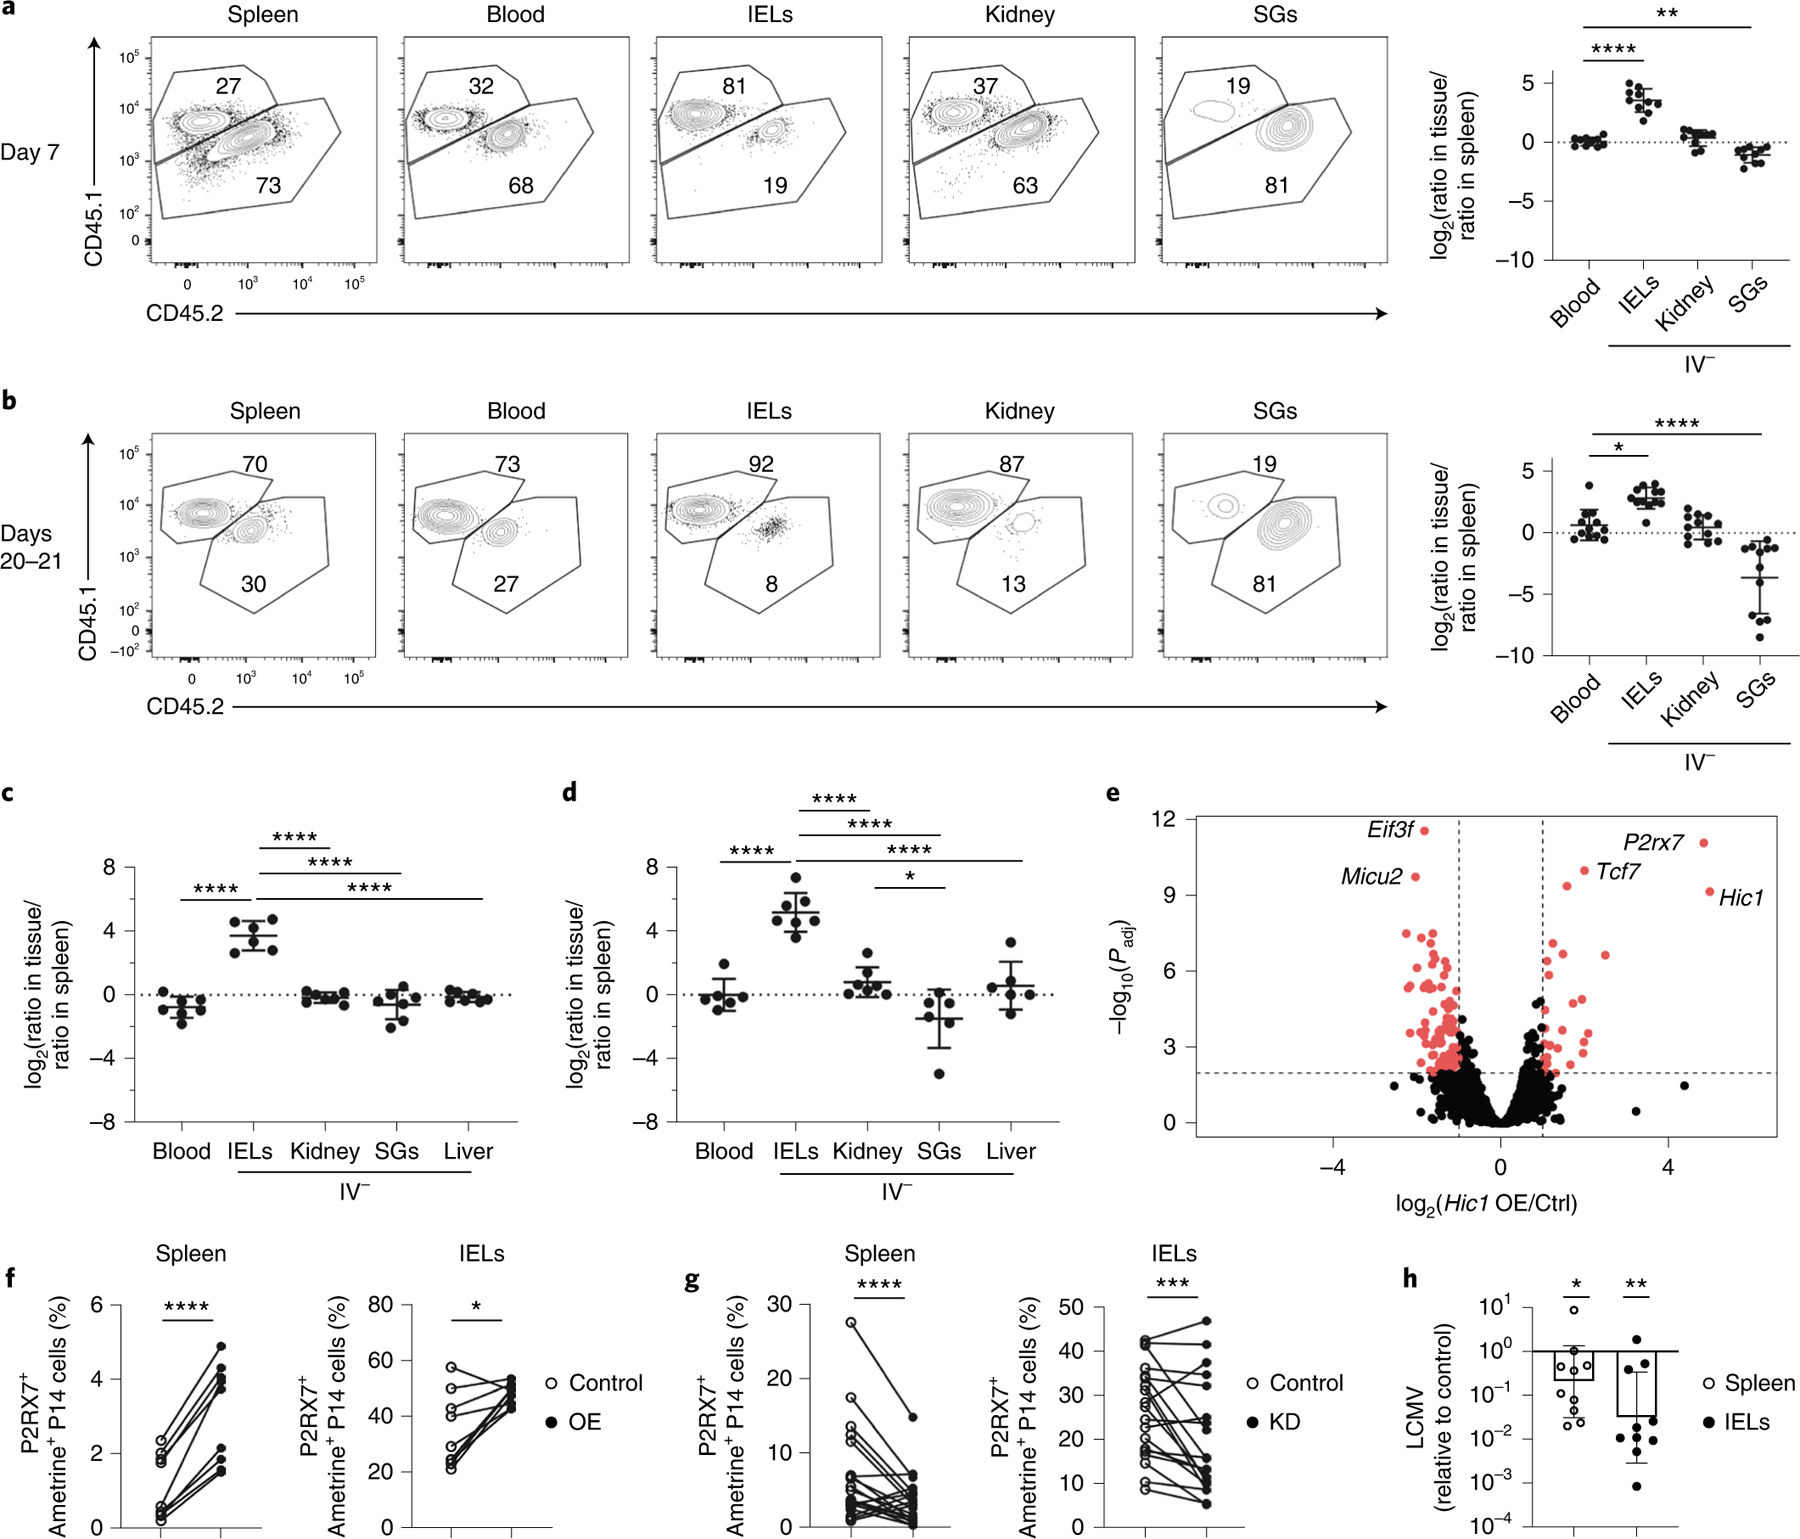
Tissue-resident memory T cells (TRM cells) provide protective immunity, but the contributions of specific tissue environments to TRM cell differentiation and homeostasis are not well understood. In the present study, the diversity of gene expression and genome accessibility by mouse CD8+ TRM cells from distinct organs that responded to viral infection revealed both shared and tissue-specific transcriptional and epigenetic signatures. TRM cells in the intestine and salivary glands expressed transforming growth factor (TGF)-β-induced genes and were maintained by ongoing TGF-β signaling, whereas those in the fat, kidney and liver were not. Constructing transcriptional-regulatory networks identified the transcriptional repressor Hic1 as a critical regulator of TRM cell differentiation in the small intestine and showed that Hic1 overexpression enhanced TRM cell differentiation and protection from infection. Provision of a framework for understanding how CD8+ TRM cells adapt to distinct tissue environments, and identification of tissue-specific transcriptional regulators mediating these adaptations, inform strategies to boost protective memory responses at sites most vulnerable to infection.


Conflict of interest statement

Competing interests

A.W.G. is a member of the ArsenalBio scientific advisory board. J.T. Crowl is a current employee of Outpace Bio. The remaining authors declare no competing interests.

Figures

Extended Data Fig. 1 |
Extended Data Fig. 1 |. Gating strategy.
a, Gating strategy used to identify indicated IV TRM populations.
Extended Data Fig. 2 |
Extended Data Fig. 2 |. Phenotypic characterization of TRM after LM-gp33 infection and expression of select genes in TRM from other published datasets.
a-b, CD69 and CD103 expression by CD8+ TRM isolated from tissues 30–40 days after infection with LM-GP33. Representative flow cytometry plots (a) and quantification (b). c-d, Percent of GZMA+ (c) and GZMB+ (d) P14 cells isolated from the indicated tissues 30–40 days after infection with LM-GP33 as assessed by flow cytometry. Datasets are from (e) Mackay et al, Science 2016. (f) Han et al, Immunity 2017. (g) ex vivo PD1 and Lag3 expression in P14 cells isolated from the indicated tissues. Quantification of flow cytometry data in b, c and d displays the mean ± SD for 10 mice from 3 experimental replicates. Data in g shows a representative experiment with 3 mice from a total of 3 experiments with 10 mice. Significance was calculated using a one-way ANOVA and corrected for multiple comparisons using Tukey’s test. ****p < 0.0001.
Extended Data Fig. 3 |
Extended Data Fig. 3 |. Collagenase digestion induces upregulation of a subset of genes also associated with tissue residency.
a-d, P14 cells were adoptively transferred into CD45 congenic hosts one day prior to infection with LCMV. 30–40 days after initial infection, P14 cells were isolated from tissues using no additional treatment (NoTx), collagenase (Coll), or a cold active protease (CAP). a, Quantification of the number of P14 cells recovered from each tissue using the indicated digestion methods. b, Percent of P14 cells expressing CD69 (top left), CD103 (top center left), IL-18R1 (top center right), CD8a (top right), KLRG1 (bottom left), CD127 (bottom center), or CD62L (bottom right) assessed by flow cytometry. c-e, RNA-sequencing of P14 cells isolated from the spleen or kidney using NoTx, Coll, dithioerythritol (DTE), or CAP. c, Differentially expressed genes (348) were clustered with k-means = 3. Select genes in each cluster displayed on the right. Genes that were upregulated in CAP-treated tissues compared to CAP-treated spleens indicated with an asterisk. d, Principal Component Analysis. e, Cd69 expression by P14 cells isolated from the spleen or kidney with CAP. f,g, Genes included in the TRM signatures from this paper (left), Milner et al, Nature 2017 (center) and Mackay et al, Science 2016 (right) were selected. f, Corresponding expression values for collagenase-digested kidney, CAP-digested kidney, and CAP-digested spleen samples were plotted. Each gene in the corresponding TRM signature is represented by a single point and colored by influence of digestion on expression. g, Venn diagram of the preceding data. h, Principal component analysis of RNA-sequencing data from Fig. 1 with all digestion-associated genes removed. Genes were considered digestion-associated if they were expressed above a minimum threshold and at >1.5 fold in collagenase-digested kidney compared to CAP-digested kidney samples. Graphs in a and b display the mean ± SD for 10 mice from 3 experimental replicates. RNA-seq data displayed in c-f contains 2–3 experimental replicates for each sample, and tissues from multiple mice were pooled. Graph in e displays the mean ± SD. Significance calculated using a two-way ANOVA and correcting for multiple comparisons using Dunnett’s test. *p < 0.05, ***p < 0.001, ****p < 0.0001.
Extended Data Fig. 4 |
Extended Data Fig. 4 |. Top enriched genes identified in bulk RNA-sequencing of TRM are also found in scRNA-sequencing.
a, The top 5 genes enriched in bulk RNA-sequening samples for TRM isolated from the blood, IEL, SG, fat, and liver are shown on a UMAP dimensional reduction plot.
Extended Data Fig. 5 |
Extended Data Fig. 5 |. Removal of digestion-associated gene signature from the TRM gene signature does not alter the enrichment of tissue signature.
a,b, scRNA-sequencing data described in Fig. 2. Each cell was scored based on the enrichment of genes included in the indicated signatures. Cells were colored by score on a UMAP dimensional reduction (a) and separated by cluster and ordered based on score (b).
Extended Data Fig. 6 |
Extended Data Fig. 6 |. TRM differentiation programs are a source of intra-tissue heterogeneity.
a, UMAP dimensional reduction of scRNA-sequencing of TRM separated by tissue. Cells were colored by the expression of the indicated genes. Scales are consistent across tissues to allow for comparison within and among tissues. b-c, Expression of CD69, Ly6C, IL18R1 on P14 cells harvested 30–40 days after initial infection with LCMV. Representative flow cytometry plots (b) and quantification (c). d, Quantification of IL18R1 expression on P14 cells harvested from the indicated tissues 30–40 days after initial infection with LM-GP33. Quantification of flow cytometry data in c and d displays the mean ± SD for 6 (c) 10 (d) mice from 2 experimental replicates.
Extended Data Fig. 7 |
Extended Data Fig. 7 |. TRM in distinct tissue microenvironments possess unique epigenetic programs.
a-d, ATAC-seq of P14 CD8+ T cells in the spleen and IV P14 CD8+ T cells isolated from the IEL, kidney, SG, fat, and liver. a, Pearson correlation for all peaks across all samples. b, Annotation of the genomic region type for all identified accessible regions (left) and DAR (right). c,d, Shared and unique upregulated DAR (c) and downregulated DAR (d) in each tissue compared to the spleen for all DAR with a p-value <0.05 and a fold change >4 using a Wald statistics.
Extended Data Fig. 8 |
Extended Data Fig. 8 |. Blimp1 deletion impairs TRM formation in the IEL and SG more than the kidney.
a-c, Gzmb-Cre/Prdm1fl/fl (WT) and Gzmb-Cre+/Prdm1fl/fl (KO) were transferred at a 1:1 ratio into congenically distinct recipients one day prior to infection with LCMV. Tissues were harvested 60 days after initial infection. a, Ratio of KO to WT P14 cells in the indicated tissues. b-c, % of CD69+ (b) and CD103+ (c) P14 cells for WT and KO populations. Graphs display mean ± SD for a combined 2 experimental replicates, each with m = 4 mice. Significance in (a) calculated with a one-way ANOVA using Tukey’s multiple comparison test. Significance in (b-c) calculated with a two-way ANOVA using with Sidak’s multiple comparison test. ****p < 0.0001.
Extended Data Fig. 9 |
Extended Data Fig. 9 |. Hic1 is critical for the differentiation of small intestine TRM.
a, Hic1 expression by resident immune cell populations isolated from the indicated tissues. b-g, 1:1 mixed transfer of P14 cells transduced with a control shRNA or a Hic1-targeting shRNA. b-c, Percentage of P14 cells that are CD69+CD103 (left) or CD69+CD103+ (right) on day 7–8 (b) or day 20–21 post-infection with LCMV (c). d, Percentage of P14 cells that are CD69+CD103 (left) or CD69+CD103+ (right) on day 20 post-infection with LM-GP33. e, Percentage of P14 cells that were terminal effectors (TE, KLRG1+CD127) or memory precursors (MP, KLRG1CD127+) on day 7–8 post-infection with LCMV. f, Percentage of P14 cells that are terminal effector memory (tTEM, CD127-CD62L-), effector memory (TEM, CD127+CD62L-), or central memory (TCM, CD127+CD62L+) on day 20–21 post-infection with LCMV. g-h, Percentage of P14 cells that were TE or MP on day 7 (g) or day 20 (h) after infection with LM-GP33. i-l, 1:1 mixed transfer of P14 cells transduced with a control vector or a Hic1-overexpression vector. i-j, Percentage of P14 cells that are CD69+CD103 (left) or CD69+CD103+ (right) on day 7–8 (i) or day 20–21 (j) post-infection with LCMV. k, Percentage of P14 cells that were TE or MP on day 7–8 post-infection with LCMV l, Percentage of P14 cells that were tTEM, TEM, or TCM on day 20–21 post-infection with LCMV. m, P2xr7 expression by resident immune cell populations isolated from the indicated tissues. Graphs in a and m display mean ± SD for the expression values from RNA-Seq samples (22 samples for CD8+, 17 samples for CD4+, 18 samples for Macrophages, 26 samples for ILC2). Graphs in b, c, e, f, il display mean ± SD for 11 mice from 3 experimental replicates. Graphs in d, g, and h display mean ± SD for 8 mice from 2 individual experiments. Significance calculated with a two-way ANOVA using with Sidak’s multiple comparison test. *p < 0.05, **p < 0.01, ***p < 0.001, ****p < 0.0001.
Extended Data Fig. 10 |
Extended Data Fig. 10 |. Human TRM recapitulate phenotypes observed in murine TRM.
a-c, Single-cell RNA-sequencing of healthy human tissue in Boland et al, Science Immunology 2020. a, Hic1 expression after MAGIC imputation. b,c, Individual cells are scored based on enrichment for genes included in the TGFβ signature (b) and TRM signature (c). Single cell data was pooled from 13 different healthy donors for PBMC and rectum biopsies and 10 healthy donors for intestinal samples. Boxplot shows median. The lower and upper hinges correspond to the first and third quartiles. The upper whisker extends from the hinge to the largest value no further than 1.5 * IQR from the hinge. Statistics were calculated by aggregating the scRNA data to pseudo-bulk samples for each patient and cell type. A T statistics test as implemented in the R package limma was then used to calculate the P values.
Fig. 1 |
Fig. 1 |. TRM cells in distinct tissue microenvironments possess unique transcriptional programs.
a,b, Representative flow cytometry plots (a) and quantification (b) of CD69 and CD103 expression in CD8+ TRM cells isolated from IEL, kidney, SG, fat and liver. c, PCA analysis of RNA-seq of CD8+ TRM cells isolated from IEL, kidney, SG, fat and liver, as well as memory CD8+ cells from spleen and blood. Two to three experimental replicates were used per sequenced tissue sample, generated by pooling tissues from multiple mice. d, Heatmap of 2,820 DEGs from RNA-seq dataset in c, clustered with k-means = 8. Enriched gene sets are indicated on the right. EGF, Epidermal growth factor; N/A, not available. e, The log2(expression) values for select genes previously associated with circulating or tissue-resident CD8+ T cells from the RNA-seq dataset in c. f, The log2(expression) values for select genes associated with activation/exhaustion (left), cytokine receptors (center) and migration/retention (right) from the RNA-seq dataset in c. gj, Percentage of GZMA+ (g), GZMB+ (h), CCR9+ (i) and CXCR4+ (j) P14 cells isolated from the indicated tissues as assessed by flow cytometry. Quantification of flow cytometry data in b and gj displays the mean ± s.d. for 12 (b), 11 (g and h) or 10 (i and j) mice from 3 experimental replicates. The significance was calculated using a one-way ANOVA and corrected for multiple comparisons using Tukey’s test. ****P < 0.0001.
Fig. 2 |
Fig. 2 |. ScRNA-seq identifies distinct tissue and function-specific transcriptional programs in TRM cells.
a,b, UMAP dimensional reduction colored by tissue (a) and cluster (b) of scRNA-seq of circulating and resident P14 cells isolated from the indicated tissues harvested 32 d after initial infection with LCMV. c, Percentage of P14 cells assigned to each cluster for each tissue for the scRNA-seq dataset in a. d, Percentage of P14 cells from each tissue in each cluster. e, UMAP dimensional reduction showing the difference in the TCM cell or TEM cell gene score for each cell. f, Heatmap showing the top five genes from each cluster. g, UMAP dimensional reduction colored by gene expression. The sequenced cells comprising each tissue in this dataset were derived from at least three experimental replicates and comprise pooled tissue samples from multiple mice.
Fig. 3 |
Fig. 3 |. Sustained TGF-β signaling is required for the maintenance of TRM cells in IEL and SG.
a,b, Violin plot showing TGF-β signature score by tissue in scRNA-seq analysis of resident and circulating P14 cells from Fig. 2 (a) and UMAP dimensional reduction colored by TGF-β score (main) and tissue (inset) (b). c,d, Representative flow cytometry plots (WT CD45.1, TGFβR2 KO CD45.1.2) (c) and quantification (d) comparing relative numbers of WT and TGFβR2 KO P14 cells. e,f, Representative flow cytometry plots (e) and quantification (f) comparing CD69 and CD103 expression in WT and TGFβR2 KO P14 cells. Quantification of flow cytometry data in d and f displays the mean ± s.d. for ten mice, three experimental replicates for all tissues. The boxplot in a shows the median. The lower and upper hinges correspond to the first and third quartiles, and the upper whisker extends from the hinge to the largest value no further than 1.5 × interquartile range from the hinge. The significance in d is calculated with a one-way ANOVA and corrected for multiple comparisons using Tukey’s test. The significance in f is calculated using a two-way ANOVA and corrected for multiple comparison’s using Sidak’s multiple comparison test. NS, not significant. ****P < 0.0001. *P < 0.05.
Fig. 4 |
Fig. 4 |. TRM cells in distinct tissue microenvironments possess unique epigenetic programs.
a, Heatmap showing 7,150 DARs clustered with k-means = 8 (left) from ATAC-seq of P14 cells in the spleen and IV P14 cells isolated from the IEL, kidney, SG, fat and liver, and gene expression for the gene nearest to each DAR (right). Only DEGs are shown. Each sequenced tissue possesses two to four experimental replicates, generated by pooling tissues from multiple mice. b, ATAC tracks of DARs from select genes. c,d, T-bet, EOMES and Tcf1 expression assessed in P14 cells isolated from mice 30–40 d after initial infection with LCMV. Flow cytometry plots (c) and quantification (d) from one representative experiment out of three total experiments with a total of eleven mice. gMFI, geometric mean of median fluorescence intensity. e, Tcf1 expression assessed in P14 cells isolated from mice 30–34 d after initial infection with LM-GP33. Quantification is from one representative experiment out of three experiments with a total of ten mice. f, PageRank score and gene expression for select TFs displayed by individual tissues. g, Average PageRank score and gene expression of transcription factors displayed as the average in all TRM cells over P14 cells in the spleen (left) PageRank score and gene expression in IEL TRM cells over the average of all other TRM cells (right). FC, fold-change.
Fig. 5 |
Fig. 5 |. Loss of Hic1 prevents the formation of SI TRM cells.
a, Violin plots displaying Hic1 expression after MAGIC imputation in scRNA-seq data from Fig. 2. b, Hic1 expression in scRNA-seq dataset from Kurd et al.7. The violin plot is colored by time after infection with LCMV. D, Day. cf, A 1:1 mixed transfer of P14 cells transduced with a control shRNA or a Hic1-targeting shRNA before infection with LCMV or LM-GP33. Representative flow cytometry plot (Ctrl CD45.1, Hic1 KD CD45.1.2) (left) and quantification (right) of the relative ratios between Hic1-targeting and control shRNAs are normalized to the spleen on days 7–8 (c) or 20–21 (d) after initial infection with LCMV. e,f, Quantification of the relative ratios between Hic1-targeting and control shRNAs normalized to the spleen on day 7 (e) or day 20 (f) after initial infection with LM-GP33. Graphs in c and d display the mean ± s.d. for 19 mice from 5 separate experiments for blood, spleen, IEL and kidney, and 11 mice from 3 experiments for SG. Graphs in e and f display the mean ± s.d. for eight mice from two separate experiments. The significance was calculated using a one-way ANOVA and corrected for multiple comparisons using Tukey’s test. *P < 0.05, **P < 0.01, ***P < 0.001, ****P < 0.0001.
Fig. 6 |
Fig. 6 |. Hic1 overexpression enhances the formation of SI TRM. cells.
a–d, A 1:1 mixed transfer of P14 cells transduced with a control or a Hic1-overexpression construct before infection with LCMV or LM-GP33. Representative flow cytometry plot (Ctrl CD45.1.2, Hic1 KD CD45.1) (left) and quantification (right) of the relative ratios between Hic1 and control-transduced P14 cells are normalized to the spleen on days 7–8 (a) or days 20–21 (b) after initial infection with LCMV. Quantification of the relative ratios between Hic1 and control-transduced P14 cells was normalized to the spleen on day 7 (c) or day 20 (d) after initial infection with LM-GP33. e, RNA-seq of control and Hic1-overexpressing P14 cells isolated from the spleen at day 7 post-infection with LCMV. f,g, Percentage of P2RX7+ametrine+ P14 cells isolated from the spleen (left) or IEL (right) in Hic1-overexpression at day 7 post-infection (f) and in Hic1 knockdown at day 7 post-infection (g). h, Bar plot showing LCMV expression in mice that received Hic1-overexpressing P14 cells normalized to mice receiving control P14 cells. LCMV titers were assessed by qPCR relative to HPRT. Graphs in a and b display the mean ± s.d. from 10 mice (a) and 12 mice (b) from 3 separate experiments. Graphs in c and d display the mean ± s.d. for six mice (c) and seven mice (d) from two separate experiments. Significance in ad was calculated using a one-way ANOVA and corrected for multiple comparisons using Tukey’s test. Graphs in f display three individual experiments with three mice each. Graphs in g display mean ± s.d. for 18 mice from 4 separate experiments. Significance in f and g was calculated using a two-sided, paired Student’s t-test and connecting lines indicate that the Ctrl and Hic1 KD/OE cells were isolated from the same mouse. The graph in h displays the geometric mean ± s.d. from two different experiments with five mice each. The significance was calculated using an unpaired, two-sided Student’s t-test. *P < 0.05, **P < 0.01, ***P < 0.001, ****P < 0.0001.

Comment in

References

    1. Steinert EM et al. Quantifying memory CD8 T cells reveals regionalization of immunosurveillance. Cell 161, 737–749 (2015). - PMC - PubMed
    1. Skon CN et al. Transcriptional downregulation of S1pr1 is required for the establishment of resident memory CD8+ T cells. Nat. Immunol 14, 1285–1293 (2013). - PMC - PubMed
    1. Gebhardt T et al. Memory T cells in nonlymphoid tissue that provide enhanced local immunity during infection with herpes simplex virus. Nat. Immunol 10, 524–530 (2009). - PubMed
    1. Masopust D & Soerens AG Tissue-resident T cells and other resident leukocytes. Annu. Rev. Immunol 37, 521–546 (2019). - PMC - PubMed
    1. Milner JJ et al. Runx3 programs CD8+ T cell residency in non-lymphoid tissues and tumours. Nature 552, 253–257 (2017). - PMC - PubMed

Publication types

Substances