. 2022 Jun 27;22(1):708.
doi: 10.1186/s12885-022-09807-7.

PIK3R3, a regulatory subunit of PI3K, modulates ovarian cancer stem cells and ovarian cancer development and progression by integrative analysis

Affiliations

PIK3R3, a regulatory subunit of PI3K, modulates ovarian cancer stem cells and ovarian cancer development and progression by integrative analysis

Eun Jung Sohn. BMC Cancer. .

Abstract

Background: Ovarian cancer is the most lethal gynecologic disease and is one of the most commonly diagnosed cancers among women worldwide. The phosphatidylinositol 3-kinase (PI3K) family plays an important regulatory role in various cancer signaling pathways, including those involved in ovarian cancer development; however, its exact function remains to be fully understood. We conducted this study to understand the role of P13K in the molecular mechanisms underlying ovarian cancer development.

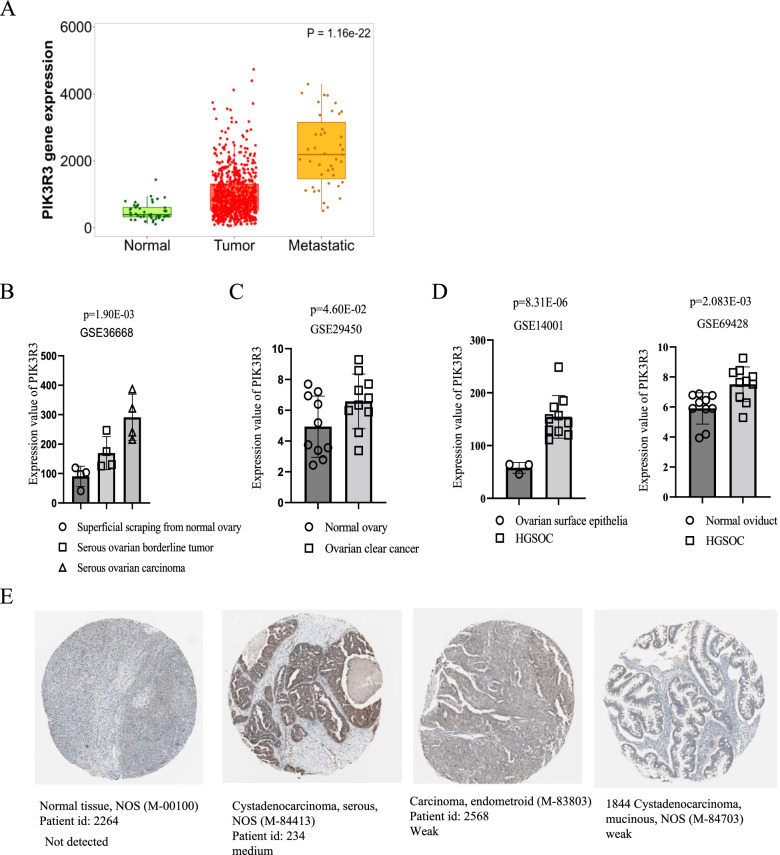
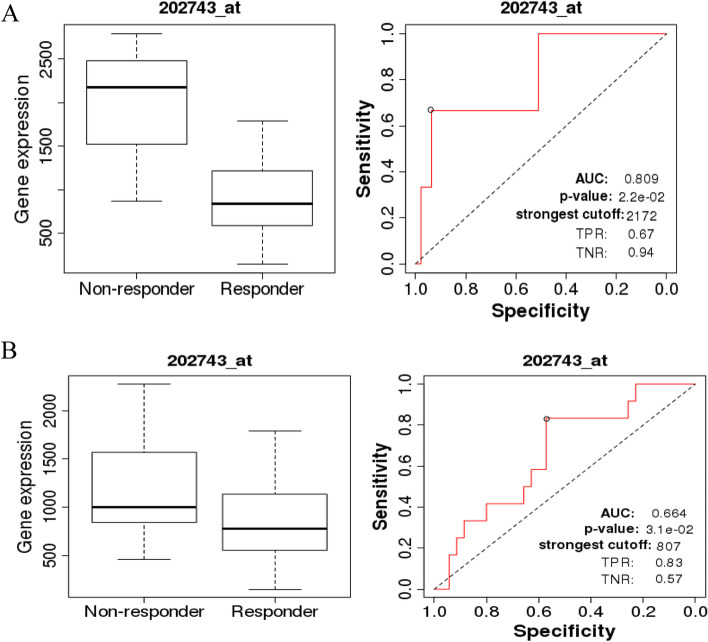
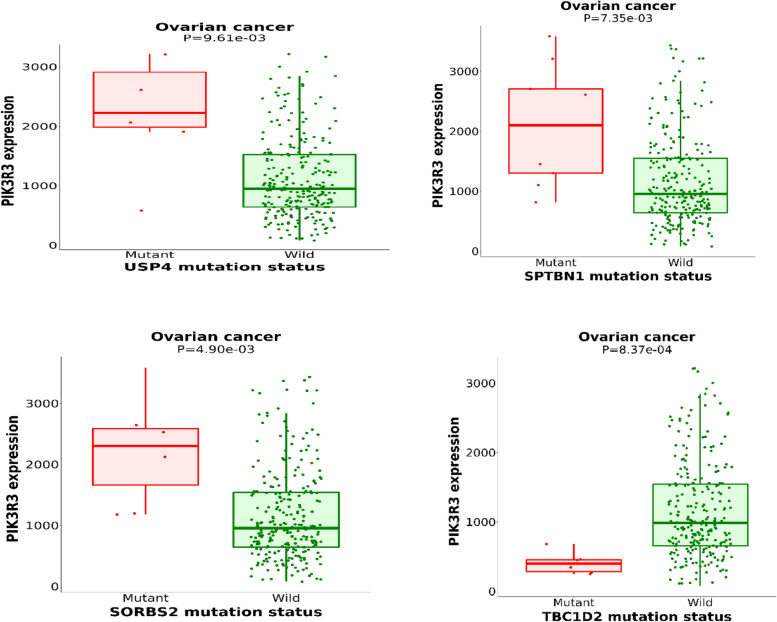
Methods: To determine the differential gene expression of phosphoinositide-3-kinase regulatory subunit 3 (PIK3R3), a regulatory subunit of PI3K, in normal, tumor, and metastatic ovary tissues, TNM plotter analysis was performed. The microarray dataset GSE53759 was downloaded from Gene Expression Omnibus. ROC plotter analysis was conducted to understand the potential of PIK3R3 as a predictive marker for effectiveness of therapy in ovarian cancer. muTarget was used to identify mutations that alter PIK3R3 expression in ovarian cancer. To determine the interacting partners for PIK3R3 in ovarian tissues, the interactome-atlas tool was used. The Kyoto encyclopedia of genes and genomes (KEGG) analysis was conducted to identify the pathways in which these interacting partners were primarily enriched.

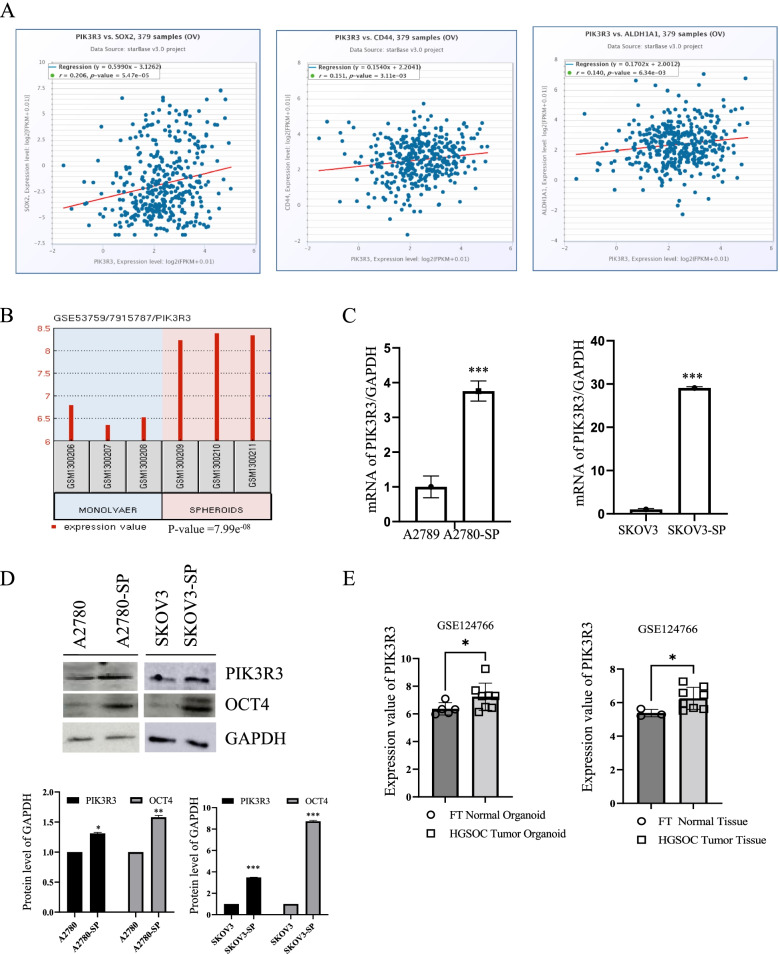
Results: PIK3R3 was overexpressed in ovarian and metastatic tumors. Elevated PIK3R3 levels were observed in ovarian cancer stem cells, wherein inhibiting PIK3R3 expression significantly reduced the size of ovarian cancer spheroids. Treatment of ovarian cancer stem cells with PF-04691502 (10 μM), an inhibitor of both PI3K and mTOR kinases, also reduced the size of spheroids and the level of OCT4. PIK3R3 was highly expressed in ovarian cancer with several somatic mutations and was predicted better outcomes in patients undergoing Avastin® chemotherapy using bioinformatic tool. Protein interaction analysis showed that PIK3R3 interacts with 157 genes, including GRB2, EGFR, ERBB3, PTK2, HCK, IGF1R, YES1, and PIK3CA, in the ovary. KEGG enrichment analysis revealed that the interacting partners of PIK3R3 are involved in the ErbB signaling pathway, proteoglycans in cancer, FoxO, prolactin, chemokine, and insulin signaling pathways.

Conclusions: PIK3R3 plays a pivotal role in ovarian cancer development and is therefore a potential candidate for developing novel therapeutic approaches.

Keywords: Cancer stem cells; Ovarian cancer; Phosphatidylinositol 3-kinase; Phosphoinositide-3-kinase regulatory subunit 3.


Conflict of interest statement

The authors declare that they have no competing interests.

Figures

Fig. 1
Fig. 1
Differential transcript and protein expression of PIK3R3 in ovarian cancer. A PIK3R3 transcript expression is significantly upregulated in tumors and metastatic tissues relative to normal tissues. PIK3R3 expression obtained from the GSE36668 (B) and GSE29450 (C) dataset that contains information on serous ovarian carcinoma and ovarian clear cancer. D PIK3R3 expression level obtained from GSE14001 and GSE69428 datasets which contain information on HGSOC. E PIK3R3 protein expression in normal and ovarian cancer tissues. Courtesy of all immunohistochemical images: Human Protein Atlas, https://www.proteinatlas.org
Fig. 2
Fig. 2
Receiver operating characteristic (ROC) curve of PIK3R3 in ovarian cancer patients. A ROC curves and boxplots of PIK3R3 in ovarian cancer patients undergoing Avastin® treatment for relapse-free survival time of 6 months. B ROC curves and boxplots of PIK3R3 in ovarian cancer patients undergoing Avastin® treatment for pathological response. Area under curve (AUC); TNR true negative rate (TNR); true positive rate (TPR) (http://www.rocplot.org/, accessed on October 2021)
Fig. 3
Fig. 3
Association of PIK3R3 expression with somatic mutations in ovarian cancer. Somatic mutations in the four genes USP4, SPTBN1, SORBS2, and TBC1D2 are most strongly associated with alterations in PIK3R3 expression in ovarian cancer. TARGET was used to determine somatic mutations in genes that significantly altered PIK3R3 expression in ovarian cancer tissues. (https://www.mutarget.com/, accessed on October 2021)
Fig. 4
Fig. 4
PIK3R3 overexpression in ovarian cancer stem cells. A Correlation analysis between PIK3R3 expression and expression of cancer stem cell-related proteins, such as SOX2, CD44, and ALDH1A1, in ovarian cancer stem cells. The starBase database was used to determine the correlation between PIK3R3 and stem cell-related genes (SOX2, CD44, ALDH1A1). B PIK3R3 expression obtained from the GSE53759 dataset that contains information on monolayer and spheroid-derived cells from ovarian carcinoma IGROV-1 in triplicate. C RT-qPCR analysis of the mRNA levels of PIK3R3 obtained from ovarian cancer (A2780 and SKOV3) and spheroid-derived (A2780-SP and SKOV3-SP) cells (n = 3). Data are represented as the mean ± SD. ***P < 0.001 vs control. D Western blot analysis of protein expression levels of PIK3R3 obtained from ovarian cancer (A2780 and SKOV3) and spheroid-derived (A2780-SP and SKOV3-SP) cells. Lower panels represented densitometric quantification of the western blots. Data are presented as the mean ± SD from three independent experiments. *P < 0.05; **P < 0.01; ***P < 0.001. E The PIK3R3 expression level obtained from the GSE124766 dataset that contains information on HGSOC tumor organoids and tumor tissues compared to FT normal organoids and FT Normal tissues. Data are presented as the mean ± SD from three independent experiments. *P < 0.05
Fig. 5
Fig. 5
PIK3R3 is crucial for ovarian cancer spheroid-forming ability in vitro. A Reduction in the spheroid size of A2780-SP cells following siRNA-mediated PIK3R3 knockdown. On 3 and 5 days after siRNA transfection on A2780-SP cells, the photo was taken under EVOS 7500. B The mRNA expression of OCT4 from PIK3R3 siRNA treated A2780-SP cells. The lysate after 3 days after transfection with PIK3R3 siRNA was used for RT-qPCR to see the mRNA level of PIK3R3 and OCT4. Data are presented as the mean ± SD from three independent experiments. * **P < 0.01; ***P < 0.001. C Reduction in the spheroid size of A2780-SP and SKOV3-SP cells after PF-04691502 treatment. On 7 days from DMSO or PF-04691502 treated A2780-SP and SKOV3-SP, the morphology of sphere formation was taken under EVOS7500. Right panel showed the quantification of the sphere size (n ≥ 5). Data are presented as the mean ± SD from three independent experiments. **P < 0.01; ***P < 0.001. Scale bar = 200 nm. D The mRNA expression of OCT4 from A2780-SP and SKOV3-SP cells after PF-04691502 treatment. On 7 days from DMSO or PF-04691502 treated A2780-SP and SKOV3-SP, total lysate was used for RT-qPCR to see the mRNA level of OCT4. Data are presented as the mean ± SD from three independent experiments. ***P < 0.001. E The mRNA expression of PIK3R3 from OCT4 shRNA treated A2780 cells. The lysate after 3 days after transfection with OCT4 shRNA was used for RT-qPCR to see the mRNA level of PIK3R3 and OCT4. Data are presented as the mean ± SD from three independent experiments. **P < 0.01; ***P < 0.001
Fig. 6
Fig. 6
PIK3R3 interaction networks in ovarian tissues. A PIK3R3-interacting proteins in ovary determined using the interactome-atlas tool (www.interactome-atlas.org was accessed on 9 October 2021). B KEGG pathway enrichment analysis of PIK3R3 interacting protein partners. Kyoto encyclopedia of genes and genomes (KEGG) pathway enrichment analysis [27] was carreid out with PIK3R3 interacting genes

References

    1. Stewart C, Ralyea C, Lockwood S. Ovarian cancer: An Integrated review. Semin Oncol Nurs. 2019;35(2):151–156. doi: 10.1016/j.soncn.2019.02.001. - DOI - PubMed
    1. Soliman AA, Elzarkaa AA, Malik E. Epithelial ovarian cancer and cancer stem cells. Adv Exp Med Biol. 2021;1330:21–32. doi: 10.1007/978-3-030-73359-9_2. - DOI - PubMed
    1. Cho KR. Ovarian cancer update: lessons from morphology, molecules, and mice. Arch Pathol Lab Med. 2009;133(11):1775–1781. doi: 10.5858/133.11.1775. - DOI - PMC - PubMed
    1. Burges A, Schmalfeldt B. Ovarian cancer: diagnosis and treatment. Dtsch Arztebl Int. 2011;108(38):635–641. - PMC - PubMed
    1. Dyall S, Gayther SA, Dafou D. Cancer stem cells and epithelial ovarian cancer. J Oncol. 2010;2010:105269. doi: 10.1155/2010/105269. - DOI - PMC - PubMed

MeSH terms

Substances