. 2022 Jun 27;19(1):167.
doi: 10.1186/s12974-022-02508-9.

A tale of two transmitters: serotonin and histamine as in vivo biomarkers of chronic stress in mice

Affiliations

A tale of two transmitters: serotonin and histamine as in vivo biomarkers of chronic stress in mice

Melinda Hersey et al. J Neuroinflammation. .

Abstract

Background: Stress-induced mental illnesses (mediated by neuroinflammation) pose one of the world's most urgent public health challenges. A reliable in vivo chemical biomarker of stress would significantly improve the clinical communities' diagnostic and therapeutic approaches to illnesses, such as depression.

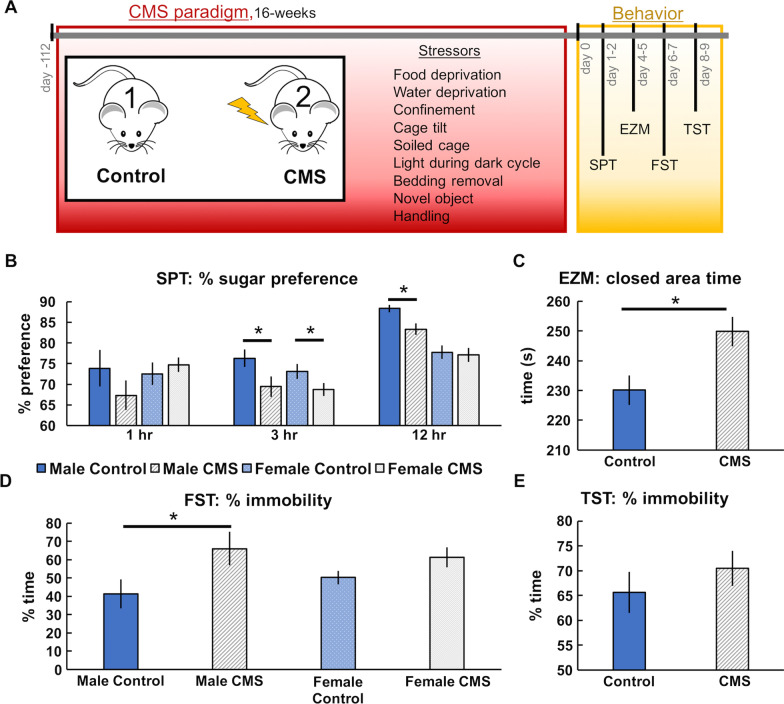
Methods: Male and female C57BL/6J mice underwent a chronic stress paradigm. We paired innovative in vivo serotonin and histamine voltammetric measurement technologies, behavioral testing, and cutting-edge mathematical methods to correlate chemistry to stress and behavior.

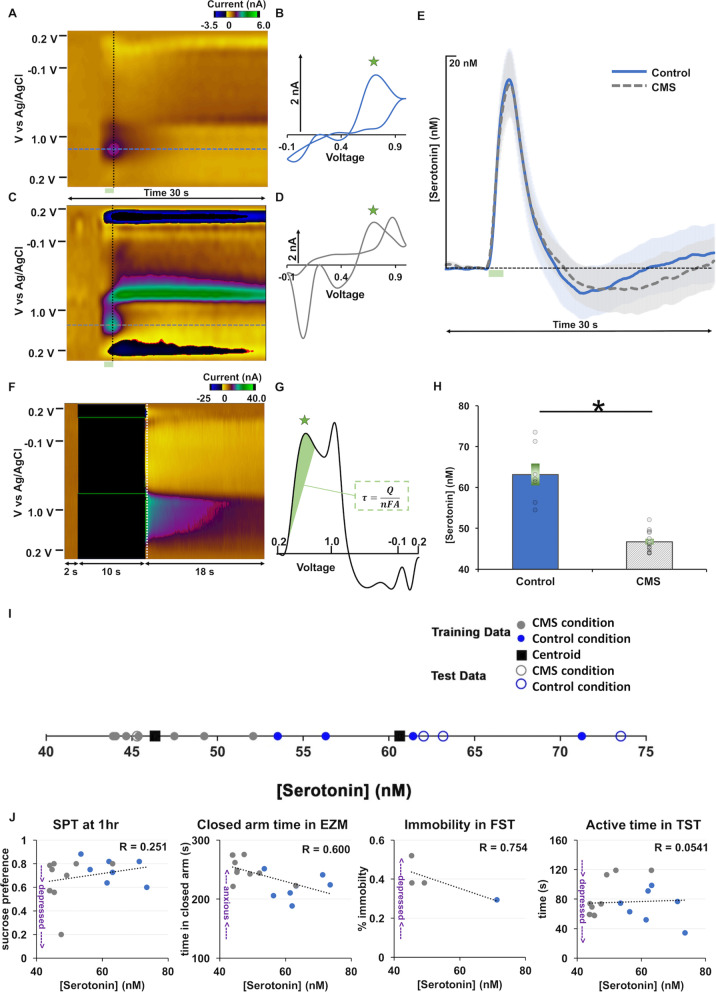
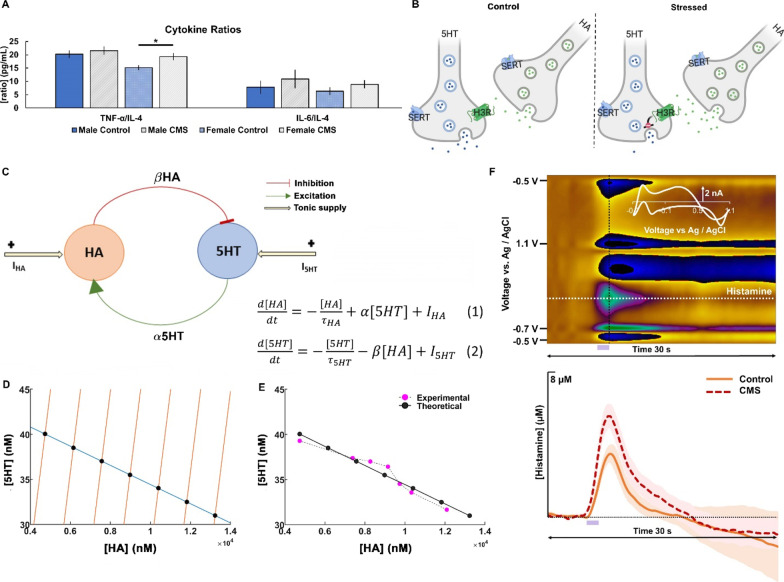
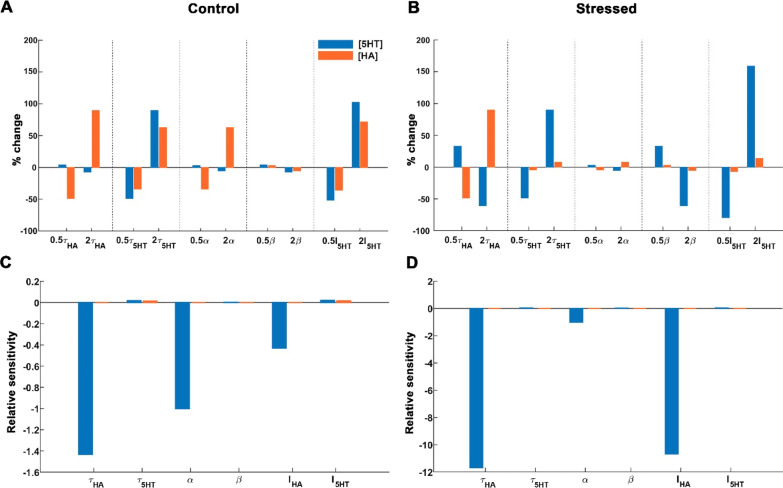
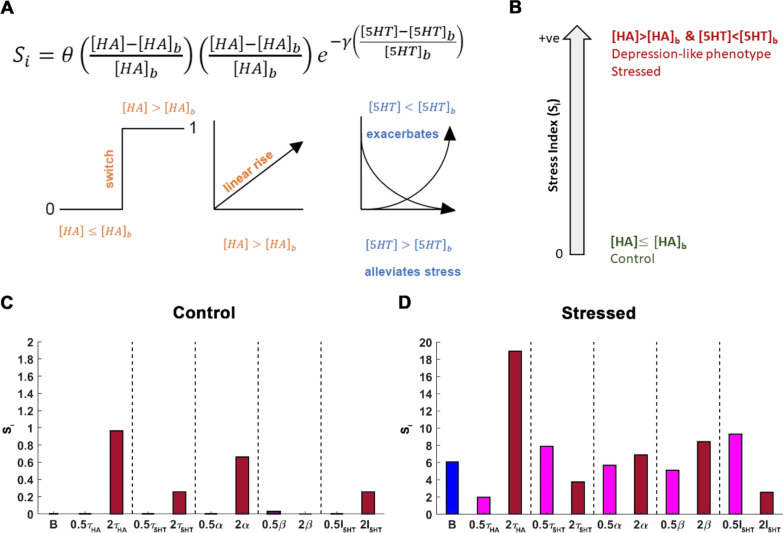
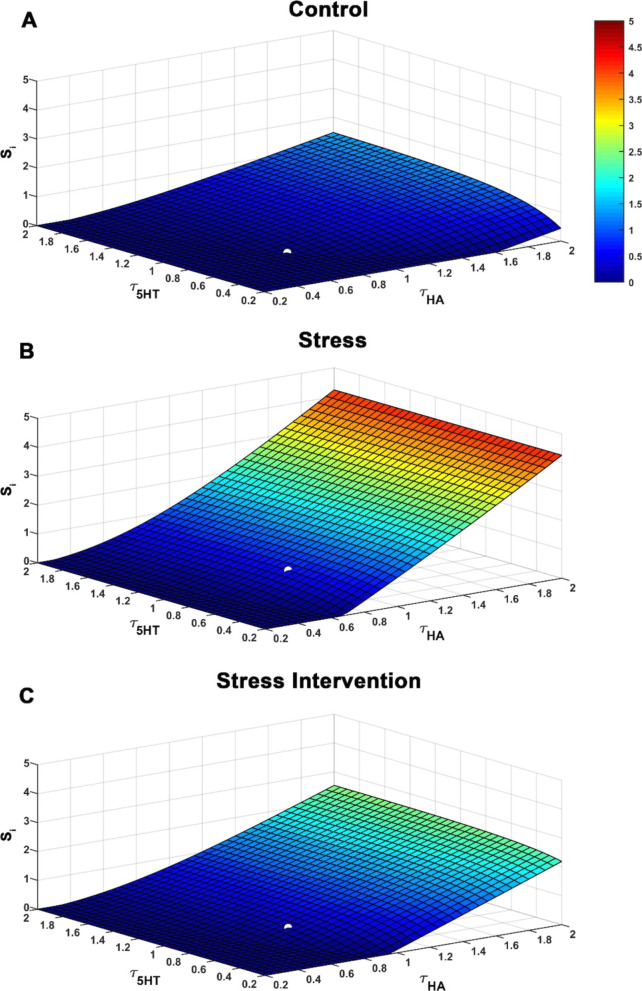
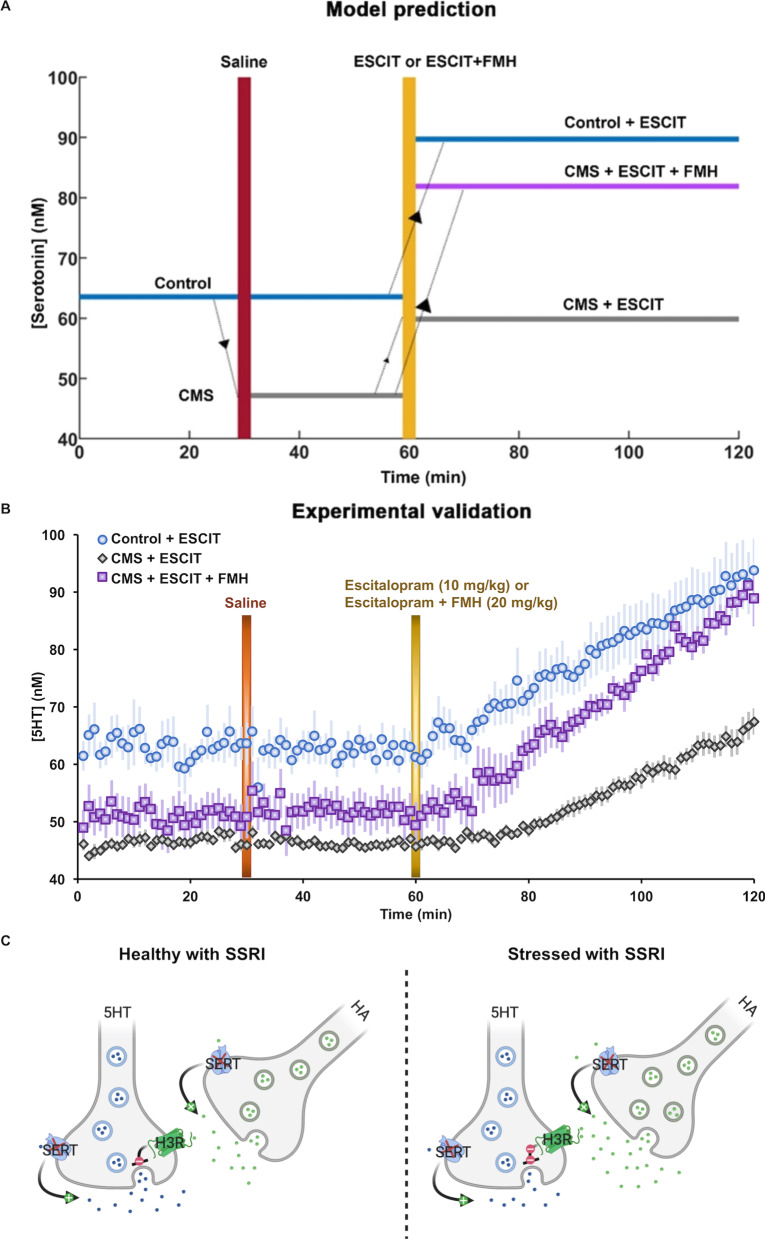
Results: Inflammation-induced increases in hypothalamic histamine were co-measured with decreased in vivo extracellular hippocampal serotonin in mice that underwent a chronic stress paradigm, regardless of behavioral phenotype. In animals with depression phenotypes, correlations were found between serotonin and the extent of behavioral indices of depression. We created a high accuracy algorithm that could predict whether animals had been exposed to stress or not based solely on the serotonin measurement. We next developed a model of serotonin and histamine modulation, which predicted that stress-induced neuroinflammation increases histaminergic activity, serving to inhibit serotonin. Finally, we created a mathematical index of stress, Si and predicted that during chronic stress, where Si is high, simultaneously increasing serotonin and decreasing histamine is the most effective chemical strategy to restoring serotonin to pre-stress levels. When we pursued this idea pharmacologically, our experiments were nearly identical to the model's predictions.

Conclusions: This work shines the light on two biomarkers of chronic stress, histamine and serotonin, and implies that both may be important in our future investigations of the pathology and treatment of inflammation-induced depression.

Keywords: Biomarkers; Depression; Histamine; Inflammation; Serotonin; Stress.


Conflict of interest statement

The authors declare that they have no competing interests.

Figures

Fig. 1
Fig. 1
Behavioral changes following CMS. A Schematic is shown for the 16-week CMS paradigm and the behavior studies that followed. B Average sucrose preference (sucrose water consumed—water consumed/total water consumed) in the SPT for non-stress control (blue; n = 40) and CMS (gray; n = 39) mice. C Average time spent in the closed sections of the EZM is shown for control (blue; n = 37) and CMS (gray; n = 36) mice (males and females were pooled). D Average percentage of time immobile in the FST for male (blue; n = 7) and female (light blue; n = 8) control mice and male (gray; n = 7) and female (light gray; n = 6) CMS mice. E Average percentage of time immobile in the TST is shown for control (blue; n = 37) and CMS (gray; n = 36) mice. Statistical significance (p < 0.05) is marked by an asterisk
Fig. 2
Fig. 2
Decreased extracellular serotonin marks chronic stress. A, C Example color plots from control and CMS mice, respectively. B, D Example cyclic voltammograms from control and CMS mice, respectively. E Evoked hippocampal serotonin concentration with time in control (blue; n = 10) and CMS (gray; n = 16) mice. F Example basal serotonin color plot. G Example basal serotonin cyclic voltammogram from which basal serotonin was calculated inset equation (τ = Surface Concentration, Q = Charge, n = Charge on the Molecule, F = Faraday Constant, and A = Surface Area). H Average basal serotonin in control (blue; n = 7) and CMS (gray; n = 13) mice are shown as bars and individual animals are denoted by circles. Error is shown as SEM and an asterisk denotes significance via t test (p < 0.05). I k-means clustering using extracellular serotonin to predict chronic stress (k = 2). Mice are clustered, based on basal hippocampal serotonin levels, into depressed and control. 80% data is used for training and 20% data is used for testing. J Serotonin concentration and sucrose preference at 1 h (n = 16), time spent in the closed arms of the EZM (n = 17), immobility in the FST (n = 4), and active time in the TST (n = 17). R = Pearson’s Correlation Coefficient
Fig. 3
Fig. 3
Dynamical interaction between histamine and serotonin with chronic stress. A Analysis of cytokine ratios (TNF-α/IL-4 and IL-6/IL4, respectively) for male (blue; n = 14) and female (light blue; n = 19) control mice and male (gray; n = 15) and female (light gray; n = 19) CMS mice. Significance was defined as p < 0.05 in a t test. B Schematic showing histaminergic regulation of serotonin via H3 heteroreceptors created with BioRender.com. C Schematic diagram and equations depicting the data-based possible interaction between histamine (HA) and serotonin (5HT), involved in stress-induced depression. D Nullcline plots of serotonin and histamine are obtained for the basal level of I5HT and different levels of IHA. The intersection points of the curves are the global equilibrium points of the system. E Experimental data (solid magenta circles) are obtained from Samaranayake et al. 2016. The theoretical data (solid black circles) have been procured from the nullcline analysis (r2 = 0.93). F Example color plot of histamine FSCV in the hypothalamus. Oxidation of HA can be observed at 0.2 V (green event). Stimulation is marked by a purple box at 5–7 s. Averaged evoked hippocampal HA release for control (orange; n = 6) and CMS-treated mice (red; n = 5) is shown
Fig. 4
Fig. 4
Histamine reuptake is most crucial for regulating stress-induced depression. Two states of the system have been studied AC healthy, control condition associated with basal value of IHA = 1250 nMs−1 and BD stressed condition associated with IHA = 2*104 nMs−1. The serotonin levels are shown in blue bars and the associated histamine levels in orange bars. A, B Percentage change obtained in the system’s state under parameter variation is shown with respect to the system’s state at basal values of the respective parameters. C, D Local sensitivity analysis has been performed to identify the parameters towards which the system is most sensitive and vulnerable. Relative sensitivity signifies the vulnerability of a variable towards parameter changes, regardless of the order of the magnitude of the variable as well as the parameter. The basal values of these parameters around which this analysis is performed are τHA = 0.8 s−1, τ5HT = 0.8 s−1, α = 69.7961 s−1, β = 0.0013 s−1, I5HT = 56.3250 nMs−1 and IHA = 1250 nMs−1 for the healthy condition and IHA = 2*104 nMs−1 for the stressed condition
Fig. 5
Fig. 5
Histamine reuptake critically shapes Stress Index (Si). A This equation describes Si. The first term is a Heaviside function that acts as a switch filtering the state of the system as either control or stress based on the histamine concentration. A value of zero is ascribed to this term when the histamine concentration equals the basal histamine level. Furthermore, the second term describes the impact histamine levels above the basal histamine value has on Si which is a linear rise. The last term describes the contribution of serotonin towards Si which either alleviates or exacerbates stress-induced behavior in an exponential manner. B Schematic illustration of the metric Si. Si is a positive scalar function that grades stress based on histamine and serotonin steady-state levels. A Si value of zero corresponds to controls and an increasing value of Si is associated with higher stress. In this model, Si associated with the maximum IHA = 2*104 nMs−1 corresponds to a high level of stress. Furthermore, the normal condition with IHA = 1250 nMs−1 corresponds to basal or lower histamine levels and the stressed condition is associated with heightened histamine levels and significant reduction in serotonin levels. C, D Variation in Si under a two-fold increase and decrease in the parameter of interest while keeping rest of the parameters fixed. Dark red (magenta) bars refer to a two-fold increase (decrease) in the parameter. The blue bar refers to Si for the basal condition i.e. when all the parameters are set to their basal value. C The Si values for normal conditions are shown. A Si of zero exists for basal values of the parameters, shown here in blue bar. It may also be noticed that spanning a parameter range doesn’t cause a significant change in Si. D Si values for the stressed condition are also shown. The basal values of the various parameters are τHA = 0.8 s−1, τ5HT = 0.8 s−1, α = 69.7961 s−1, β = 0.0013 s−1, I5HT = 56.3250 nMs−1 and IHA = 1250 nMs−1 for control and IHA = 2*104 nMs−1 for stress are obtained by fitting the model to the experimental data. Variation in histamine reuptake rate τHA causes the most significant change in Si
Fig. 6
Fig. 6
Administration of SSRIs elevates Stress Index. (A) SSRIs not only cause an increase in serotonin by blocking serotonin reuptake (the known convention) but also block histamine reuptake leading to a concomitant increase in histamine. This impact is realized in the present model through simultaneous increase in equilibrium histamine and serotonin levels reuptake rates, τHA and τ5HT, respectively, under (A) control, (B) stress, (C) ESCIT administration conditions. The stress intervention condition is associated with a two-fold decrease in tonic histamine supply, IHA which may be achieved through a histamine reducing drug. The white solid circle refers to Si for basal parameter values. The graded-color bar denotes the increase in stress index (from blue to red) due to changes in histamine and serotonin concentration. It is observed that blocking histamine leads to a reduced Si in C. Here, τHA = 0.8 s−1, τ5HT = 0.8 s−1, α = 398 s−1, β = 0.0013 s−1, I5HT = 118.75 nMs−1. IHA = 1.25*104 nMs−1 is considered for control condition (A), IHA = 3.88*104 nMs−1 for the stressed condition (B), and IHA = 1.94*104 nMs−1 for the stress intervention condition (C)
Fig. 7
Fig. 7
Pharmacologically targeting hippocampal histamine and serotonin concentrations to alleviate stress-induced changes in serotonin. A In the model, three representative mice population are considered: control mice administered the SSRI, ESCIT) (in blue), a serotonin elevating drug, chronic mild stress (CMS) mice given ESCIT (in gray) and CMS mice treated with ESCIT and histamine-synthesis blockers α-fluoromethylhistidine (FMH) (in purple). These representative mice population differ from one another based on their serotonin levels and treatment received. It must be noted that our model was studied at steady state. The time plotted here is just to show a more realistic comparison of our model predictions with the experiments conducted to test our observations. In the model ESCIT administration refers to a two-fold increase in τ5HT and 1.25-fold increase in τHA. Furthermore, FMH administration refers to a two-fold decrease in IHA. Here, τHA = 0.8 s−1, τ5HT = 0.8 s−1, α = 398 s−1, β = 0.0013 s−1, I5HT = 118.75 nMs−1 and IHA = 1.25*104 nMs−1 for healthy condition and IHA = 3.88*104 nMs−1 for the stressed condition. B In vivo data showing basal hippocampal serotonin in control mice given saline and then ESCIT (i.p., 10 mg kg−1, n = 7, in blue), CMS-treated mice given saline and then ESCIT (i.p., 0.2 mg kg−1, n = 8, in gray), and CMS-treated mice given saline and then ESCIT (i.p., 10 mg kg−1) and FMH (i.p., 20 mg kg−1, n = 5, in purple). C Modified histamine/serotonin schematic showing the influence of an SSRI on the system in control and chronic stress

Similar articles

Cited by

References

    1. Depression Fact Sheet. https://www.who.int/news-room/fact-sheets/detail/depression.
    1. James SL, Abate D, Abate KH, Abay SM, Abbafati C, Abbasi N, Abbastabar H, Abd-Allah F, Abdela J, Abdelalim A. Global, regional, and national incidence, prevalence, and years lived with disability for 354 diseases and injuries for 195 countries and territories, 1990–2017: a systematic analysis for the Global Burden of Disease Study 2017. Lancet. 2018;392:1789–1858. doi: 10.1016/S0140-6736(18)32279-7. - DOI - PMC - PubMed
    1. Salari N, Hosseinian-Far A, Jalali R, Vaisi-Raygani A, Rasoulpoor S, Mohammadi M, Rasoulpoor S, Khaledi-Paveh B. Prevalence of stress, anxiety, depression among the general population during the COVID-19 pandemic: a systematic review and meta-analysis. Glob Health. 2020;16:1–11. doi: 10.1186/s12992-019-0531-5. - DOI - PMC - PubMed
    1. Artigas F, Bortolozzi A, Celada P. Can we increase speed and efficacy of antidepressant treatments? Part I: general aspects and monoamine-based strategies. Eur Neuropsychopharmacol. 2018;28:445–456. doi: 10.1016/j.euroneuro.2017.10.032. - DOI - PubMed
    1. Belmaker RH, Agam G. Major depressive disorder. N Engl J Med. 2008;358:55–68. doi: 10.1056/NEJMra073096. - DOI - PubMed

LinkOut - more resources