. 2022 Jul;9(7):936-949.
doi: 10.1002/acn3.51569. Epub 2022 Jun 27.

Genetic prediction of impulse control disorders in Parkinson's disease

Affiliations

Genetic prediction of impulse control disorders in Parkinson's disease

Daniel Weintraub et al. Ann Clin Transl Neurol. 2022 Jul.

Abstract

Objective: To develop a clinico-genetic predictor of impulse control disorder (ICD) risk in Parkinson's disease (PD).

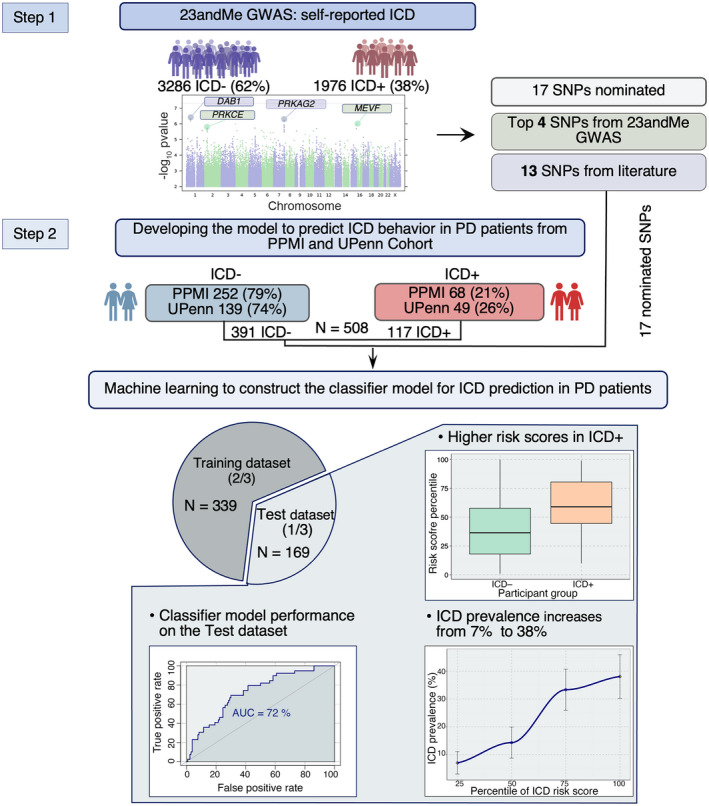
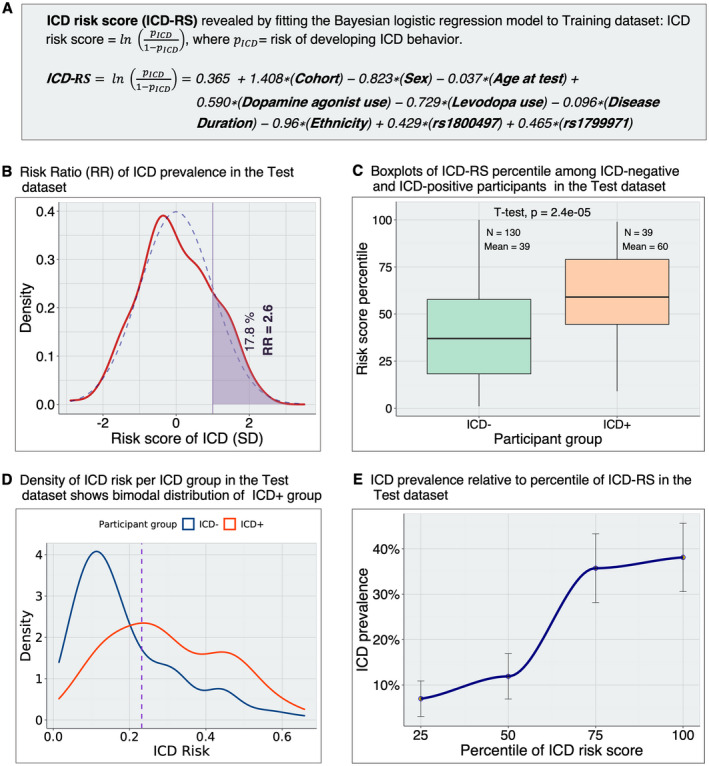
Methods: In 5770 individuals from three PD cohorts (the 23andMe, Inc.; the University of Pennsylvania [UPenn]; and the Parkinson's Progression Markers Initiative [PPMI]), we used a discovery-replication strategy to develop a clinico-genetic predictor for ICD risk. We first performed a Genomewide Association Study (GWAS) for ICDs anytime during PD in 5262 PD individuals from the 23andMe cohort. We then combined newly discovered ICD risk loci with 13 ICD risk loci previously reported in the literature to develop a model predicting ICD in a Training dataset (n = 339, from UPenn and PPMI cohorts). The model was tested in a non-overlapping Test dataset (n = 169, from UPenn and PPMI cohorts) and used to derive a continuous measure, the ICD-risk score (ICD-RS), enriching for PD individuals with ICD (ICD+ PD).

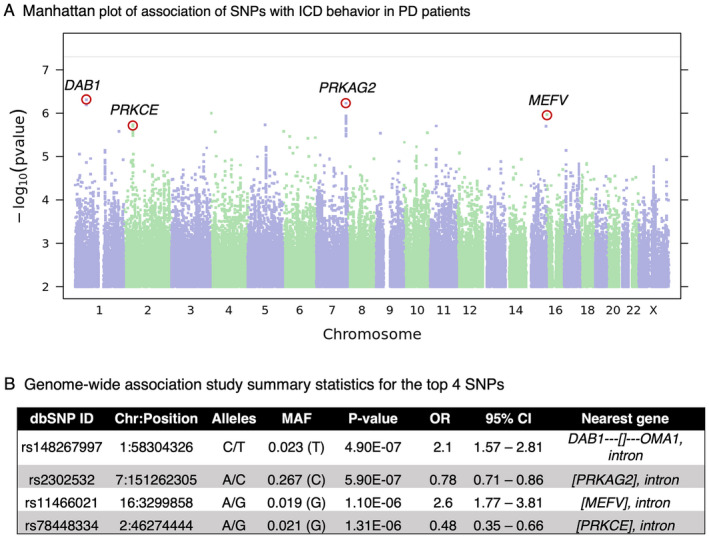
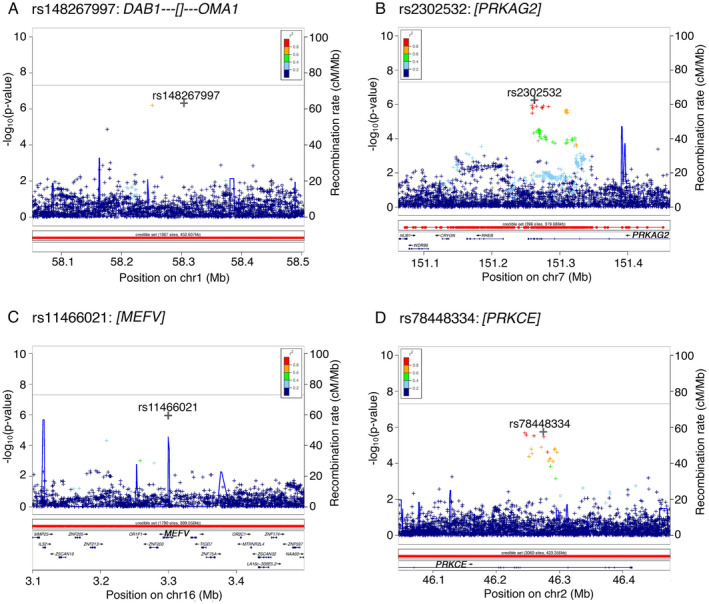
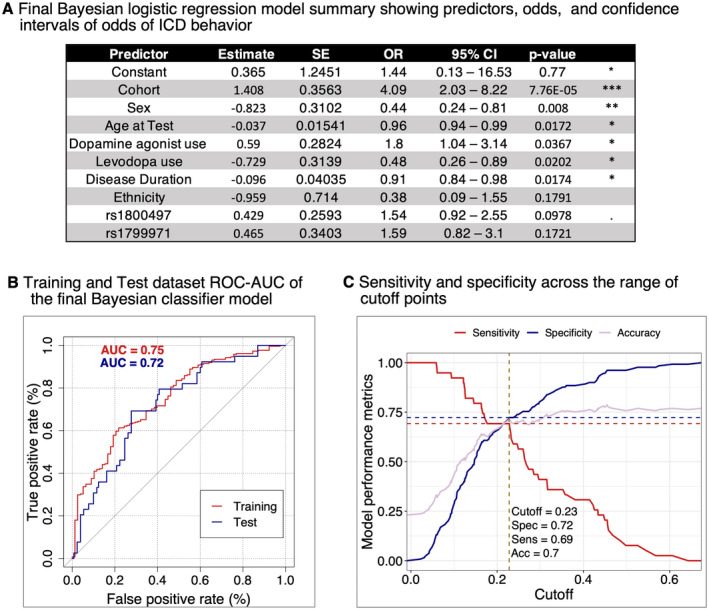
Results: By GWAS, we discovered four new loci associated with ICD at p-values of 4.9e-07 to 1.3e-06. Our best logistic regression model included seven clinical and two genetic variables, achieving an area under the receiver operating curve for ICD prediction of 0.75 in the Training and 0.72 in the Test dataset. The ICD-RS separated groups of PD individuals with ICD prevalence of nearly 40% (highest risk quartile) versus 7% (lowest risk quartile).

Interpretation: In this multi-cohort, international study, we developed an easily computed clinico-genetic tool, the ICD-RS, that substantially enriches for subgroups of PD at very high versus very low risk for ICD, enabling pharmacogenetic approaches to PD medication selection.


Conflict of interest statement

Alice S. Chen‐Plotkin, Marijan Posavi, and Daniel Weintraub declare that they are the inventors of a University of Pennsylvania patent (pending) covering prediction of impulsivity in Parkinson's Disease.

Pierre Fontanillas and Paul Cannon are employed by and hold stock or stock options in 23andMe, Inc.

Figures

Figure 1
Figure 1
Overview of study. The study consisted of two major steps: (1) GWAS in the 23andMe Cohort for nomination of novel variants associated with ICD in PD and (2) development of a model to predict ICD behavior in PD subjects. The GWAS in the 23andMe Cohort (3286 ICD negative (ICD−) and 1976 ICD positive (ICD+) participants) uncovered four SNPs associated with ICD behavior in PD subjects at p < 1.3e‐06. These four and the additional 13 SNPs that were previously reported in the literature to associate with ICD were tested for association with ICD behavior and used to develop an ICD risk score in PD subjects. In particular, we obtained genotypes of 17 nominated SNPs for 320 (252 ICD− and 68 ICD+ participants) PPMI and 188 (139 ICD− and 49 ICD+ PD participants) UPenn Cohort PD subjects. We applied model selection to develop a final logistic regression classifier model. First, we combined the PPMI and UPenn Cohorts (N = 508) and then we randomly split this combined dataset into a non‐overlapping Training dataset and Test dataset in a 2:1 ratio. To select the subset of variables to keep in our final model (providing the best fit to the data), we used the Training dataset only, first performing backward feature selection with fivefold cross‐validation repeated 100 times on the Training dataset (261 ICD− and 78 ICD+ PD participants). We fit the final model (which included two SNPs (rs1800497 and rs1799971) as well as cohort, age, sex, dopamine agonist use, levodopa use, disease duration, and ethnicity as predictors) to the Training dataset employing Bayesian logistic regression. We then evaluated the ability of the Bayesian logistic regression model to predict ICD in the held‐out Test dataset (130 ICD− and 39 ICD+ PD participants). The final classifier model achieved ROC‐AUC = 0.72 on the Test dataset. For each PD participant in the Test dataset, we calculated the risk score (log odds) and RR of developing an ICD behavior using the predictive model. ICD, impulse control disorder; PD, Parkinson's disease; GWAS, Genomewide Association Study; PPMI, Parkinson's Progression Markers Initiative; RR, risk ratio. [Colour figure can be viewed at wileyonlinelibrary.com]
Figure 2
Figure 2
The top four SNPs revealed by 23andMe GWAS. (A) Manhattan plot of GWAS on 23andMe Cohort comparing PD subjects with and without ICD behavior. For each SNP, −log10 scaled p‐value is plotted against chromosomal position. The top 4 SNPs (p < 1.30e‐06) are labeled by the nearest gene. The horizontal solid line indicates the genome‐wide significant cutoff p‐value (p = 5.0e‐08). (B) GWAS summary statistics for the most highly associated variants. For each SNP we show: dbSNP build 146 rsid, chromosomal position (GRCh37 build), the two SNP alleles (A1/A2) in alphabetical order, OR for allele A2, the association test p‐value adjusted for genomic inflation, the confidence interval based on the standard error of the effect size, and the nearest gene. The nearest gene legend: [Gene1, Gene2,…] = The SNP is contained within the transcripts of the specified gene(s). Gene‐‐‐[] = The SNP is flanked by gene on the left and there is no gene within 1 Mb on the right. []‐‐‐Gene = The SNP is flanked by gene on the right and there is no gene within 1 Mb on the left. ICD, impulse control disorder; PD, Parkinson's disease; GWAS, Genomewide Association Study; OR, odds ratio. [Colour figure can be viewed at wileyonlinelibrary.com]
Figure 3
Figure 3
Regional association plots of both genotyped and imputed SNPs across four genomic regions linked to ICD behavior in PD subjects. (A) Region chr1p32.2 shows association of rs148267997 annotated to DAB1. (B) chr7q36.1 region with rs2302532 as a top associated SNP annotated to PRKAG2. (C) chr16p13.3 region with rs11466021 as a top associated SNP annotated to MEFV. (D) Region chr2p21 shows association of rs78448334 annotated to PRKCE. A –log10 p‐value for association between individual SNPs and ICD is plotted against the SNP's chromosomal position. X‐axis shows physical position based on NCBI genome Build 37. The right y axis shows the recombination rate (solid blue line on the plots) estimated from 1000 Genomes Project. A symbol “o” indicates a genotyped variant, a “◊” indicates a protein altering genotyped SNP, “+” is an imputed variant, and an “x” indicates a protein‐altering imputed SNP. Color represents the pairwise LD with the SNP with the most significant p‐value at each locus computed from a set of 10,000 23andMe samples. ICD, impulse control disorder; PD, Parkinson's disease. [Colour figure can be viewed at wileyonlinelibrary.com]
Figure 4
Figure 4
Development of ICD behavior classifier model. (A) The Bayesian logistic regression model estimates of the effects of two SNPs, adjusted for cohort, age at test, sex, dopamine agonist use, levodopa use, disease duration and ethnicity. We calculated the upper (UCL) and lower (LCL) confidence limits of odds of ICD behavior as: CL = odds ±1.96 SE (odds), where odds=expβx, and βx is a linear predictor of ICD. Cohort = UPenn versus PPMI, with UPenn associated with higher risk of ICD (positive estimate), Sex = female versus male, with females associated with lower risk of ICD (negative estimate). (B) The performance of the Bayesian classifier model measured in the Training dataset (261 ICD− and 78 ICD+ participants) by ROC‐AUC was 75%. The same model achieved ROC‐AUC = 72% when we performed prediction in the non‐overlapping Test dataset (130 ICD− and 39 ICD+ participants). (C) Estimating the best ROC‐AUC cutoff point in the Test dataset. Specificity and sensitivity of final Bayesian logistic regression model when predicting ICD behavior in the Test dataset across a range of cutoff points. We performed this analysis using the method closest.topleft (pROC package function coords), which revealed 0.23 as the best cutoff point, yielding an accuracy of 70%, sensitivity of 69% and specificity of 72% (dotted lines). ICD, impulse control disorder; ROC‐AUC, receiver operator characteristic curves‐area under the curve. *p < 0.05, **p < 0.01, ***p < 0.001. [Colour figure can be viewed at wileyonlinelibrary.com]
Figure 5
Figure 5
Risk scores for development of ICD behavior in PD subjects. (A) Calculation of ICD‐RS in the Test dataset. We calculate the ICD‐RSs for each participant in the Test dataset using the log odds (coefficient estimates) obtained by fitting the final Bayesian logistic regression model to the Training dataset. (B) Distribution of the RR in the Test dataset. The RR is the ratio of the empirical ICD prevalence within subgroups of the Test dataset. First, we calculated the ICD prevalence in the group of PD participants with ICD‐RS >1 SD above the mean of ICD‐RS. Then, we calculated ICD prevalence in the remainder of the PD participants (ICD‐RS below the cutoff of +1 SD): RR+1SD.RS=ICDprevalence in participants above+1SDofICDRSICDprevalence in partcipants below+1SDofICDRS=2.6. The participants above 1 standard deviation of ICD‐RS have 2.6‐fold higher rates of ICD behavior than the rest of the participants in the Test dataset. Dashed blue and solid red lines represent normal and empirical distribution of ICD‐RS, respectively. (C) ICD‐RS (log odds) percentile among ICD+ versus ICD− PD participants in the Test dataset. While the horizontal line within the box indicates the median, we also show the percentile mean for each group. Both median and mean percentile are higher in the ICD+ group. (D) Distributions of risk (pICD) per ICD group. Both ICD+ PD and ICD− PD are skewed to the left because only ~23% of participants are ICD+. The purple dotted line indicates the best threshold (0.23) as estimated by the closest.topleft method. (E) The relationship between prevalence of ICD and ICD‐RS percentiles in the Test dataset. Error bars indicate standard errors (SE) generated by 1000 bootstrap replicates. ICD prevalence, binned according to percentiles of ICD‐RS, is highly correlated with ICD‐RS percentiles. Empirical ICD prevalence increases from 7% in individuals within the lowest quartile of ICD‐RS to 38% in the highest quartile. ICD, impulse control disorder; ICD‐RS, ICD risk scores; RR, risk ratio. [Colour figure can be viewed at wileyonlinelibrary.com]

References

    1. Voon V, Fox SH. Medication‐related impulse control and repetitive behaviors in Parkinson disease. Arch Neurol. 2007;64(8):1089‐1096. - PubMed
    1. Weintraub D, Siderowf AD, Potenza MN, et al. Association of dopamine agonist use with impulse control disorders in Parkinson disease. Arch Neurol. 2006;63(7):969‐973. - PMC - PubMed
    1. Weintraub D, Papay K, Siderowf A; Parkinson's Progression Markers Initiative . Screening for impulse control symptoms in patients with de novo Parkinson disease: a case‐control study. Neurology. 2013;80(2):176‐180. - PMC - PubMed
    1. Weintraub D, Koester J, Potenza MN, et al. Impulse control disorders in Parkinson disease: a cross‐sectional study of 3090 patients. Arch Neurol. 2010;67(5):589‐595. doi:10.1001/archneurol.2010.65 - DOI - PubMed
    1. Corvol J‐C, Artaud F, Cormier‐Dequaire F, et al. Longitudinal analysis of impulse control disorders in Parkinson disease. Neurology. 2018;91(3):e189‐e201. - PMC - PubMed

Publication types