. 2022 Jul 26;146(4):316-335.
doi: 10.1161/CIRCULATIONAHA.121.056730. Epub 2022 Jun 28.

Identification of Pathogenic Immune Cell Subsets Associated With Checkpoint Inhibitor-Induced Myocarditis

Affiliations

Identification of Pathogenic Immune Cell Subsets Associated With Checkpoint Inhibitor-Induced Myocarditis

Han Zhu et al. Circulation. .

Abstract

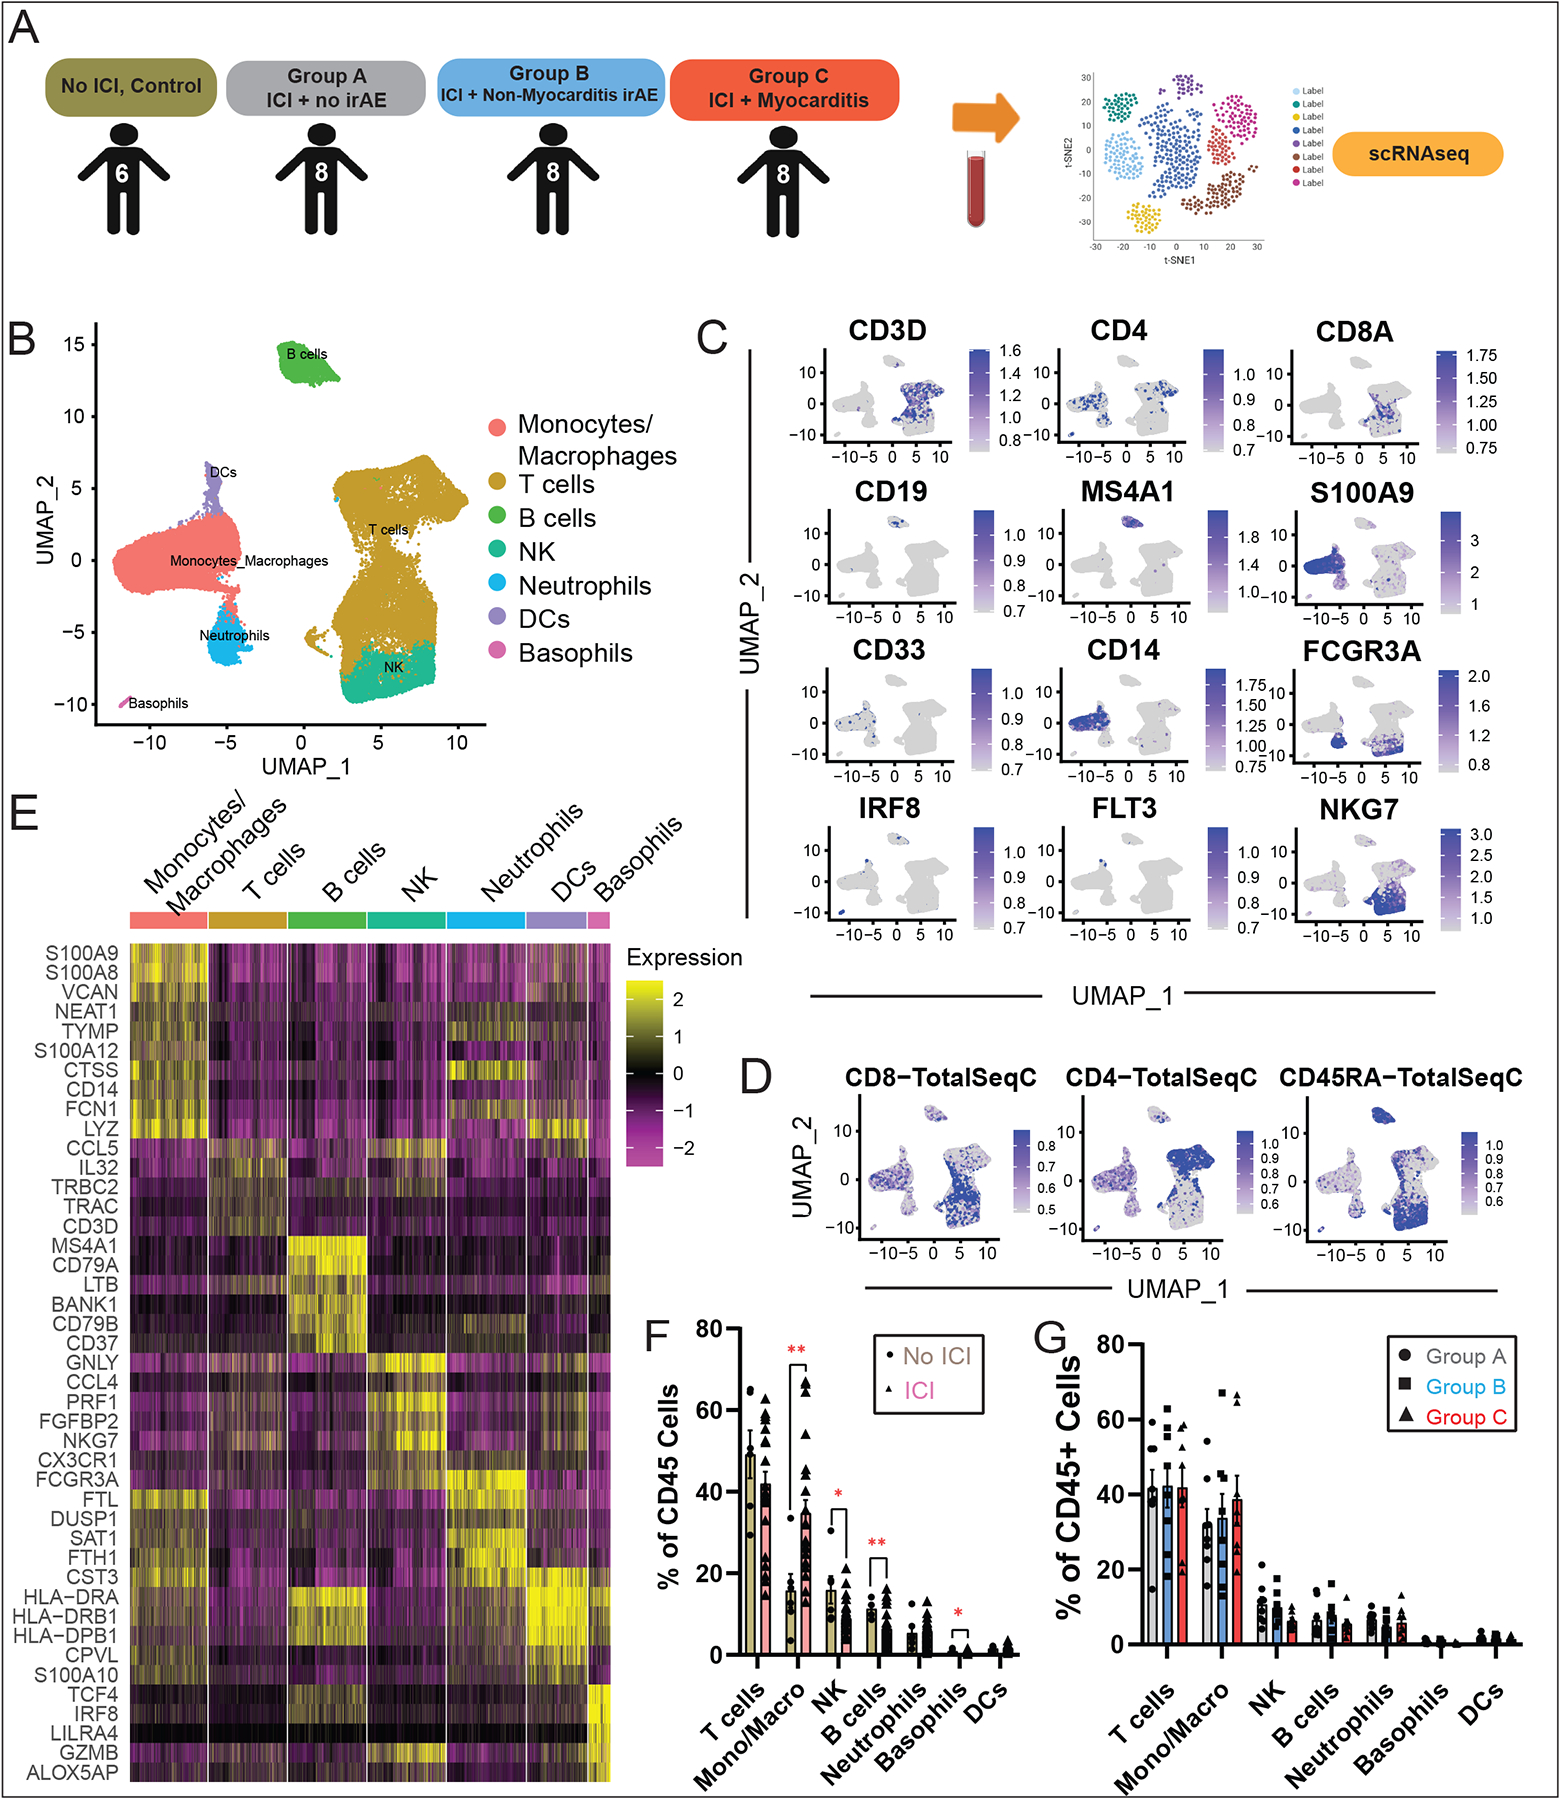
Background: Immune checkpoint inhibitors (ICIs) are monoclonal antibodies used to activate the immune system against tumor cells. Despite therapeutic benefits, ICIs have the potential to cause immune-related adverse events such as myocarditis, a rare but serious side effect with up to 50% mortality in affected patients. Histologically, patients with ICI myocarditis have lymphocytic infiltrates in the heart, implicating T cell-mediated mechanisms. However, the precise pathological immune subsets and molecular changes in ICI myocarditis are unknown.

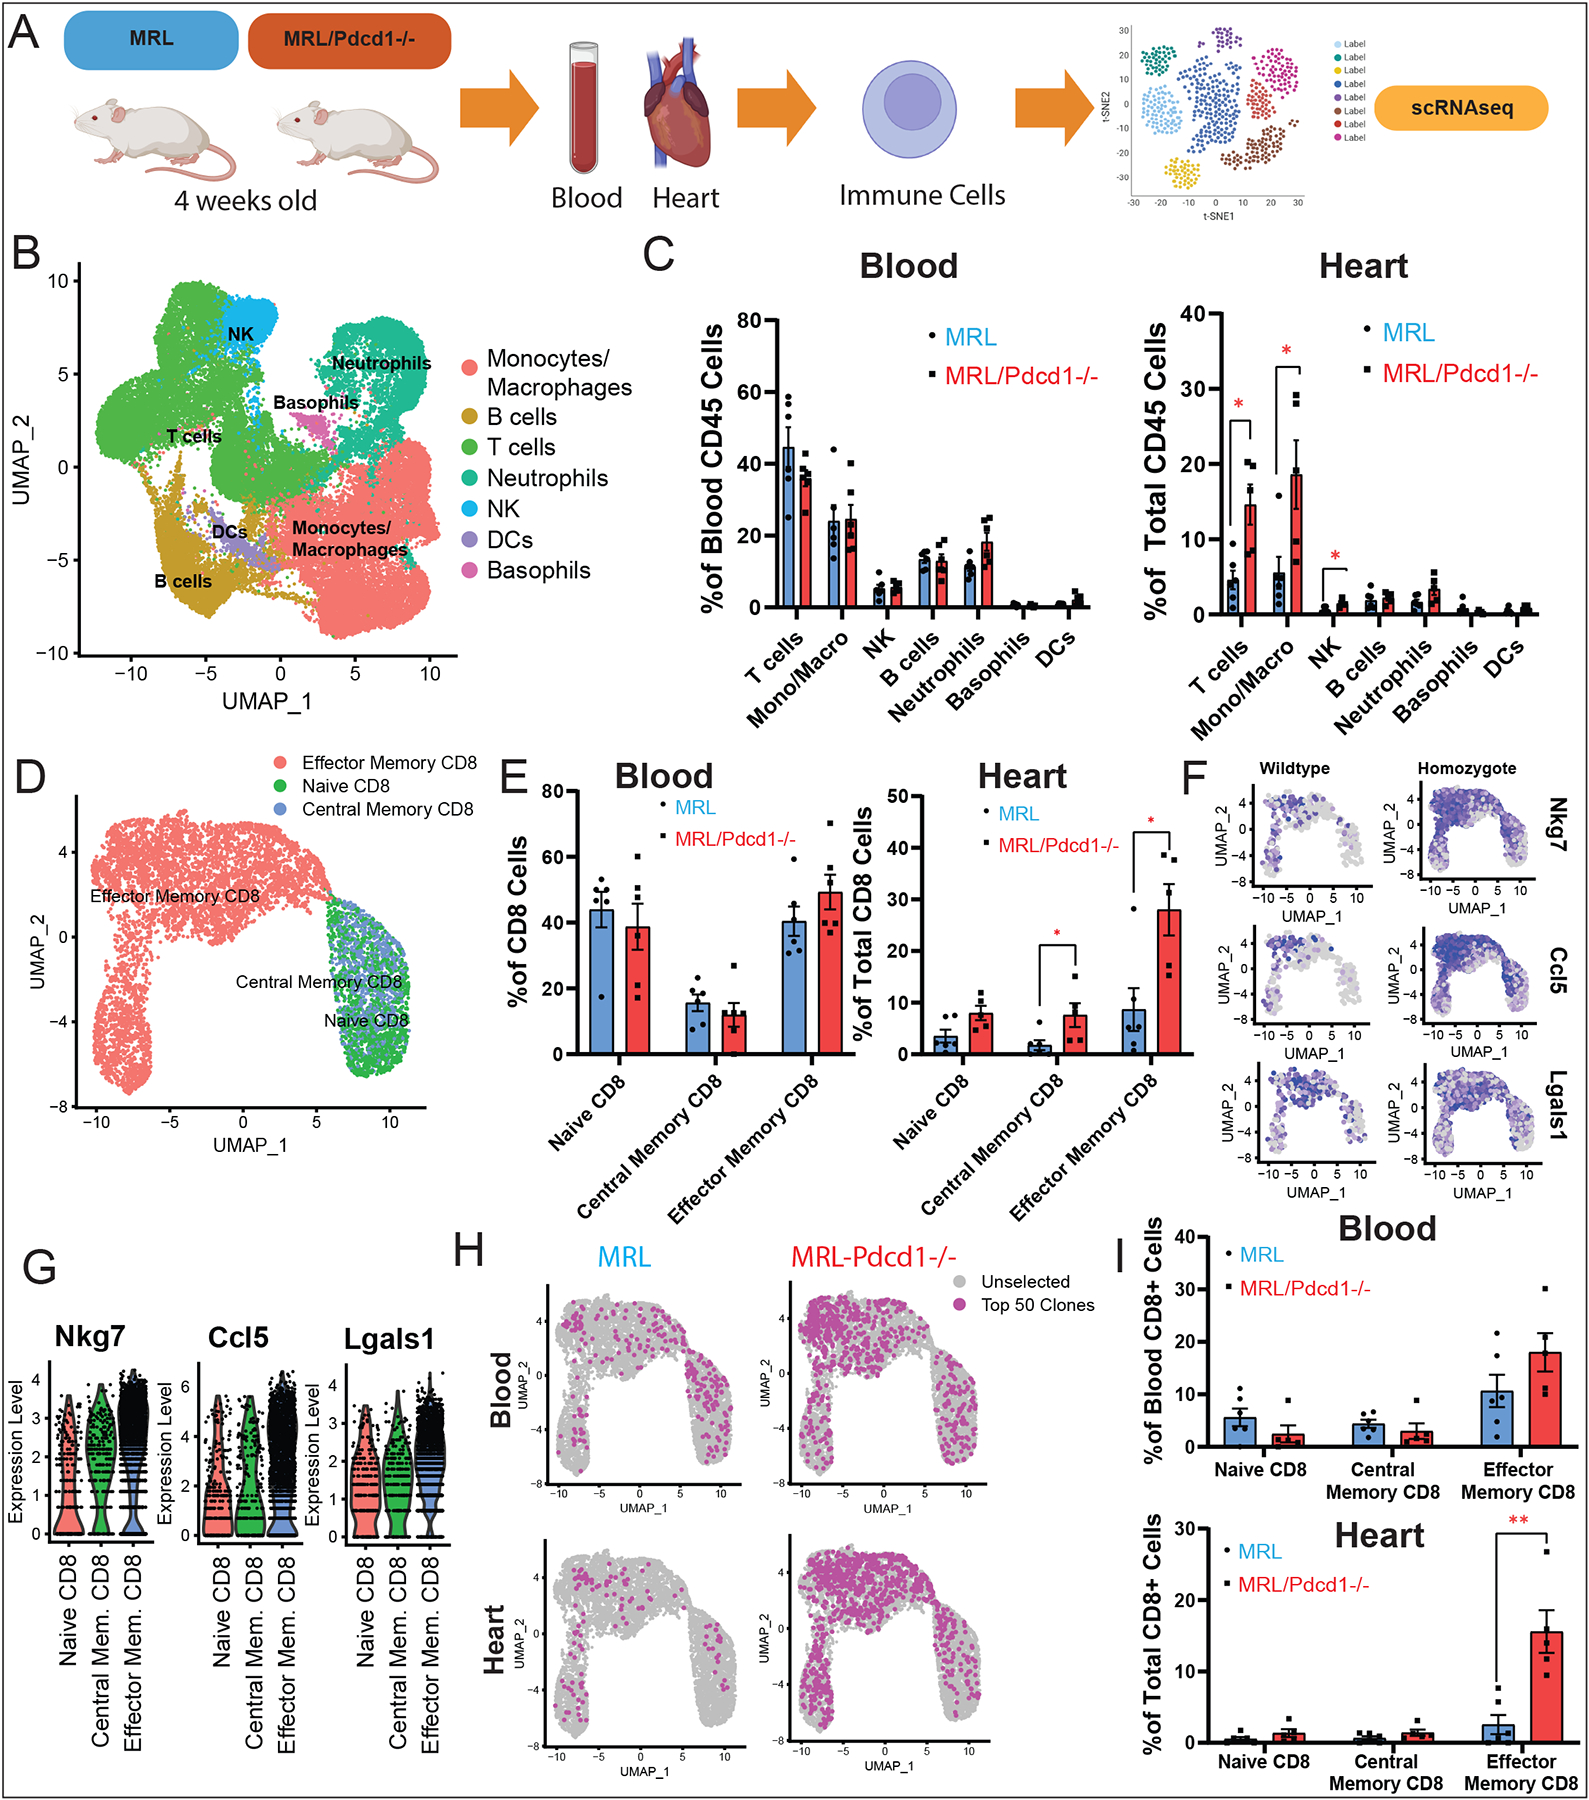
Methods: To identify immune subset(s) associated with ICI myocarditis, we performed time-of-flight mass cytometry on peripheral blood mononuclear cells from 52 individuals: 29 patients with autoimmune adverse events (immune-related adverse events) on ICI, including 8 patients with ICI myocarditis, and 23 healthy control subjects. We also used multiomics single-cell technology to immunophenotype 30 patients/control subjects using single-cell RNA sequencing, single-cell T-cell receptor sequencing, and cellular indexing of transcriptomes and epitopes by sequencing with feature barcoding for surface marker expression confirmation. To correlate between the blood and the heart, we performed single-cell RNA sequencing/T-cell receptor sequencing/cellular indexing of transcriptomes and epitopes by sequencing on MRL/Pdcd1-/- (Murphy Roths large/programmed death-1-deficient) mice with spontaneous myocarditis.

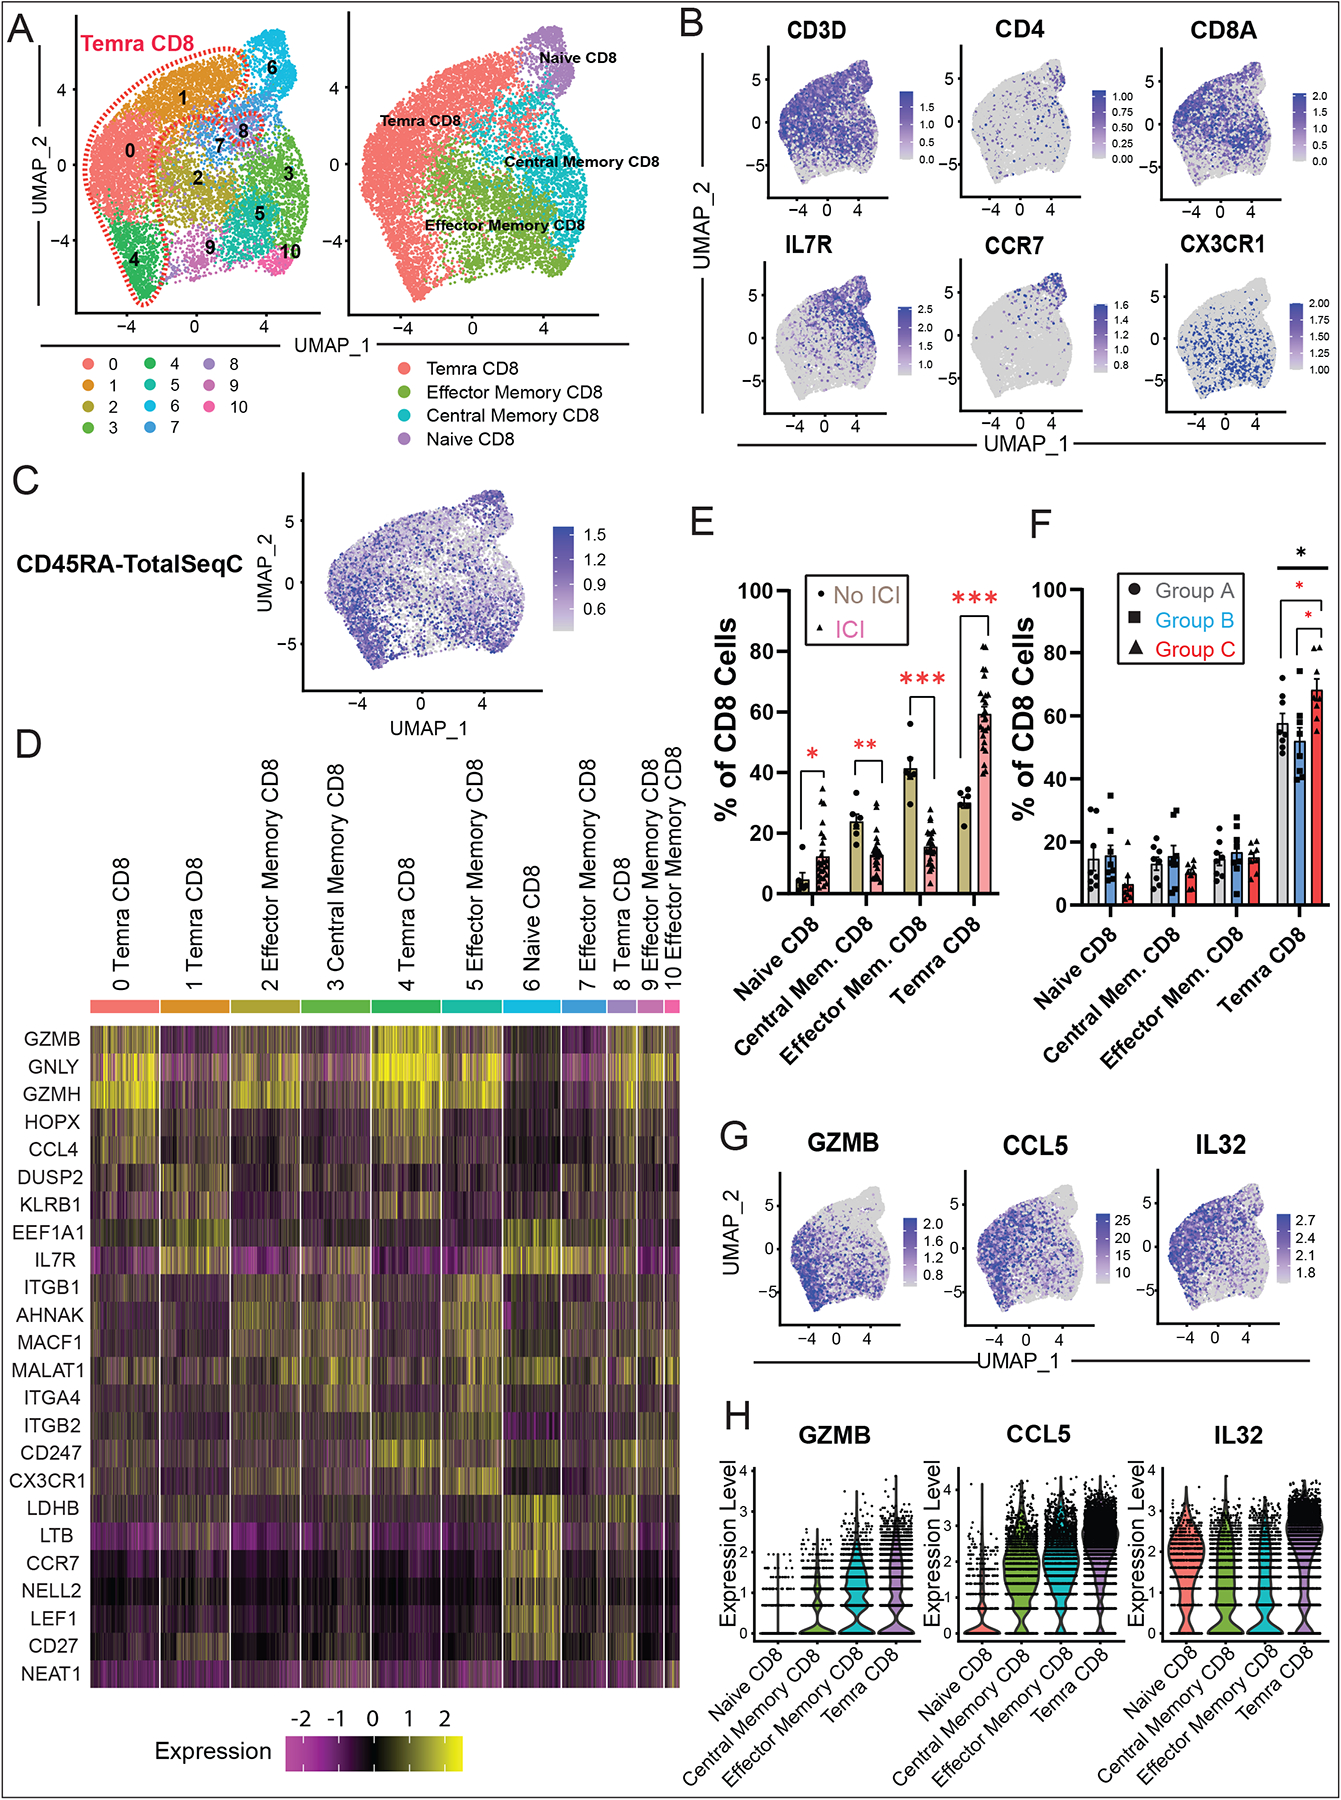
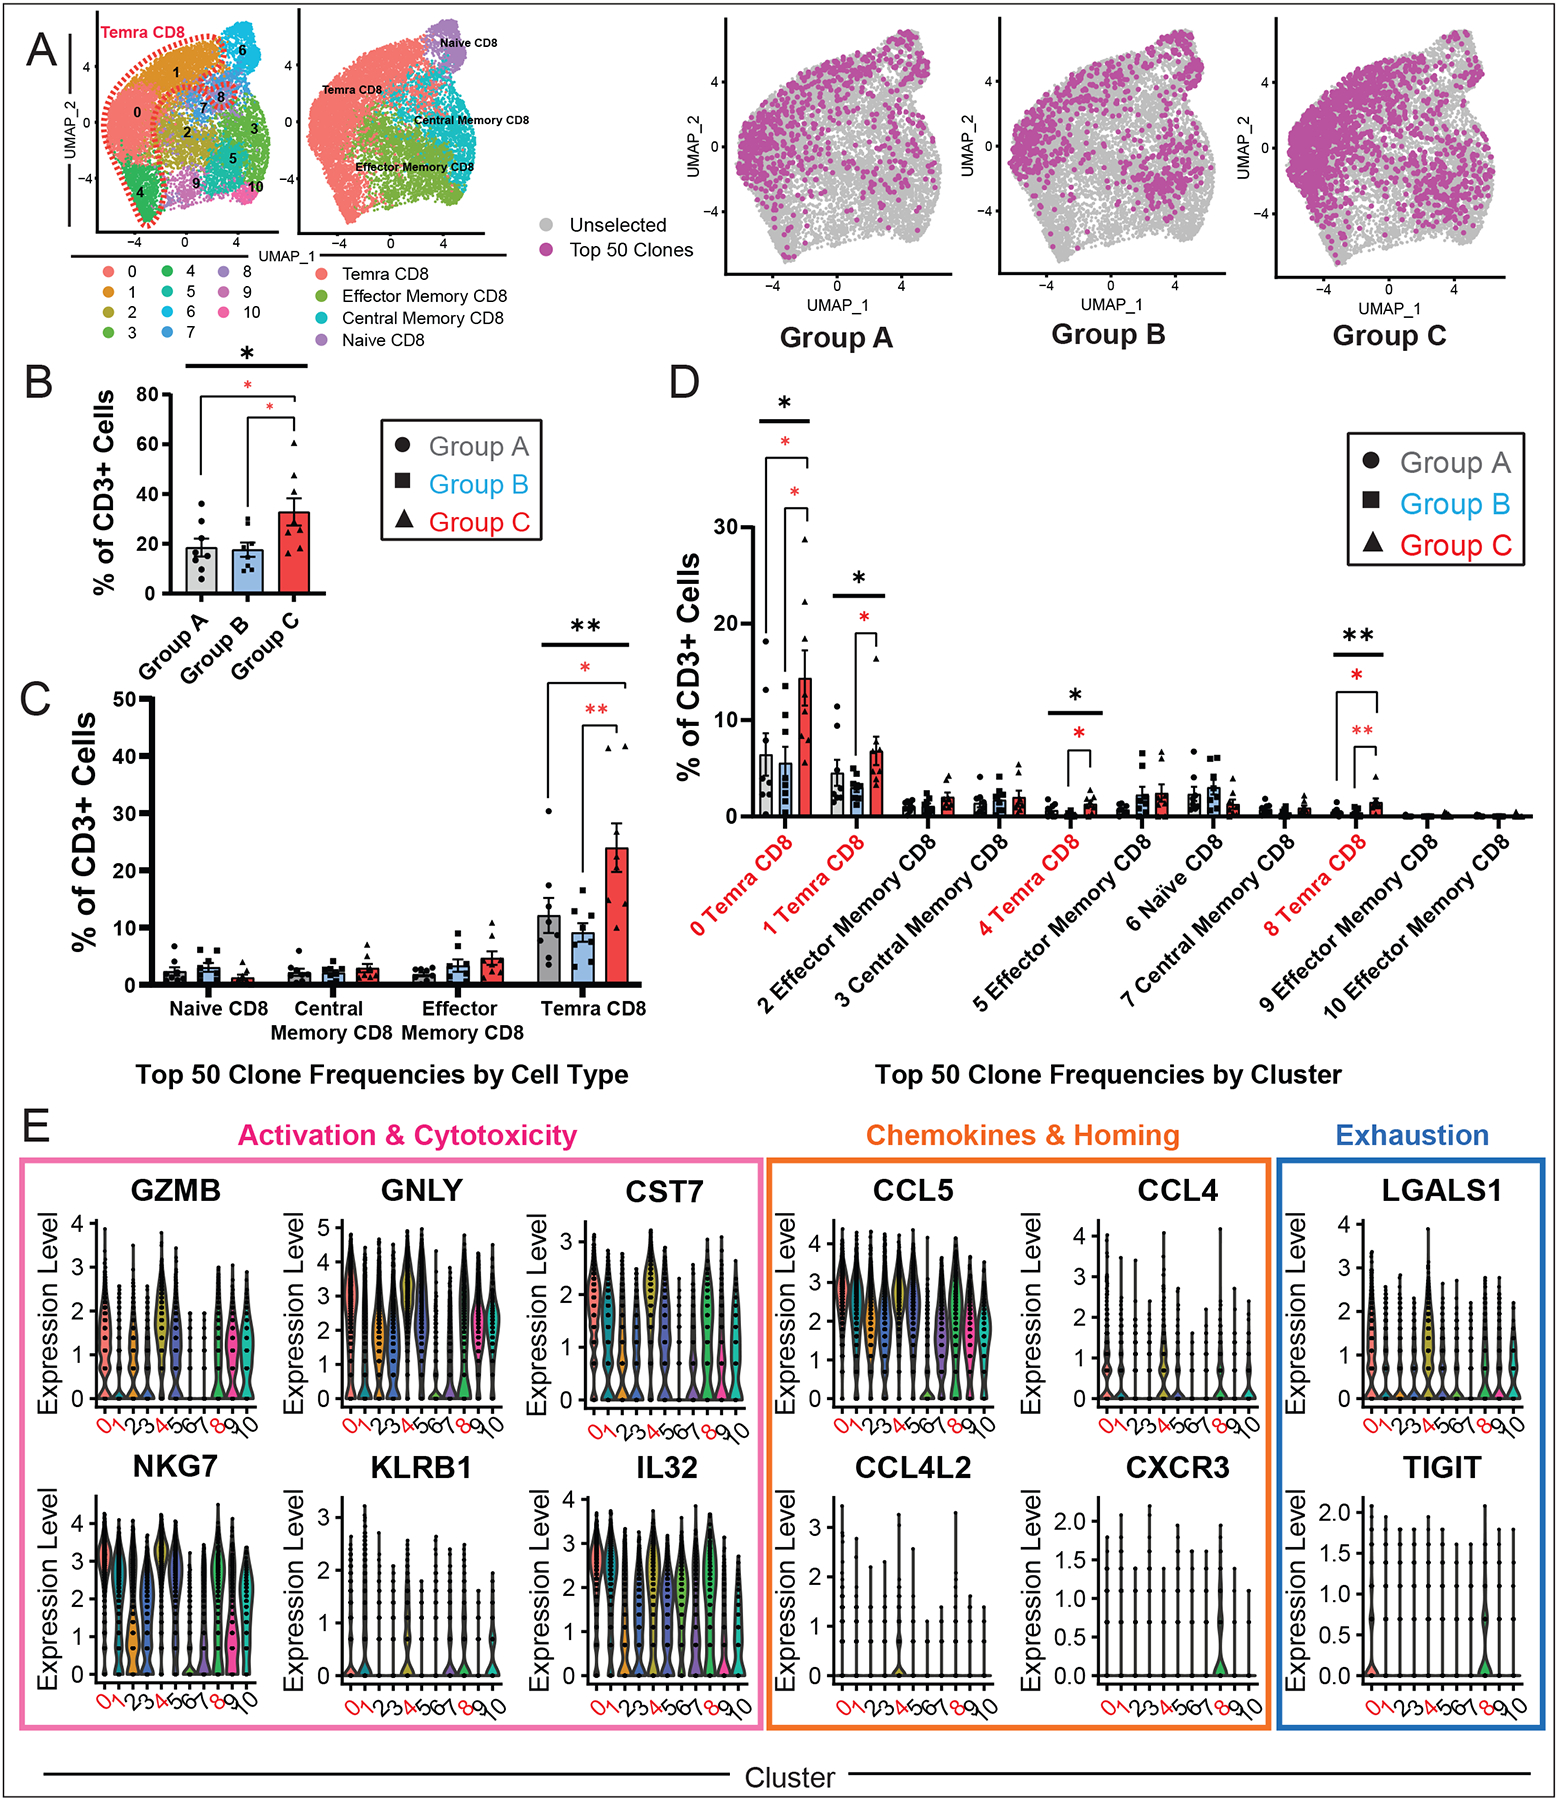
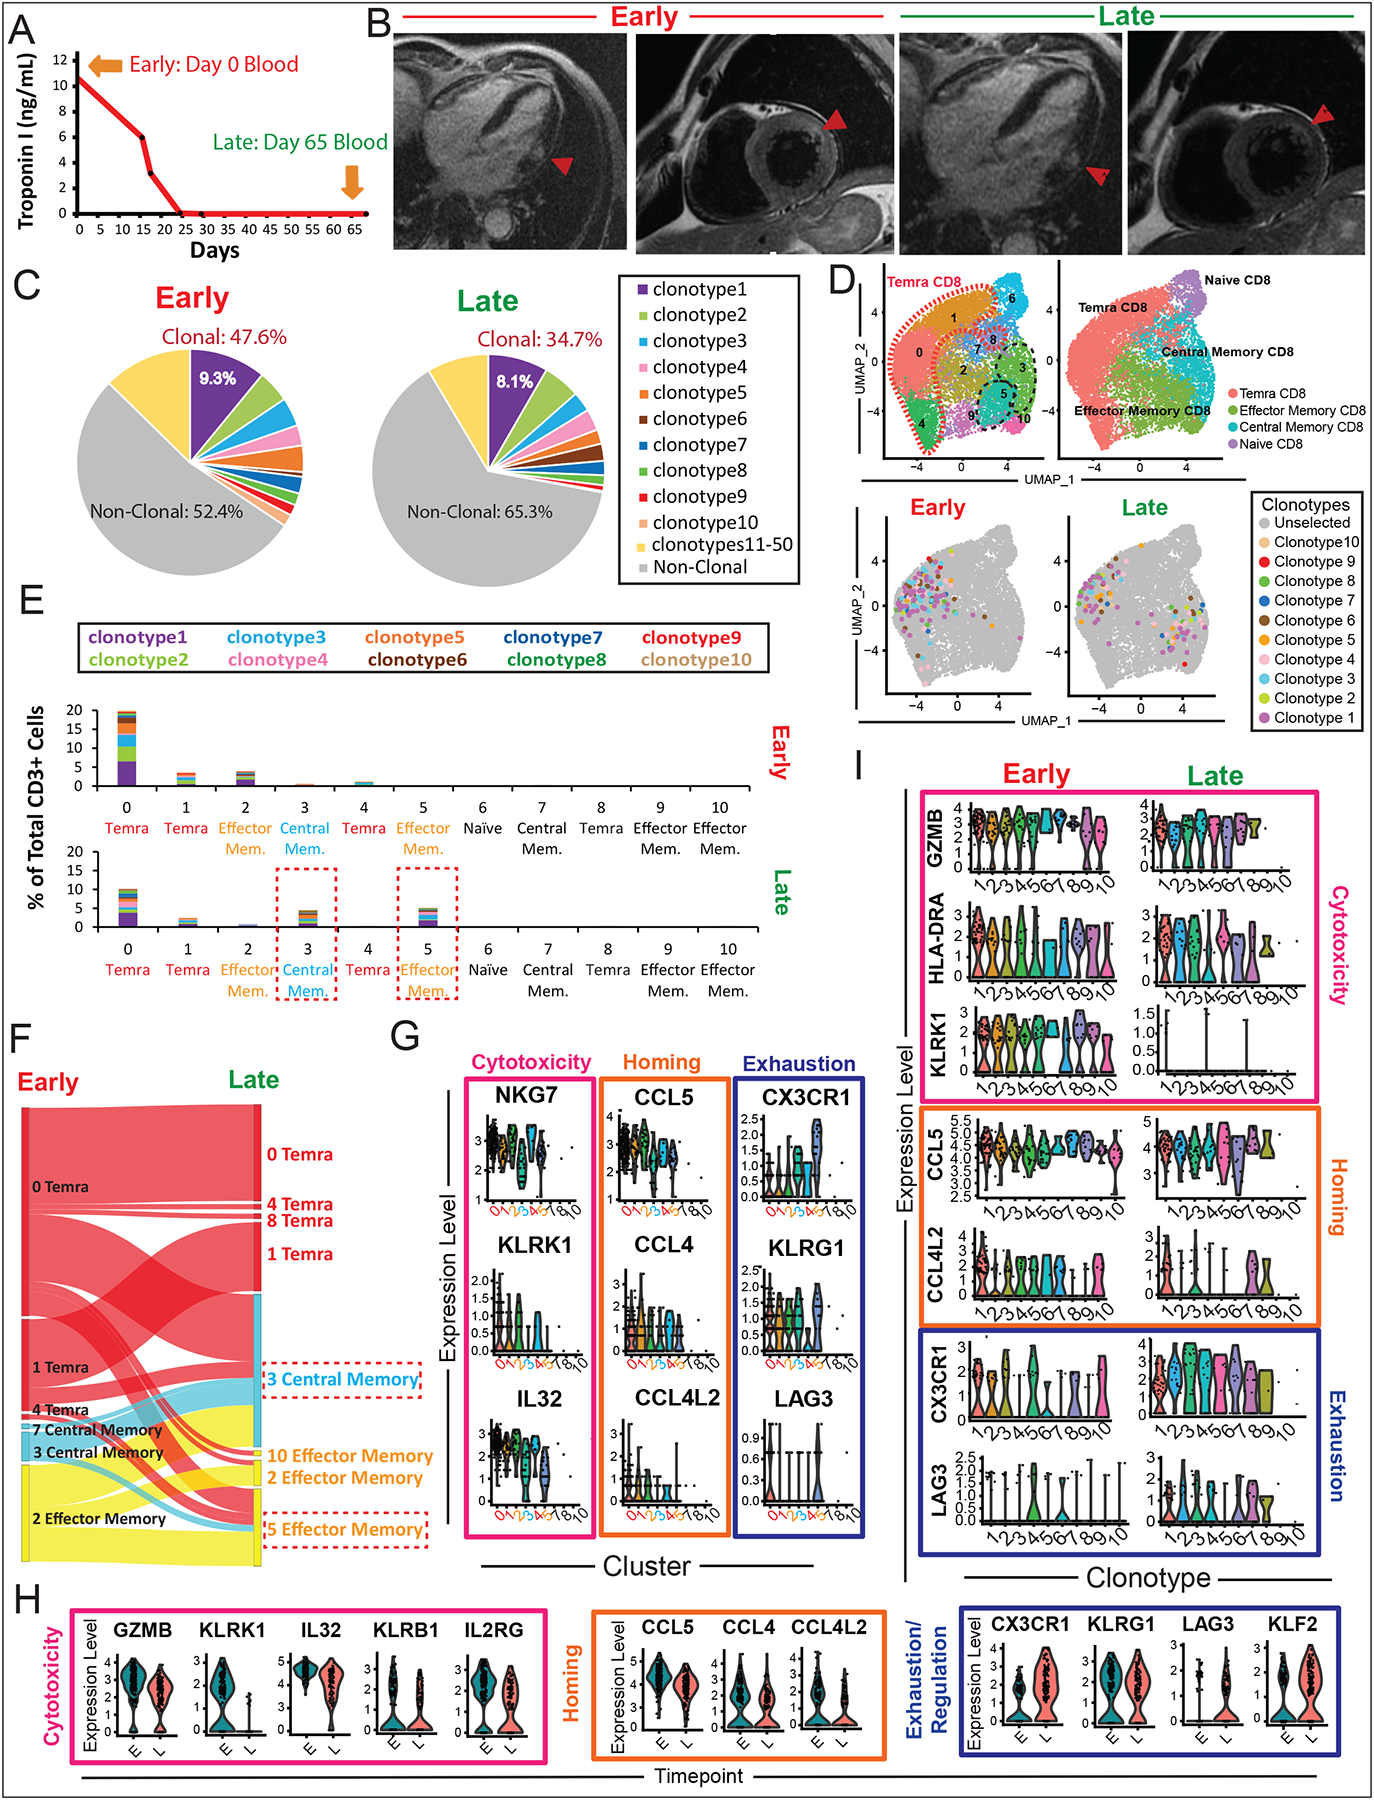
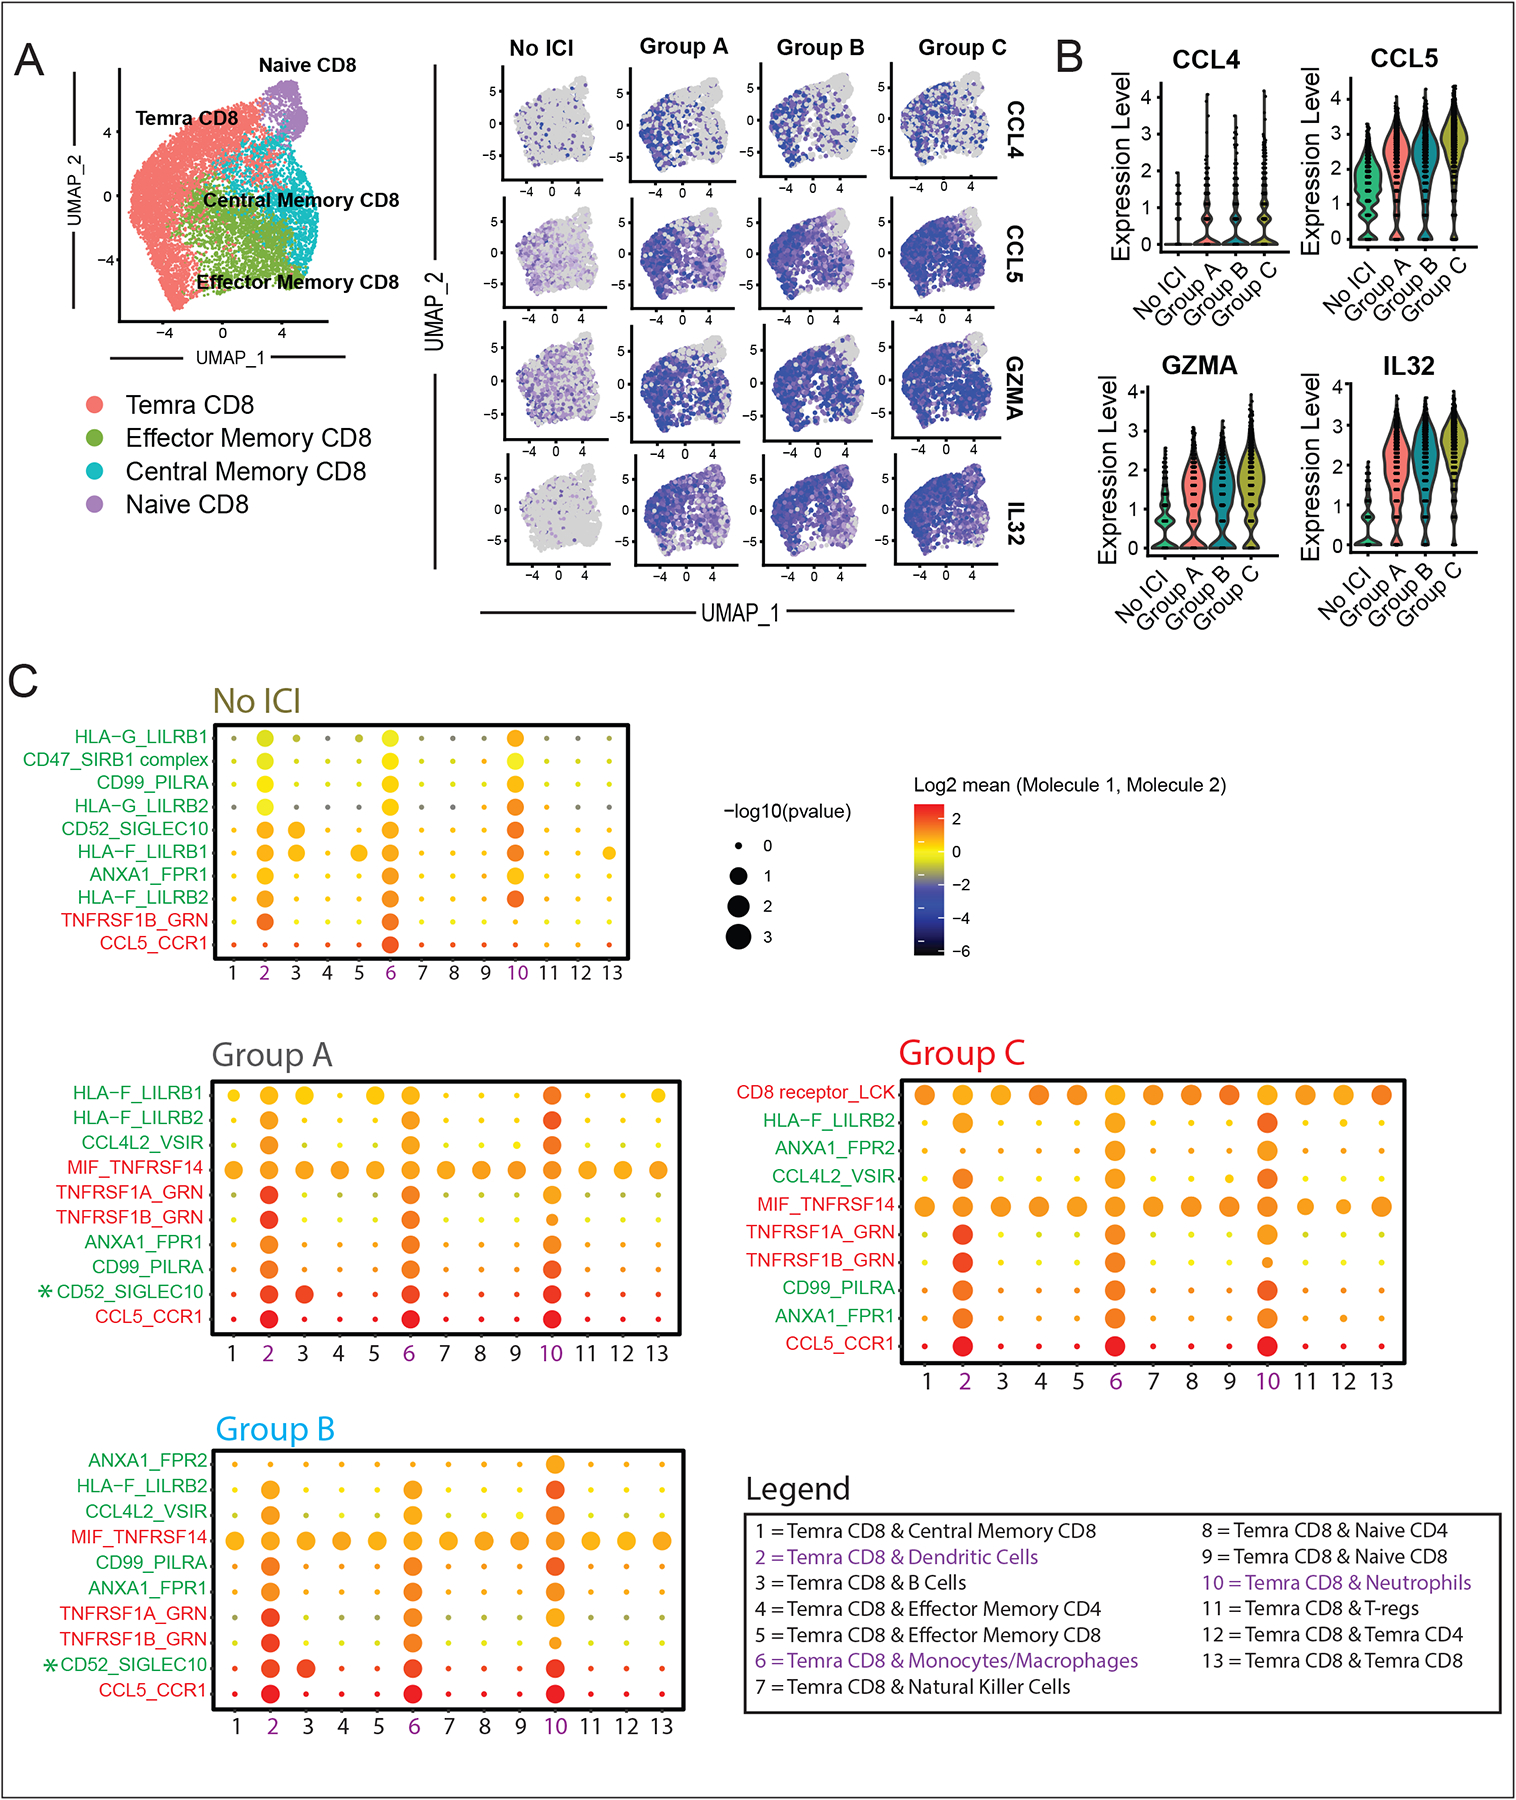
Results: Using these complementary approaches, we found an expansion of cytotoxic CD8+ T effector cells re-expressing CD45RA (Temra CD8+ cells) in patients with ICI myocarditis compared with control subjects. T-cell receptor sequencing demonstrated that these CD8+ Temra cells were clonally expanded in patients with myocarditis compared with control subjects. Transcriptomic analysis of these Temra CD8+ clones confirmed a highly activated and cytotoxic phenotype. Longitudinal study demonstrated progression of these Temra CD8+ cells into an exhausted phenotype 2 months after treatment with glucocorticoids. Differential expression analysis demonstrated elevated expression levels of proinflammatory chemokines (CCL5/CCL4/CCL4L2) in the clonally expanded Temra CD8+ cells, and ligand receptor analysis demonstrated their interactions with innate immune cells, including monocytes/macrophages, dendritic cells, and neutrophils, as well as the absence of key anti-inflammatory signals. To complement the human study, we performed single-cell RNA sequencing/T-cell receptor sequencing/cellular indexing of transcriptomes and epitopes by sequencing in Pdcd1-/- mice with spontaneous myocarditis and found analogous expansions of cytotoxic clonal effector CD8+ cells in both blood and hearts of such mice compared with controls.

Conclusions: Clonal cytotoxic Temra CD8+ cells are significantly increased in the blood of patients with ICI myocarditis, corresponding to an analogous increase in effector cytotoxic CD8+ cells in the blood/hearts of Pdcd1-/- mice with myocarditis. These expanded effector CD8+ cells have unique transcriptional changes, including upregulation of chemokines CCL5/CCL4/CCL4L2, which may serve as attractive diagnostic/therapeutic targets for reducing life-threatening cardiac immune-related adverse events in ICI-treated patients with cancer.

Keywords: immune checkpoint inhibitors; immunophenotyping; immunotherapy; myocarditis; single-cell analysis.


Figures

Fig. 1.
Fig. 1.. Analysis of Immune Cell Populations in ICI Myocarditis using CyTOF Reveals Cytotoxic Temra CD8+ Expansion.
(A) Workflow showing collection of peripheral blood and processing of single-cell suspensions for mass cytometry (CyTOF). (B) Identification of peripheral blood CD45+ immune cell clusters across all samples (n=8–23 subjects per cohort). (C) Feature plots with canonical markers across CD45+ clusters. (D) Quantification of immune cell distribution across clusters and comparison of non-ICI vs. ICI-treated patients showing a relative increase in monocytes and reduction in T-cells in circulating blood in the ICI-treated patients (consisting of Groups A-C) compared to “No ICI” control group. Average and SEM are shown for each patient group. For each cluster, the average fraction of cells from each patient group is shown, after normalization for total CD45+ input cell numbers per patient. (E) Comparison between groups A/B/C showing no significant difference in CD45+ cell subtype proportions between the ICI-treated groups. (F) Identification of peripheral blood CD3+ immune cell clusters across all samples (n=8–23 subjects per cohort). (G) Feature plots with canonical markers across CD3+ clusters. (H) Quantification of CD3+ cell subtypes across clusters and comparison of non-ICI vs. ICI-treated patient groups showing no significant difference between groups. For each cluster, the average fraction of cells from each patient group is shown, after normalization for total CD3+ input cell numbers per patient. Average and SEM are shown for each patient group. (I) Comparison between groups A/B/C showing no significant difference in CD3+ cell subtype proportions between the ICI-treated groups. (J) Identification of peripheral blood CD4+ immune cell clusters across all samples (n=8–23 subjects per cohort). (K) Identification of peripheral blood CD8+ immune cell clusters across all samples (n=8–23 subjects per cohort). (L) Quantification of CD4+ cell subtypes across clusters comparing non-ICI to ICI-treated groups. For each cluster, the average fraction of cells from each patient group is shown, after normalization for total CD4+ input cell numbers per patient. Statistics are calculated as described above. (M) Comparison between groups A/B/C in CD4+ cell subtype proportions between the ICI-treated groups. (N) Quantification of CD8+ cell subtypes across clusters and comparison of non-ICI vs. ICI-tread patient groups showing a significant increase in the proportion of Temra CD8+ T-cells in the myocarditis group compared to control groups and decrease in naïve CD8+ T-cells. For each cluster, the average fraction of cells from each patient group is shown, after normalization for total CD8+ input cell numbers per patient. (O) Comparison between groups A/B/C in CD8+ cells showing statistically significant increased Temra CD8+ cell proportions in Group C (myocarditis) patients compared to control groups (one-way ANOVA, followed by correction for multiple comparisons by controlling the FDR with a significance threshold of q-value < 0.05*).
Fig. 2.
Fig. 2.. Analysis of Immune Cell Populations in ICI Myocarditis Patients using scRNA-seq.
(A) Workflow showing collection of peripheral blood and processing of single-cell suspensions for single-cell RNA-seq. (B) Identification of peripheral blood CD45+ immune cell clusters across all samples (n=6–8 subjects per cohort). (C) Feature plots with canonical markers across CD45+ clusters. (D) Feature barcoding with CITE-seq showing surface markers CD45RA, CD4 and CD8, (E) Heatmap of top differentially expressed genes across clusters. (F) Quantification of CD45+ cell subtypes across clusters and comparison of non-ICI vs. ICI-treated patient groups showing an expansion of monocytes and a relative reduction in circulating T-cells in the ICI-treated groups compared to the “No ICI” control patients, as well as changes in NK, B-cells and basophils. For each cluster, the average fraction of cells from each patient group is shown, after normalization for total CD3+ input cell numbers per patient. Average and SEM are shown for each patient group. (G) Comparisons of CD45+ cell subtypes between groups A/B/C.
Fig. 3.
Fig. 3.. Myocarditis-Related Temra CD8+ Expansion Confirmed by scRNA-seq.
(A) Identification of peripheral blood CD8+ immune cell clusters across all samples (n=6–8 subjects per cohort). (B) RNA feature plots with canonical markers across CD8+ clusters. (C) Feature plots of CD45RA surface protein expression using CITE-seq feature barcoding technology. (D) Heatmap of top differentially expressed genes across clusters. (E) Quantification of CD8+ cell subtypes across clusters and comparison of non-ICI vs. ICI-treated patient groups shows increased proportions of Temra CD8+ T-cells in the myocarditis group compared to controls, as well as other changes across the CD8+ subtypes. For each cluster, the average fraction of cells from each patient group is shown, after normalization for total CD8+ input cell numbers per patient. Average and SEM are shown for each patient group. (F) Quantification of CD8+ cell subtypes across clusters and comparison of A/B/C patient groups shows increased proportions of Temra CD8+ T-cells in the myocarditis group C compared to groups A/B controls (one-way ANOVA, followed by correction for multiple comparisons by controlling the FDR with a significance threshold of q-value < 0.05*). (G) Feature plots displaying expression of GZMB (cytotoxicity marker), CCL5 (pro-inflammatory chemokine), and IL32 (pro-inflammatory interleukin) in the Temra CD8 clusters. (H) Violin plots showing increased log normalized expression of GZMB, CCL5, and IL32 in Temra CD8+ cells compared to the other CD8+ cell types.
Fig. 4.
Fig. 4.. Single-Cell TCR Sequencing Reveals Myocarditis-Associated Clonal Expansion of Temra CD8+ Cell Clusters.
(A) Visualization of top 50 TCR clonotypes across patient groups A, B, and C (n=8 each) showing expansion of clonotypes in group C (myocarditis) patients compared to control groups. (B) Quantification of the top 50 TCR clonotypes as a fraction of total CD3+ cells across patient groups. For each patient in a group, the fraction of top 50 clonotypes was normalized against CD3+ input cell numbers. Average and SEM are shown for each patient group. Statistical analysis compares groups A, B, and C. One-way ANOVA was performed, followed by correction for multiple comparisons by controlling the FDR with a significance threshold of q-value < 0.05*. (C) Quantification of top 50 TCR clonotypes across CD8+ cell subtypes as previously defined in Fig. 3, compared across patient groups A, B, and C showing increase in Temra CD8+ in the myocarditis group C (one-way ANOVA, followed by correction for multiple comparisons by controlling the FDR with a significance threshold of q-value < 0.05*). (D) Quantification of top 50 TCR clonotypes across the 10 CD8+ cell clusters compared across patient groups A, B, and C. All Temra CD8+ clusters (0, 1, 4, 8) show statistically significant expansion in the myocarditis group C and are highlighted in red. Kruskal-Wallis was performed, followed by Dunn’s multiple comparisons test. (E) Violin plots displaying significantly differentially expressed genes across CD8+ T cell clusters comparing log normalized expression of significant genes in myocarditis-associated Temra CD8+ clusters (0, 1, 4, 8) highlighted in red compared to all other clusters. Myocarditis-associated Temra CD8+ clusters show elevated expression levels of classical cytotoxicity/activation genes (GZMB, GNLY, CST7, NKG7, KLRB1, IL32) and increased expression of potentially myocardial-tropic chemokines (CCL5/CCL4/CCL4L2/CXCR3). Myocarditis-associated clusters are also associated with increased expression of select T-cell exhaustion markers (LGALS and TIGIT).
Fig. 5.
Fig. 5.. Activated and Expanded Cytotoxic Temra CD8+ Clones Persist Two Months after Myocarditis but Exhibit Markers of T-Cell Exhaustion.
(A) Peripheral blood was collected from a patient with myocarditis (MCE1) at initial myocarditis diagnosis (early timepoint =day 0) and after resolution of clinical myocarditis and troponin I biomarker (late timepoint = day 65). (B) Cardiac magnetic resonance imaging (cMRI) shows myocarditis in the lateral wall at early timepoint (day 0) including myocardial thinning and delayed gadolinium enhancement (DGE) and increased T2 signal consistent with myocardial edema, with resolution myocardial edema by late timepoint (day 65). (C) Clonal analysis of CD3+ cells in peripheral blood by single-cell TCR sequencing shows oligoclonal expansion of top 50 TCR clonotypes (47.6% of all CD3+ cells in peripheral blood) in the early myocarditis timepoint which decreases slightly but persists (34.7% of CD3+ cells) in the late timepoint. Top 10 expanded clonotypes are shown by their individual colors, with top expanded clonotype 1 shown in purple, etc. (D) Visualization of top 10 expanded TCR clonotypes on UMAP showing localization of individual expanded clonotypes in Temra clusters 0, 1, and 4 which translocate to clusters 3 (central memory) and 5 (effector memory) in the late timepoint. (E) Quantification of percentages of top 10 expanded TCR clonotypes in each cluster as a fraction of total CD3+ cells in the patient in the early and late timepoints, showing shift in clonally expanded population from clusters 0, 1, and 4 to clusters 3 and 5 the late timepoint. (F) Sankey diagram showing shift in the top 10 expanded TCR clonotypes from predominantly Temra clusters (0, 1, 4) to central memory cluster 3 and effector memory cluster 5 in the late timepoint. (G) Violin plots showing differential gene expression analysis of the top 10 expanded TCR clonotypes across clusters, showing decreased expression of cytotoxicity genes (IL32, KLRK1, IL32) and homing chemokine genes (CCL5, CCL4, CCl4L2) in clusters 3 and 5 (associated with the late timepoint). In contrast, clusters 3 and 5 exhibited higher expression of T-cell exhaustion genes CX3CR1, KLRG1, and LAG3. (H) Violin plots of differential gene analysis in the early vs. late timepoints, showing relative decrease in T-cell cytotoxicity genes (GZMB, KLRK1, IL32, KLRB1, IL2RG) and homing chemokines (CCL5, CCL4, CCL4L2) in the late compared to early timepoints. In contrast, there was relative increased expression of T-cell exhaustion markers (CX3CR1, KLRG1, LAG3, and KLF2) in the late compared to early timepoint. (I) Violin plots showing differential gene expressions in top 10 expanded individual TCR clonotypes in the early vs. late timepoint, demonstrating similar decrease in cytotoxicity/homing genes and increase in exhaustion genes in the late timepoint.
Fig. 6.
Fig. 6.. Gene Expression Programs of Myocarditis-Associated T Cell Populations Exhibit Increased Cardiotropic Chemokines and Markers of Autoimmunity.
(A) Feature plots showing top differentially expressed genes in CD8+ T-cells across patient groups A, B, and C, showing increased expression of myocardial-tropic chemokines (CCL4 and CCL5) and pro-inflammatory genes (GZMA and IL32). (B) Violin plots showing averaged log-fold expression of top differentially expressed genes across the patient groups A, B and C. (C) Top 10 predicted ligand-receptor interactions of Temra CD8+ cells in each patient cohort. Interaction scores were calculated based on the expression of ligands and corresponding receptors in scRNA-seq data [CellPhoneDB, (https://www.cellphonedb.org/))]. Results highlight the increase in CCL5-CCR1 interactions between Temra CD8 cells and some members of the innate immune system (dendritic cells, monocytes/macrophages, and neutrophils) with ICI treatment. Pro-inflammatory interactions are labeled in red, anti-inflammatory signals in green, and neutral signals in grey. Group C myocarditis interactions lacked T-cell suppressive signal, CD52-SIGLEC10, compared to the other ICI treated groups (A and B).
Fig. 7.
Fig. 7.. Analysis of Immune Cell Populations in MRL vs. MRL/Pdcd1−/− mice using scRNA-seq.
(A) Workflow showing collection of peripheral blood and processing of single-cell suspensions for single-cell RNA-seq from 4-week-old MRL/Pdcd1−/− mice (n=6) with spontaneous myocarditis and control MRL mice (n=6). (B) Identification of CD45+ immune cell clusters from blood and hearts of MRL/Pdcd1−/− and control MRL mice. (C) Quantification of CD45+ cell subtypes across clusters and comparison of MRL vs. MRL/Pdcd1−/− mice show increased macrophages/monocytes as well as T-cells in the hearts of MRL/Pdcd1−/− mice. Average and SEM are shown for each genotype. Statistical analysis compares MRL vs MRL/Pdcd1−/− groups. (D) Identification of CD8+ immune cell clusters from blood and hearts of MRL/Pdcd1−/− and control MRL mice. (E) Quantification of CD8+ cell subtypes across clusters and comparison of MRL vs. MRL/Pdcd1−/− mice. Average and SEM are shown for each genotype. Statistical analysis compares MRL vs MRL/Pdcd1−/− groups. (F) Feature plots showing top differentially expressed genes in CD8+ T-cells among MRL/Pdcd1−/− mice compared to MRL mice, showing increased expression of cytotoxicity markers (Nkg7), myocardial-tropic chemokines (Ccl5), and exhaustion markers (Lgals1) in the effector CD8+ T-cell clusters. (G) Violin plots displaying significantly differentially expressed genes in MRL/Pdcd1−/− compared to MRL mice, including cytotoxicity markers (Nkg7), myocardial-tropic chemokines (Ccl5), and exhaustion markers (Lgals1) in the effector CD8+ T-cell clusters. (H) Visualization of top 50 TCR clonotypes in blood and hearts of MRL and MRL/Pdcd1−/− mice. (I) Quantification of top 50 TCR clonotypes across CD8+ cell subtypes in MRL/Pdcd1−/− mice and MRL control mice.

Comment in

References

    1. Moslehi JJ, Salem JE, Sosman JA, Lebrun-Vignes B, Johnson DB. Increased reporting of fatal immune checkpoint inhibitor-associated myocarditis. Lancet. 2018;391:933. - PMC - PubMed
    1. Mahmood SS, Fradley MG, Cohen JV., Nohria A, Reynolds KL, Heinzerling LM, et al. Myocarditis in Patients Treated With Immune Checkpoint Inhibitors. J Am Coll Cardiol. 2018; 71:1755–1764. - PMC - PubMed
    1. Salem J, Manouchehri A, Moey M, Lebrun-vignes B, Bastarache L, Pariente A, et al. Articles Cardiovascular toxicities associated with immune checkpoint inhibitors : an observational, retrospective, pharmacovigilance study. Lancet Oncol. 2018;2045:1–11. - PMC - PubMed
    1. Caforio ALP. Myocarditis: endomyocardial biopsy and circulating anti-heart autoantibodies are key to diagnosis and personalized etiology-directed treatment. European Heart Journal. 2021;42:1618–1620. - PubMed
    1. Bracamonte-Baran W, Čiháková D. Cardiac autoimmunity: Myocarditis. Advances in Experimental Medicine and Biology. 2017; 1003:187–221. - PMC - PubMed

Publication types