Luminance dependency of perceived color shift after color contrast adaptation caused by higher-order color channels
- PMID: 35762942
- PMCID: PMC9251816
- DOI: 10.1167/jov.22.7.8
Luminance dependency of perceived color shift after color contrast adaptation caused by higher-order color channels
Abstract
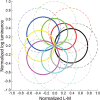
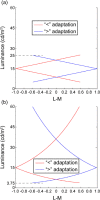
Color adaptation is a phenomenon in which, after prolonged exposure to a specific color (i.e. adaptation color), the perceived color shifts to approximately the opposite color direction of the adaptation color. Color adaptation is strongly related to sensitivity changes in photoreceptors, such as von Kries adaptation and cone-opponent mechanisms. On the other hand, the perceptual contrast of colors (e.g. perceptual saturation of the red-green direction) decreases after adaptation to a stimulus with spatial and/or temporal color modulation along the color direction. This phenomenon is referred to as color contrast adaptation. Color contrast adaptation has been used to investigate the representation of colors in the visual system. In the present study, we measured color perception after color contrast adaptation to stimuli with temporal color modulations along complicated color loci in a luminance-chromaticity plane. We found that, after the observers adapted to color modulations with different chromaticities at higher, medium, and lower luminance (e.g. temporal alternations among red, green, and red, each at a different luminance level), the chromaticity corresponding to perceptual achromaticity (the achromatic point) shifted to the same color direction as the adaptation chromaticity in each test stimulus luminance. In contrast, this luminance dependence of the achromatic point shift was not observed after adaptation to color modulations with more complex luminance-chromaticity correspondences (e.g. alternating red, green, red, green, and red, at five luminance levels, respectively). In addition, the occurrence or nonoccurrence of the luminance-dependent achromatic point shift was qualitatively predicted using a noncardinal model composed of channels preferring intermediate color directions between the cardinal chromaticity and luminance axes. These results suggest that the noncardinal channels are involved in the luminance-dependent perceived color shift after adaptation.
Figures


Similar articles
-
The effect of chromatic and luminance information on reaction times.Vis Neurosci. 2010 Jul;27(3-4):119-29. doi: 10.1017/S0952523810000143. Epub 2010 Jul 1. Vis Neurosci. 2010. PMID: 20594382
-
The influence of contrast adaptation on color appearance.Vision Res. 1994 Aug;34(15):1993-2020. doi: 10.1016/0042-6989(94)90028-0. Vision Res. 1994. PMID: 7941399
-
Changes in induced hues at low luminance and following dark adaptation suggest rod-cone interactions may differ for luminance increments and decrements.Vis Neurosci. 2008 May-Jun;25(3):387-94. doi: 10.1017/S0952523808080358. Vis Neurosci. 2008. PMID: 18598407
-
Individual and age-related variation in chromatic contrast adaptation.J Vis. 2012 Aug 17;12(8):11. doi: 10.1167/12.8.11. J Vis. 2012. PMID: 22904356 Free PMC article.
-
Spatio-chromatic contrast sensitivity under mesopic and photopic light levels.J Vis. 2020 Apr 9;20(4):23. doi: 10.1167/jov.20.4.23. J Vis. 2020. PMID: 32347909 Free PMC article.
Cited by
-
Improvement of BCI performance with bimodal SSMVEPs: enhancing response intensity and reducing fatigue.Front Neurosci. 2025 Mar 6;19:1506104. doi: 10.3389/fnins.2025.1506104. eCollection 2025. Front Neurosci. 2025. PMID: 40115888 Free PMC article.
References
-
- Allard, R., & Faubert, J. (2008). The noisy-bit method for digital displays: converting a 256 luminance resolution into a continuous resolution. Behavior Research Methods, 40(3), 735–743. - PubMed
-
- Anstis, S., Vergeer, M., & van Lier, R (2012). Luminance contours can gate afterimage colors and “real” colors. Journal of Vision, 12(10):2, 1–13. - PubMed
-
- Anstis, S., Verstraten, F. A. J., & Mather, G. (1998). The motion aftereffect. Trends in Cognitive Sciences, 2(3), 111–117. - PubMed
-
- Beer, R. D., & MacLeod, D. I. A. (2000). Pre-exposure to contrast selectively compresses the achromatic half-axes of color space. Vision Research, 40(22), 3083–3088. - PubMed
Publication types
MeSH terms
LinkOut - more resources
Full Text Sources

