. 2022 Sep 30;222(2):iyac099.
doi: 10.1093/genetics/iyac099.

The RNA-binding protein Swm is critical for Drosophila melanogaster intestinal progenitor cell maintenance

Affiliations

The RNA-binding protein Swm is critical for Drosophila melanogaster intestinal progenitor cell maintenance

Ishara S Ariyapala et al. Genetics. .

Abstract

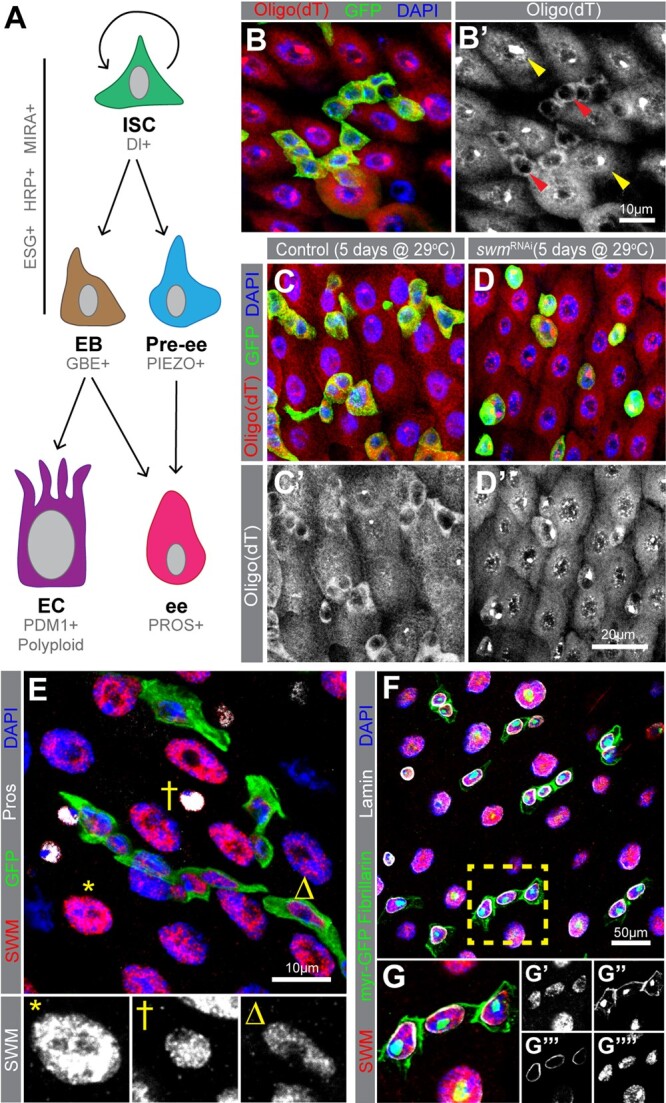
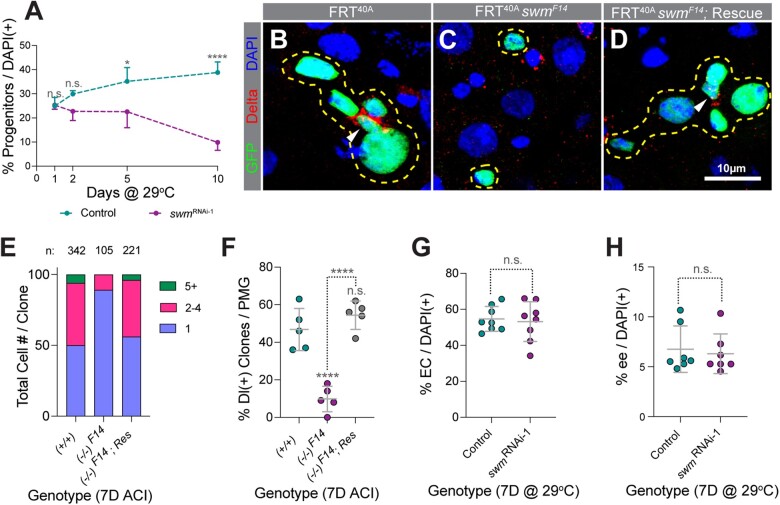
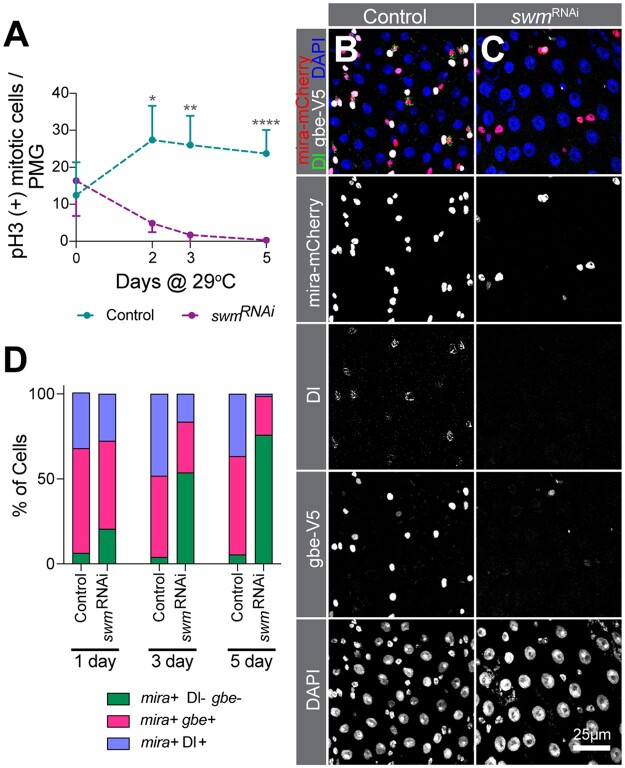
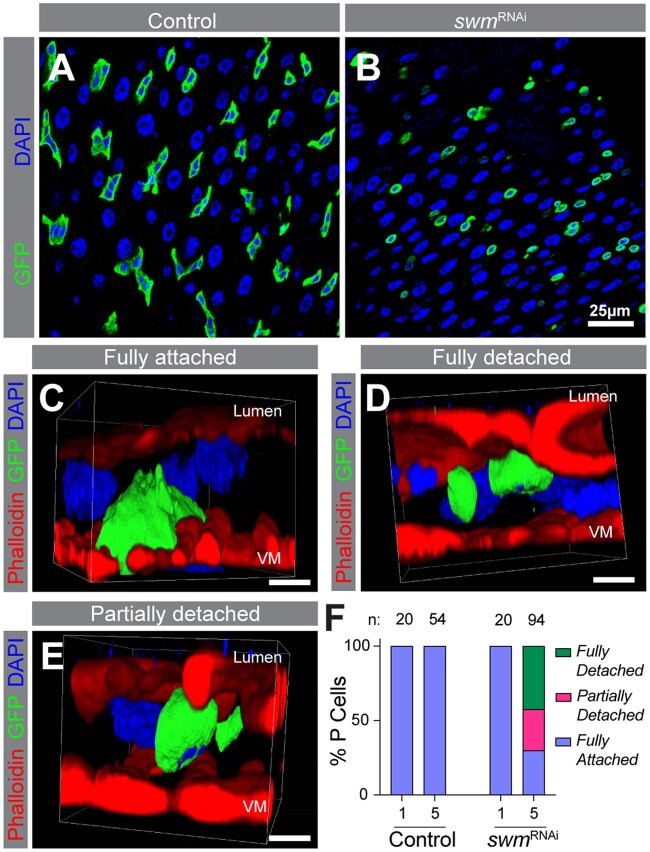
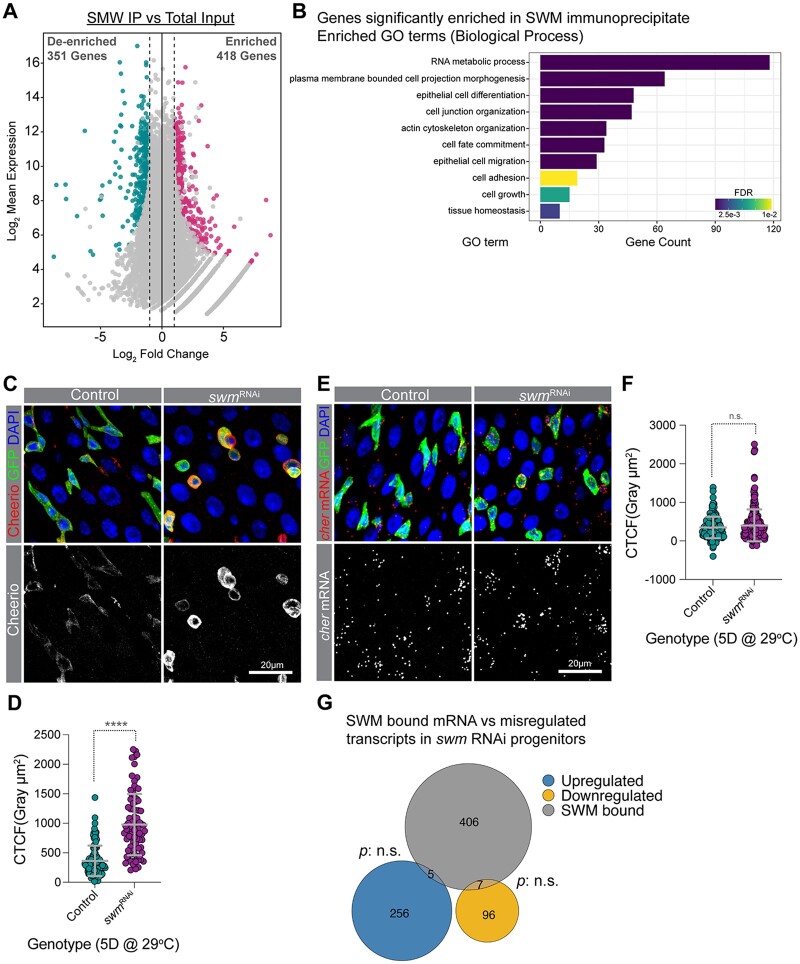
The regulation of stem cell survival, self-renewal, and differentiation is critical for the maintenance of tissue homeostasis. Although the involvement of signaling pathways and transcriptional control mechanisms in stem cell regulation have been extensively investigated, the role of post-transcriptional control is still poorly understood. Here, we show that the nuclear activity of the RNA-binding protein Second Mitotic Wave Missing is critical for Drosophila melanogaster intestinal stem cells and their daughter cells, enteroblasts, to maintain their progenitor cell properties and functions. Loss of swm causes intestinal stem cells and enteroblasts to stop dividing and instead detach from the basement membrane, resulting in severe progenitor cell loss. swm loss is further characterized by nuclear accumulation of poly(A)+ RNA in progenitor cells. Second Mitotic Wave Missing associates with transcripts involved in epithelial cell maintenance and adhesion, and the loss of swm, while not generally affecting the levels of these Second Mitotic Wave Missing-bound mRNAs, leads to elevated expression of proteins encoded by some of them, including the fly ortholog of Filamin. Taken together, this study indicates a nuclear role for Second Mitotic Wave Missing in adult stem cell maintenance, raising the possibility that nuclear post-transcriptional regulation of mRNAs encoding cell adhesion proteins ensures proper attachment of progenitor cells.

Keywords: cheerio; rhea; swm; cell adhesion; intestinal stem cells.


Figures

Fig. 1.
Fig. 1.
Knockdown of swm in intestinal progenitor cells leads poly(A)+ RNA accumulation in nuclei. a) A schematic of intestinal cell types and markers. In this study, we refer to ESG+ cells as progenitor cells (Ps), which include both ISCs and EBs. b) Poly(A)+ RNA distribution in cells from esgTS intestines, labeled by oligo (dT) probes (red) and Ps are labeled with GFP (anti-GFP in green) and nuclei with DAPI (blue). b′) Poly(A)+ RNA distribution is shown in gray scale in Ps (red arrowheads) and ECs (yellow arrowheads). Sections from (c) esgTS and (d) esgTS; swmRNAi PMGs after 5 days at 29°C stained with oligo (dT) (red), GFP (green), and DAPI (blue). e) PMG section from esgTS stained for Swm (anti-Swm in red). Ps are shown in GFP (green), ees are stained for Prospero (anti-Prospero in white) and nuclei for DAPI (blue). Enlarged EC (*), ee (†) and P (Δ) show Swm in gray scale. Individual channels of (e) are shown in Supplementary Fig. 1. (f and g) PMG region from UAS-myr GFP driven by esg-GAL4 stained for Swm (anti-Swm in red) and counterstained for cell membrane of Ps (myr-GFP in green), nucleoli of all cells (anti-Fibrillarin, nuclear green), nuclear membranes of all cells (anti-Lamin in white), and nuclei (DAPI in blue). (g) Enlargement of cells indicated in (e) with individual channels for Swm in red (g′), cell membranes (myr-GFP) and nucleoli (Fibrillarin) in green (g″), nuclear membranes in white (g′′′) and nuclei in blue (g′′′′). Complete genotypes are listed in Supplementary Table 1. P, progenitor cell; EC, enterocyte; ee, enteroendocrine cell; Pros, Prospero; PMG, posterior midgut.
Fig. 2.
Fig. 2.
Depletion of swm results in loss of intestinal progenitor cells. a) Normalized progenitor percentage of esgTS and esgTS; swmRNAi-1 after 1, 2, 5, and 10 days at 29°C (n = 2,689, 4,268, 3,702, and 4,097 for esgTS and 13,040, 4,265, 2,811, and 2,023 for esgTS; swmRNAi-1 total cells from 7 to 8 intestines at the 1D, 2D, 5D, and 10D timepoints, respectively). Representative images of tub-GAL4, UAS-GFP- labeled (b) control, (c) swmF14, and (d) rescued swmF14 homozygous clones stained for Delta (red), GFP (green), and DAPI (blue). Clones are outlined in yellow and ISCs are indicated with white arrow heads. (e) Binned bar plot showing the proportion of total cell number per clone in tub-GAL4, UAS-GFP-labeled control, swmF14, and rescued swmF14 intestines analyzed 7 days ACI. Number of clones per genotype is indicated as n. f) Scatter dot plot of the same samples as in (e) showing the percentage of clones per PMG containing at least one Dl+ ISC. Scatter dot plots showing (g) normalized EC percentage in mex1-GAL4TS (n = 1,610) and mex1-GAL4TS; swmRNAi-1 (n = 1,363) and (h) normalized ee percentage in prosV1-GAL4TS (n = 1,870) and prosV1-GAL4TS; swmRNAi-1 (n = 1,859) intestines analyzed after 7 days at 29°C (n = total cells counted from 6 to 8 intestines). Error bars on plots show mean ± SD and asterisks denote statistical significance from Kruskal–Wallis test (a), ordinary one-way ANOVA (f), and unpaired t-test (g and h). *P < 0.05; **P < 0.01; ***P < 0.001; **** P < 0.0001; n.s., not significant. Complete genotypes are listed in Supplementary Table 1. ACI, after clone induction; EC, enterocyte; ee, enteroendocrine cell; Dl, delta; PMG, posterior midgut.
Fig. 3.
Fig. 3.
Loss of swm leads to loss of ISC/EB activity and identity. a) pH3 (+) cell number per PMG (n = 7 or 8 intestines) of bleomycin fed esgTS and esgTS; swmRNAi-1 intestines after 0, 2, 3, and 5 days at 29°C. PMG section from control (b) and swmRNAi-1 (c) after 5 days at 29°C stained for Ps (anti-RFP for mira-mCherry, in red), ISCs (anti-Dl, in green), EBs (anti-V5 for gbe-smGFP.V5.nls, in white) and all nuclei (DAPI, in blue). Individual channels are shown in gray scale. (d) Binned bar plot showing the quantification of percentage of mira+Dl-gbe- (no defined identity), mira+gbe+ (EB), and mira+Dl+ (ISC) of intestines from genotypes shown in (b) and (c) after 1, 3, and 5 days at 29°C. See Supplementary Fig. 3, a–d for additional statistics. Error bars on plots show mean±SD and asterisks denote statistical significance from Kruskal–Wallis test (a). *P < 0.05; **P < 0.01; ***P < 0.001; ****P < 0.0001; n.s., not significant. Complete genotypes are listed in Supplementary Table 1. P, progenitor cell; ISC, intestinal stem cell; EB, enteroblast; Dl, delta; PMG, posterior midgut.
Fig. 4.
Fig. 4.
In the absence of swm, Intestinal progenitors detach from the basement membrane. PMG section from esgTS (a) and esgTS; swmRNAi-1 (b) after 5 days at 29°C. Ps are labeled by GFP (anti-GFP in green) and nuclei with DAPI (blue). Representative snapshot of 3D reconstructed confocal images of fully attached cell from esgTS (c), fully detached cell from esgTS; swmRNAi-1 (d), and partially detached cell from esgTS; swmRNAi-1 (e) after 5 days at 29°C labeled F-actin (phalloidin-TRITC in red), Ps (anti-GFP in green), and nuclei (DAPI in blue). Apical lumen side is on top and basal VM is on the bottom of images as labeled. f) Binned bar plot showing the quantification of fully detached, fully attached, and partially detached P cell percentages in esgTS control (left) and esgTS; swmRNAi-1 (right) after 1 and 5 days at 29°C. n indicates the number of individual cells used for the quantification across up to 5 intestines in each time point. Complete genotypes are listed in Supplementary Table 1. VM, visceral muscle; P, progenitor cell. Three-dimensional arrangement of fully attached, fully detached, and partially detached cells are shown in Supplementary Videos 1–3.
Fig. 5.
Fig. 5.
Swm binds and post-transcriptionally regulates transcripts related to cell adhesion. a) A scatter dot plot visualizing differentially enriched genes in SWM IP vs total input. Each dot represents a single gene. Cyan and pink dots indicate genes with a false discovery rate (FDR) adjusted P-value <0.05 and a Log2 fold change <−1 or >1, respectively. b) A bar plot showing a selected set of significantly enriched GO terms (biological processes) for genes that are physically associated with Swm. c) Representative confocal micrographs from PMGs of esgTS control (left) and esgTS; swmRNAi-1 (right) after 5 days at 29°C stained for Cheerio (red) and DAPI (blue). Ps are labeled with GFP in green. Bottom panel shows Cheerio staining in gray scale. d) Scatter dot plot of normalized Cheerio fluorescence intensity (corrected total cell fluorescence, CTCF) of progenitor cells from esgTS (n = 95 cells, 8 intestines) and esgTS; swmRNAi-1 (n = 84 cells, 7 intestines) after 5 days at 29°C. e) Intestinal progenitors from PMGs of esgTS control (left) and esgTS; swmRNAi-1 (right) after 5 days at 29°C labeled cheerio mRNA (red), Ps stained for GFP (anti-GFP in green) and nuclei with DAPI (blue). Bottom panel shows cheerio mRNA in gray scale. f) Scatter dot plot of normalized cheerio mRNA fluorescence intensity (CTCF) of progenitor cells from genotypes in F (n = 167 cells, 7 intestines for esgTS and n = 241 cells, 10 intestines for esgTS; swmRNAi-1). g) Venn diagram showing the overlap between genes enriched in SWM-CLIP (gray) and genes that are upregulated (blue) or downregulated (yellow) in swm depleted progenitor cells identified from RNAseq. Error bars on plots show mean ± SD and asterisks denote statistical significance from Mann–Whitney test (d, f). *P < 0.05; **P < 0.01; ***P < 0.001; ****P < 0.0001; n.s., not significant. Complete genotypes are listed in Supplementary Table 1. PMG, posterior midgut; P, progenitor cell; CTCF, corrected total cell fluorescence.

References

    1. Amcheslavsky A, Jiang J, Ip YT.. Tissue damage-induced intestinal stem cell division in Drosophila. Cell Stem Cell. 2009;4(1):49–61. - PMC - PubMed
    1. Amcheslavsky A, Song W, Li Q, Nie Y, Bragatto I, Ferrandon D, Perrimon N, Ip YT.. Enteroendocrine cells support intestinal stem cell-mediated homeostasis in Drosophila. Cell Rep. 2014;9(1):32–39. - PMC - PubMed
    1. Antonello ZA, Reiff T, Ballesta-Illan E, Dominguez M.. Robust intestinal homeostasis relies on cellular plasticity in enteroblasts mediated by miR-8–Escargot switch. EMBO J. 2015;34(15):2025–2041. - PMC - PubMed
    1. Balakireva M, Stocker RF, Gendre N, Ferveur J-F.. Voila, a new Drosophila courtship variant that affects the nervous system: behavioral, neural, and genetic characterization. J Neurosci. 1998;18(11):4335–4343. - PMC - PubMed
    1. Biteau B, Hochmuth CE, Jasper H.. Maintaining tissue homeostasis: dynamic control of somatic stem cell activity. Cell Stem Cell. 2011;9(5):402–411. - PMC - PubMed

Publication types

MeSH terms

LinkOut - more resources