Meta-Analysis
. 2022 Sep;65(9):1495-1509.
doi: 10.1007/s00125-022-05735-0. Epub 2022 Jun 28.

Genome-wide meta-analysis and omics integration identifies novel genes associated with diabetic kidney disease

Affiliations
Meta-Analysis

Genome-wide meta-analysis and omics integration identifies novel genes associated with diabetic kidney disease

Niina Sandholm et al. Diabetologia. 2022 Sep.

Abstract

Aims/hypothesis: Diabetic kidney disease (DKD) is the leading cause of kidney failure and has a substantial genetic component. Our aim was to identify novel genetic factors and genes contributing to DKD by performing meta-analysis of previous genome-wide association studies (GWAS) on DKD and by integrating the results with renal transcriptomics datasets.

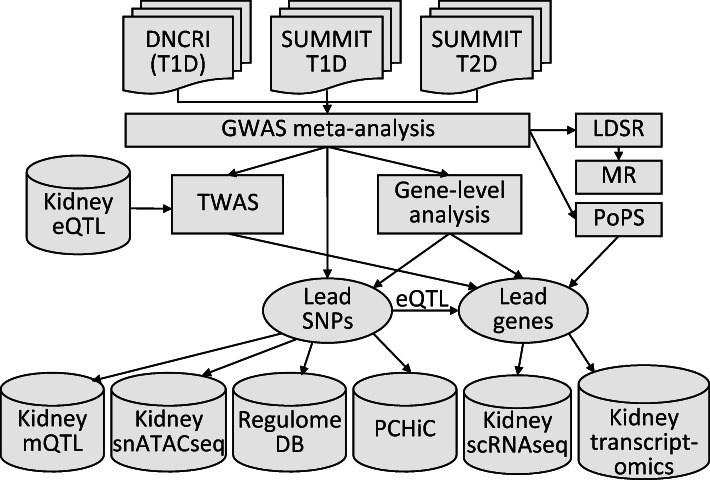
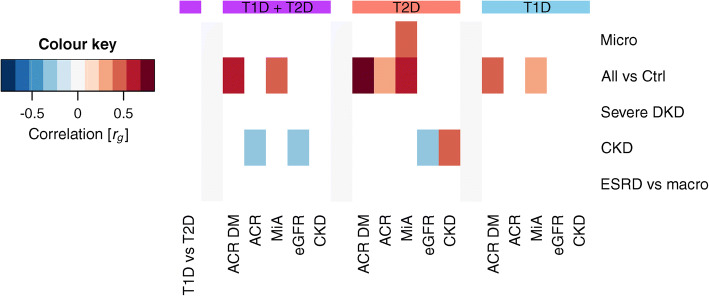
Methods: We performed GWAS meta-analyses using ten phenotypic definitions of DKD, including nearly 27,000 individuals with diabetes. Meta-analysis results were integrated with estimated quantitative trait locus data from human glomerular (N=119) and tubular (N=121) samples to perform transcriptome-wide association study. We also performed gene aggregate tests to jointly test all available common genetic markers within a gene, and combined the results with various kidney omics datasets.

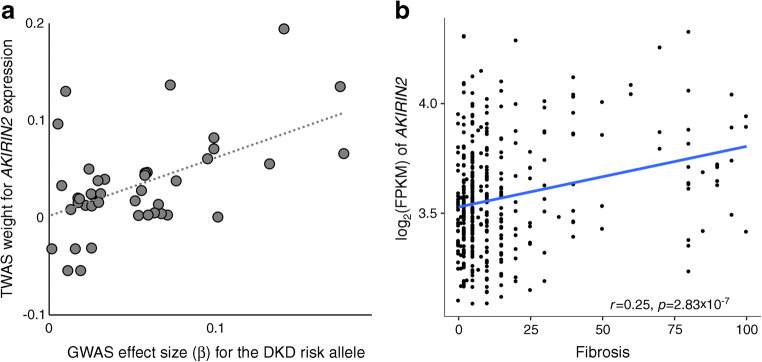
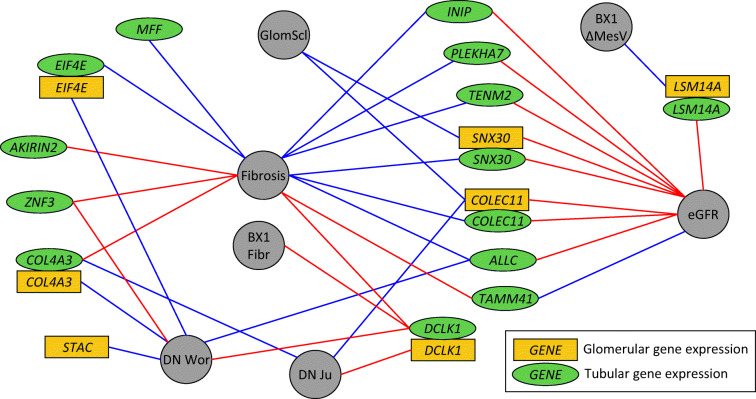
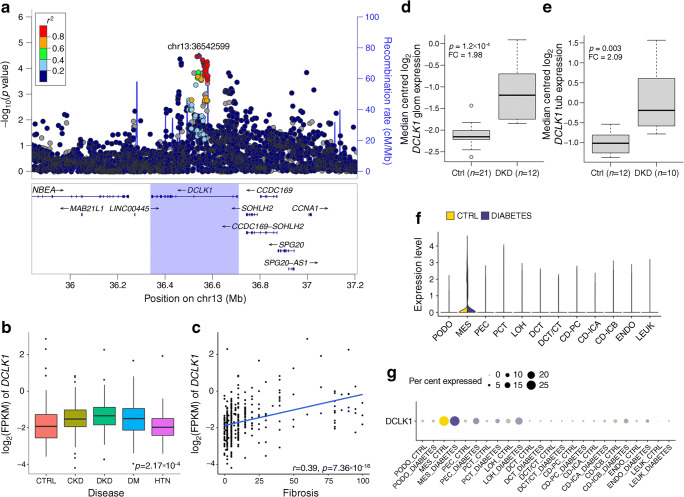
Results: The meta-analysis identified a novel intronic variant (rs72831309) in the TENM2 gene associated with a lower risk of the combined chronic kidney disease (eGFR<60 ml/min per 1.73 m2) and DKD (microalbuminuria or worse) phenotype (p=9.8×10⁻⁹; although not withstanding correction for multiple testing, p>9.3×10⁻⁹). Gene-level analysis identified ten genes associated with DKD (COL20A1, DCLK1, EIF4E, PTPRN-RESP18, GPR158, INIP-SNX30, LSM14A and MFF; p<2.7×10⁻⁶). Integration of GWAS with human glomerular and tubular expression data demonstrated higher tubular AKIRIN2 gene expression in individuals with vs without DKD (p=1.1×10⁻⁶). The lead SNPs within six loci significantly altered DNA methylation of a nearby CpG site in kidneys (p<1.5×10⁻¹¹). Expression of lead genes in kidney tubules or glomeruli correlated with relevant pathological phenotypes (e.g. TENM2 expression correlated positively with eGFR [p=1.6×10⁻⁸] and negatively with tubulointerstitial fibrosis [p=2.0×10⁻⁹], tubular DCLK1 expression correlated positively with fibrosis [p=7.4×10⁻¹⁶], and SNX30 expression correlated positively with eGFR [p=5.8×10⁻¹⁴] and negatively with fibrosis [p<2.0×10⁻¹⁶]).

Conclusions/interpretation: Altogether, the results point to novel genes contributing to the pathogenesis of DKD.

Data availability: The GWAS meta-analysis results can be accessed via the type 1 and type 2 diabetes (T1D and T2D, respectively) and Common Metabolic Diseases (CMD) Knowledge Portals, and downloaded on their respective download pages ( https://t1d.hugeamp.org/downloads.html ; https://t2d.hugeamp.org/downloads.html ; https://hugeamp.org/downloads.html ).

Keywords: Diabetes complications; Diabetic kidney disease; Genetics; Genome-wide association study; Meta-analysis; Transcriptomics.


Figures

Fig. 1
Fig. 1
Schematic illustration of the study design, from GWAS meta-analysis to integration with various omics data sets. GWAS meta-analysis for ten different phenotypic definitions of DKD included up to 26,785 individuals with either type 1 or type 2 diabetes from the previous DNCRI and SUMMIT GWAS meta-analyses. The TWAS integrated the GWAS meta-analysis results with kidney eQTL data for tubular and glomerular compartments, identifying genes with differential expression in DKD. The mQTL data identified SNPs associated with DNA methylation at CpG sites. Single nucleus Assay for Transposase-Accessible Chromatin using sequencing (snATACseq) was informative of chromatin openness in various kidney cell types. The RegulomeDB is a database with extensive epigenetic annotation for SNPs. The promoter capture HiC (PCHiC) sequencing data identified sequence interaction with gene promoters, proposing target genes. Kidney transcriptomics provided data on gene expression in glomerular and tubular tissue in nephrectomy samples, or in Pima Indian biopsies, correlated with various renal variables. scRNAseq, single-cell RNA sequencing; T1D, type 1 diabetes; T2D, type 2 diabetes
Fig. 2
Fig. 2
TENM2 gene rs72831309 is associated with CKD–DKD. (a) Regional association plot of the meta-analysis results. (b) Forest plot of association across the contributing cohorts from DNCRI (FinnDiane, JOSLIN, UK-ROI, GWU_GoKinD) [6], SUMMIT-T1D (EURODIAB) [4] and SUMMIT-T2D studies [12]. (c) SNP rs72831309 overlaps a predicted CREB1 binding motif sequence; data from RegulomeDB.org (v.2.0.3). (d) Human kidney single-cell RNA expression of TENM2, showing strongest expression in podocytes, parietal epithelial cells and proximal convoluted tubules. (e, f) Tubular TENM2 expression is correlated with higher eGFR (e) and less fibrosis (f). CD, collecting duct; CT, connecting tubule; CTRL, control; DCT, distal convoluted tubule; ENDO, endothelium; FPKM, fragments per kilo base of transcript per million mapped fragments; GWU_GoKinD, George Washington University Genetics of Kidney in Diabetes; IC, intercalated cell (A/B); JOSLIN, Joslin Diabetes Center participants; LEUK, leucocyte; LOH, loop of Henle; MES, mesangial cells; PC, principal cell; PCT, proximal convoluted tubule; PEC, parietal epithelial cells; PODO, podocytes; T2D meta, meta-analysis of type 2 diabetes cohorts
Fig. 3
Fig. 3
TWAS indicates increased AKIRIN2 expression in severe DKD. (a) The GWAS SNP effect sizes for association with severe DKD (normal AER vs macroalbuminuria or ESRD) are correlated with TWAS eQTL weights to predict AKIRIN2 expression, suggesting that elevated AKIRIN2 levels in tubules are associated with severe DKD (p=1.1×10⁻⁶). The eQTL data for 39 SNPs explained 5% of the variance in tubular AKIRIN2 expression (p=0.01). (b) AKIRIN2 expression is correlated with renal fibrosis. FPKM, fragments per kilo base of transcript per million mapped fragments
Fig. 4
Fig. 4
Tubular and glomerular gene expression of the lead genes correlates with multiple morphological and pathological renal variables and with DKD. Golden rectangles indicate glomerular gene expression, green ellipses tubular gene expression, and grey circles the morphological phenotypes. Blue lines indicate negative correlation and red lines indicate positive correlation. Correlation with fibrosis, glomerulosclerosis (GlomScl) and eGFR were measured in the nephrectomy samples [22]; correlations with p<2.2×10⁻⁴ (corrected for 29 genes, two tissues and four tests) are shown. For the biopsy data in Pima Indians, suggestive correlations with p<8.6×10⁻⁴ are shown (corrected only for 29 genes and two tissues), including fibrosis at first biopsy and change in the mesangial volume between the first and the second biopsies. Association with DKD (diabetic nephropathy) was queried in two data sets (Woroniecka et al [36] and Ju et al [35]), with p<4.3×10⁻⁴ or p<0.05 and fold change>1.5. BX1 Fibr, fibrosis at first biopsy; BX1 ΔMesV, change in the mesangial volume between the first and the second biopsies; DN Wor, diabetic nephropathy in Woroniecka et al [36]; DN Ju, diabetic nephropathy in Ju et al [35]; GlomScl, glomerulosclerosis
Fig. 5
Fig. 5
Genetic correlation between DKD phenotypes (y-axis) and kidney phenotypes in the general population (x-axis). Correlations were calculated with LD score regression for the whole meta-analysis (any diabetes, purple), type 2 diabetes only (red), and type 1 diabetes only (blue). The first column (purple) indicates genetic correlation for the DKD phenotypes between individuals with type 1 or type 2 diabetes (none significant). Only significant correlations (p<0.01) are shown. General population GWAS results were taken from CKDgen consortium: ACR [30]; ACR in diabetes [30]; microalbuminuria [30]; eGFR [32]; and CKD [31]. ACR DM, ACR in diabetes; Ctrl, control; ESRD vs macro, ESRD vs macroalbuminuria comparison; MiA, microalbuminuria; Micro, microalbuminuria (in current study); T1D, type 1 diabetes; T2D, type 2 diabetes
Fig. 6
Fig. 6
Genetic correlation between DKD phenotypes and various traits based on LDSR, and estimates of causal associations based on MR. (a) For LDSR only significant trait combinations are shown (p<0.05/78=6.4×10−4). (b) MR results for DKD (All vs Ctrl comparison) with inverse variance-weighted method for the traits significant in LDSR (‘mother’s age at death’ had fewer than than five genome-wide significant SNPs and thus, was not included in MR). Horizontal bars represent 95% CI. Ctrl, control
Fig. 7
Fig. 7
DCLK1 is associated with ESRD. (a) The DCLK1 gene region was associated with ESRD vs macroalbuminuria in the MAGMA gene-level analysis (p=1.39×10⁻⁶). (b, c) Tubular DCLK1 expression is highest in DKD (p=2.17×10⁻⁴) (b) and correlated with the level of fibrosis (c) in the nephrectomy samples. (d) Glomerular DCLK1 expression is higher in DKD than in healthy controls (Ju et al [35]: fold change 1.98, p=1.2×10⁻⁴). (e) Tubular DCLK1 expression is higher in DKD than in healthy controls (Woroniecka et al [36]: fold change 2.09, p=0.003). (f, g) Kidney DCLK1 expression is strongest in mesangial cells in human single-cell RNA sequencing data from individuals with diabetes and healthy controls [34]. In boxplots (b, d, e) the centrelines show the medians; box limits indicate the 25th and 75th percentiles; whiskers extend from the hinge to the most extreme value no further than 1.5 × the IQR (i.e. the distance between the first and third quartiles). CD, collecting duct; CT, connecting tubule; CTRL, control; DCT, distal convoluted tubule; DM, diabetes mellitus; ENDO, endothelium; FC, fold change; FPKM, fragments per kilobase of transcript per million mapped fragments; glom, glomerular; HTN, hypertension; IC, intercalated cell (A/B); LEUK, leucocyte; LOH, loop of Henle; MES, mesangial cells; PC, principal cell; PCT, proximal convoluted tubule; PEC, parietal epithelial cells; PODO, podocytes; tub, tubular

References

    1. Harjutsalo V, Thomas MC, Forsblom C, Groop P-H, FinnDiane Study Group Risk of coronary artery disease and stroke according to sex and presence of diabetic nephropathy in type 1 diabetes. Diabetes Obes Metab. 2018;20(12):2759–2767. doi: 10.1111/dom.13456. - DOI - PubMed
    1. Groop PH, Thomas MC, Moran JL, et al. The presence and severity of chronic kidney disease predicts all-cause mortality in type 1 diabetes. Diabetes. 2009;58(7):1651–1658. doi: 10.2337/db08-1543. - DOI - PMC - PubMed
    1. World Health Organization (2020) The top 10 causes of death. https://www.who.int/news-room/fact-sheets/detail/the-top-10-causes-of-death. 9 Dec 2020
    1. Sandholm N, Van Zuydam N, Ahlqvist E, et al. The Genetic Landscape of Renal Complications in Type 1 Diabetes. J Am Soc Nephrol. 2017;28(2):557–574. doi: 10.1681/ASN.2016020231. - DOI - PMC - PubMed
    1. Harjutsalo V, Katoh S, Sarti C, Tajima N, Tuomilehto J. Population-based assessment of familial clustering of diabetic nephropathy in type 1 diabetes. Diabetes. 2004;53(9):2449–2454. doi: 10.2337/diabetes.53.9.2449. - DOI - PubMed

Publication types

MeSH terms

Substances