. 2022 Aug 3;33(8):1499-1509.
doi: 10.1021/jasms.2c00093. Epub 2022 Jun 28.

Fine Structure in Isotopic Peak Distributions Measured Using Fourier Transform Ion Cyclotron Resonance Mass Spectrometry: A Comparison between an Infinity ICR Cell and a Dynamically Harmonized ICR Cell

Affiliations

Fine Structure in Isotopic Peak Distributions Measured Using Fourier Transform Ion Cyclotron Resonance Mass Spectrometry: A Comparison between an Infinity ICR Cell and a Dynamically Harmonized ICR Cell

Jingsha Xu et al. J Am Soc Mass Spectrom. .

Abstract

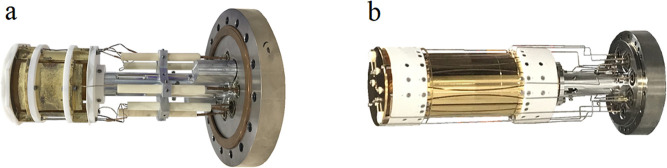
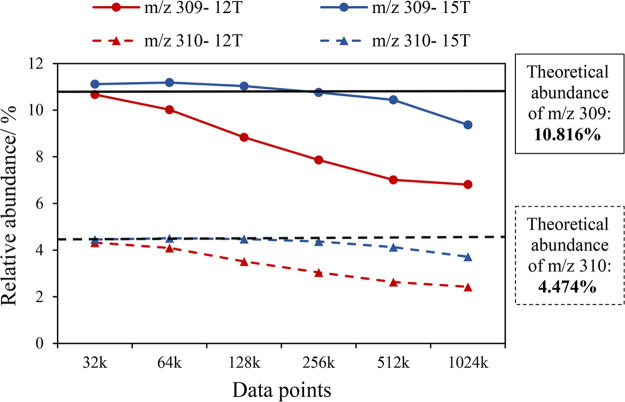
The fine structure of isotopic peak distributions of glutathione in mass spectra is measured using Fourier transform ion cyclotron resonance mass spectrometry (FT-ICR MS) at 12 and 15 T magnetic field, with an infinity cell and a dynamically harmonized cell (DHC) respectively. The resolved peaks in the fine structure of glutathione consist of 2H, 13C, 15N, 17O, 18O, 33S, 34S, 36S, and combinations of them. The positions of the measured fine structure peaks agree with the simulated isotopic distributions with the mass error less than 250 ppb in broadband mode for the infinity cell and no more than 125 ppb with the DHC after internal calibration. The 15 T FT-ICR MS with DHC cell also resolved around 30 isotopic peaks in broadband with a resolving power (RP) of 2 M. In narrowband (m/z 307-313), our current highest RP of 13.9 M in magnitude mode was observed with a 36 s transient length by the 15 T FT-ICR MS with the DHC and 2ω detection on the 15 T offers slightly higher RP (14.8 M) in only 18 s. For the 12 T FT-ICR MS with the infinity cell, the highest RP achieved was 15.6 M in magnitude mode with a transient length of 45 s. Peak decay was observed for low abundance peaks, which could be due to the suppression effects from the most abundant peak, as result of ion cloud Coulombic interactions (space-charge).


Conflict of interest statement

The authors declare no competing financial interest.

Figures

Figure 1
Figure 1
(a) Infinity cell; (b) dynamically harmonized cell (DHC).
Figure 2
Figure 2
Complete pattern spectra of glutathione acquired in broadband mode using (left) 15 T with a Dynamically Harmonized ICR cell and (right) 12 T with an Infinity ICR cell. Black spectra marked with “S” are the simulated fine structure pattern, and the red spectra marked with “M” are the measured fine structure pattern.
Figure 3
Figure 3
Magnification of the isotopic peak clusters of glutathione.
Figure 4
Figure 4
Highest resolving power observed for the monoisotopic peak of glutathione in narrowband (m/z 307–313) by (a) 15 T FT-ICR MS with a dynamically harmonized cell by 1-omega detection and (b) 12 T FT-ICR MS with an infinity cell. (Top) Mass spectra. (Down) Transient signal, single scan data shown.
Figure 5
Figure 5
Relative abundance of the two most abundant isotopic peaks of glutathione measured by 12 T FT-ICR MS with an infinity ICR cell and 15 T FT-ICR MS with a dynamically harmonized ICR cell under different size of data points, based on 50 scans.
Figure 6
Figure 6
Segmented peak intensities of the three most abundant peaks of glutathione measured by (a) 12 T FT-ICR MS with an infinity ICR cell and (b) 15 T FT-ICR MS with a dynamically harmonized ICR cell; each point represent a segment of 1/32 of the total transient length. Cumulative peak intensities of the three most abundant peaks of glutathione measured by (c) 12 T FT-ICR MS with an infinity ICR cell and (d) 15 T FT-ICR MS with a dynamically harmonized ICR cell.
Figure 7
Figure 7
PCD curve measured by 15 T FT-ICR MS with dynamically harmonized cell in 2ω detection mode.
Figure 8
Figure 8
Highest resolving power observed for the monoisotopic peak of glutathione in narrowband (m/z 307–313) by 15 T FT-ICR MS with dynamically harmonized cell in 2ω detection mode. (Top) mass spectra; (down) transient signal, single scan data shown.

References

    1. Wei J.; Antzutkin O. N.; Filippov A. V.; Iuga D.; Lam P. Y.; Barrow M. P.; Dupree R.; Brown S. P.; O’Connor P. B. Amyloid Hydrogen Bonding Polymorphism Evaluated by 15n{17o}Reapdor Solid-State Nmr and Ultra-High Resolution Fourier Transform Ion Cyclotron Resonance Mass Spectrometry. Biochem. 2016, 55 (14), 2065–2068. 10.1021/acs.biochem.5b01095. - DOI - PubMed
    1. Thompson C. J.; Witt M.; Forcisi S.; Moritz F.; Kessler N.; Laukien F. H.; Schmitt-Kopplin P. An Enhanced Isotopic Fine Structure Method for Exact Mass Analysis in Discovery Metabolomics: Fia-Casi-Ftms. J. Am. Soc. Mass Spectrom. 2020, 31 (10), 2025–2034. 10.1021/jasms.0c00047. - DOI - PubMed
    1. Nikolaev E. N.; Jertz R.; Grigoryev A.; Baykut G. Fine Structure in Isotopic Peak Distributions Measured Using a Dynamically Harmonized Fourier Transform Ion Cyclotron Resonance Cell at 7 T. Anal. Chem. 2012, 84 (5), 2275–2283. 10.1021/ac202804f. - DOI - PubMed
    1. Ghaste M.; Mistrik R.; Shulaev V. Applications of Fourier Transform Ion Cyclotron Resonance (Ft-Icr) and Orbitrap Based High Resolution Mass Spectrometry in Metabolomics and Lipidomics. Int. J. Mol. Sci. 2016, 17 (6), 816.10.3390/ijms17060816. - DOI - PMC - PubMed
    1. Denisov E.; Damoc E.; Makarov A. Exploring Frontiers of Orbitrap Performance for Long Transients. Int. J. Mass Spectrom. 2021, 466, 116607.10.1016/j.ijms.2021.116607. - DOI