. 2022 Jul 7;185(14):2434-2451.e17.
doi: 10.1016/j.cell.2022.05.022. Epub 2022 May 27.

Humoral and cellular immune memory to four COVID-19 vaccines

Affiliations

Humoral and cellular immune memory to four COVID-19 vaccines

Zeli Zhang et al. Cell. .

Abstract

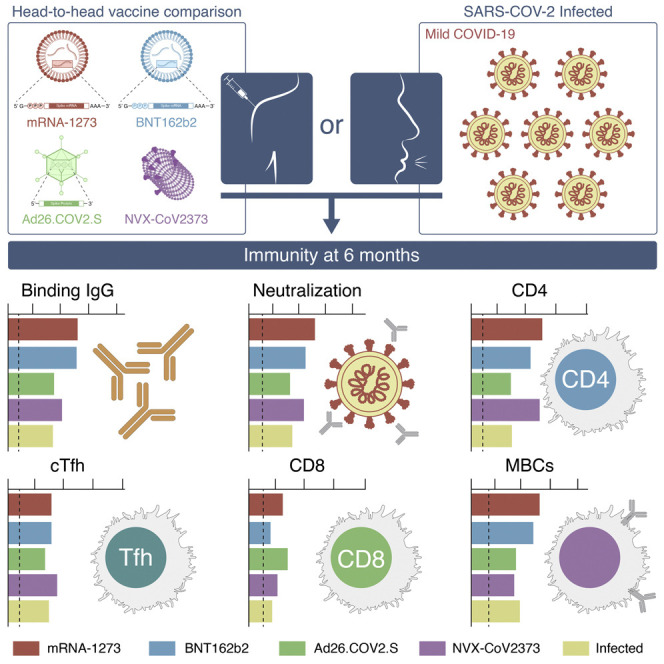
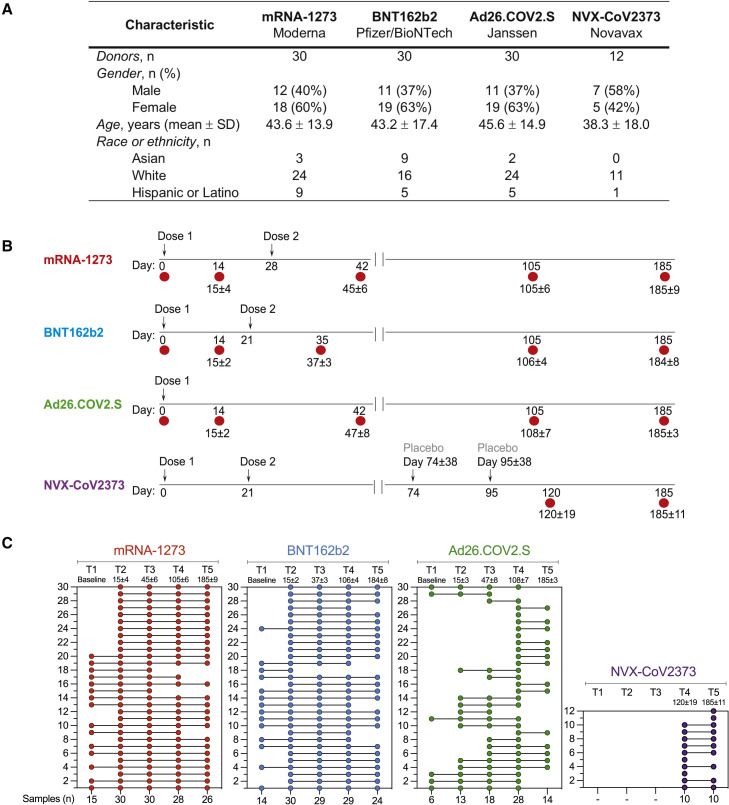
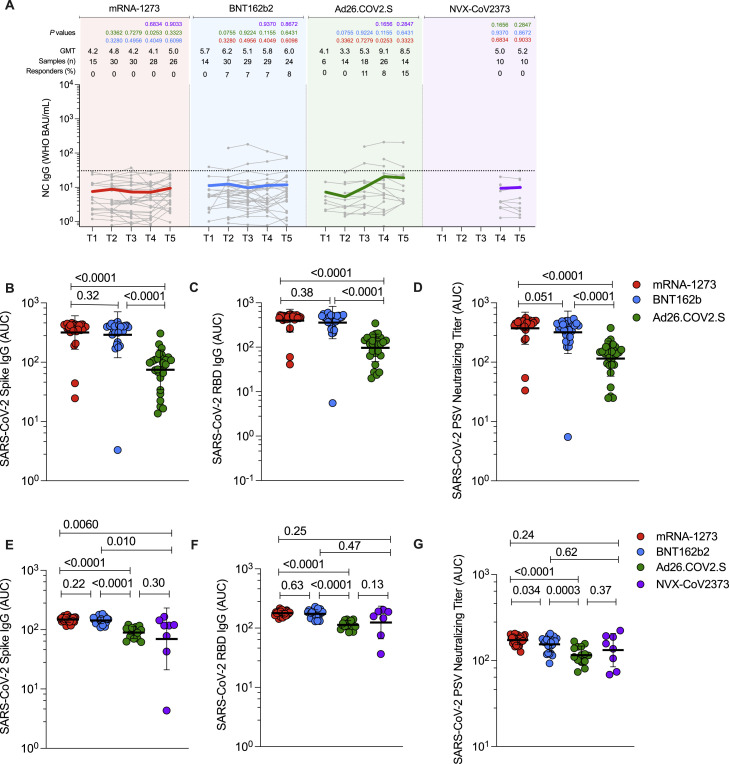
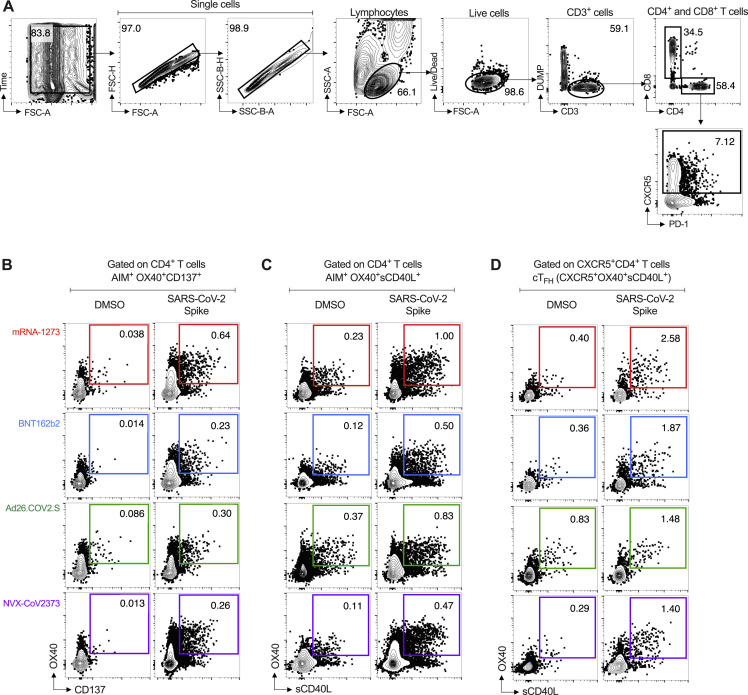
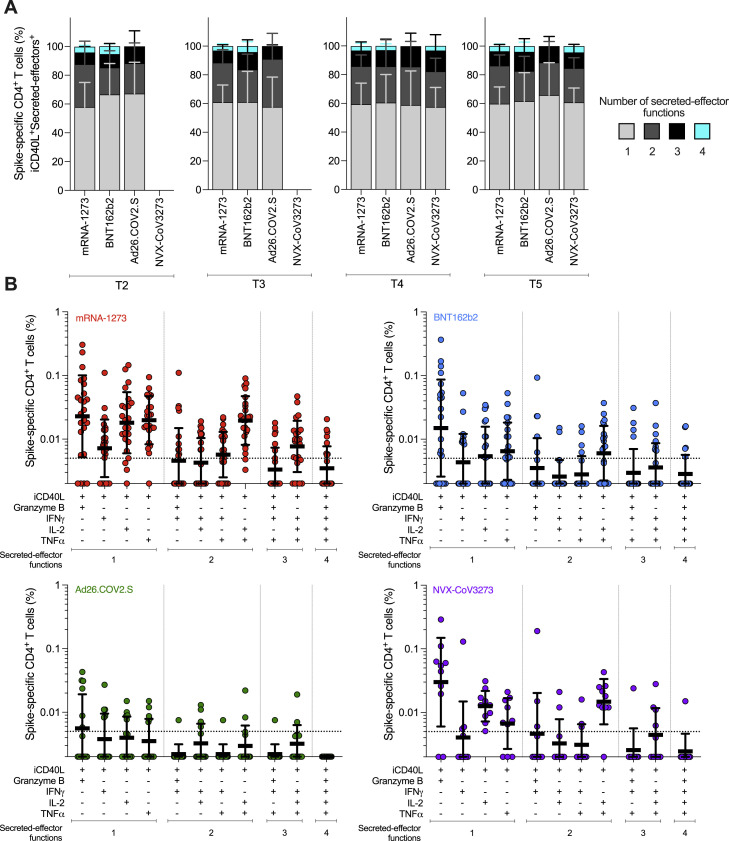
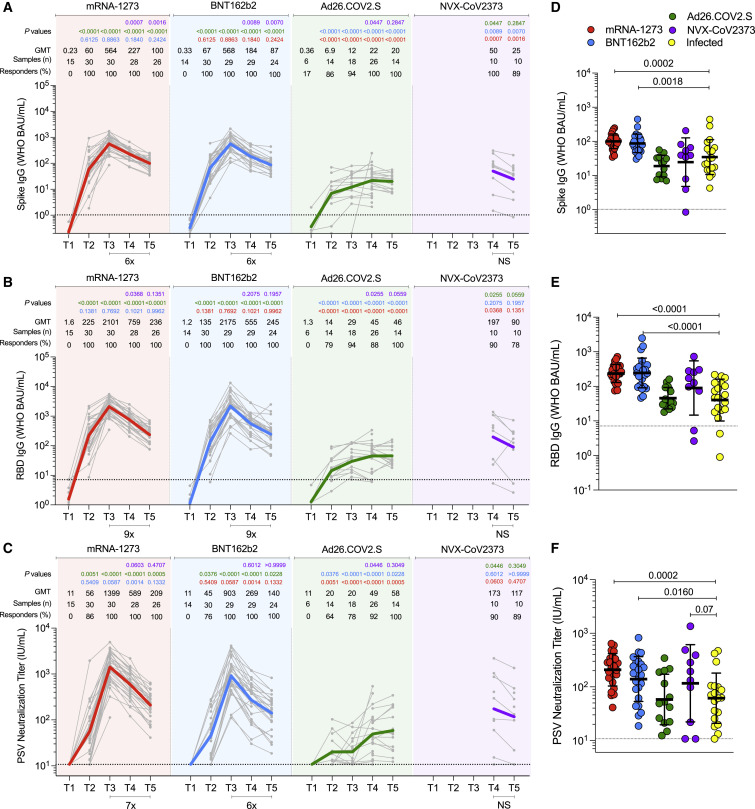
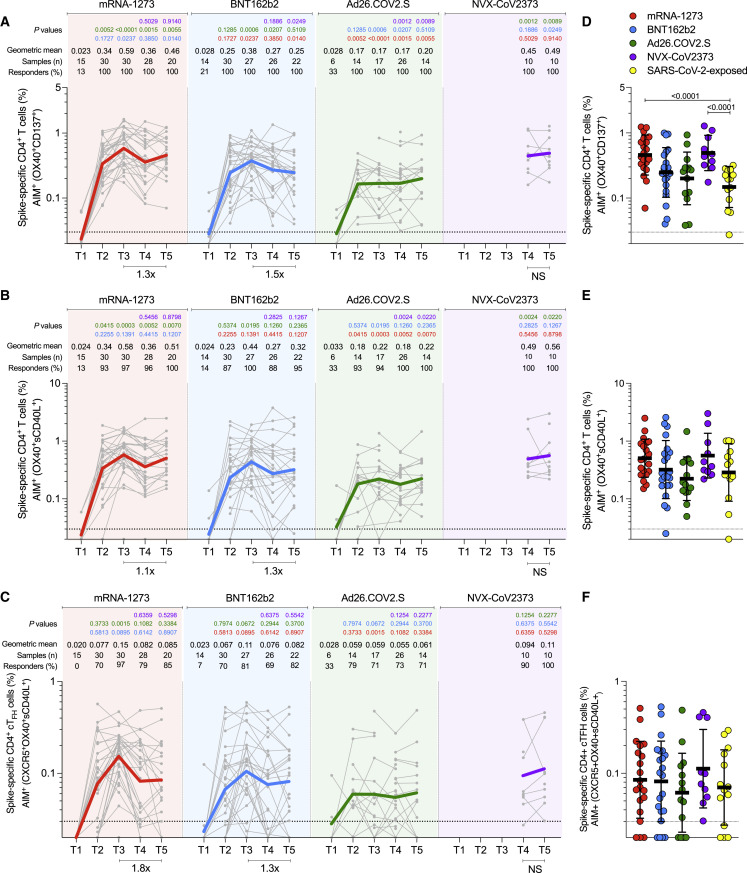
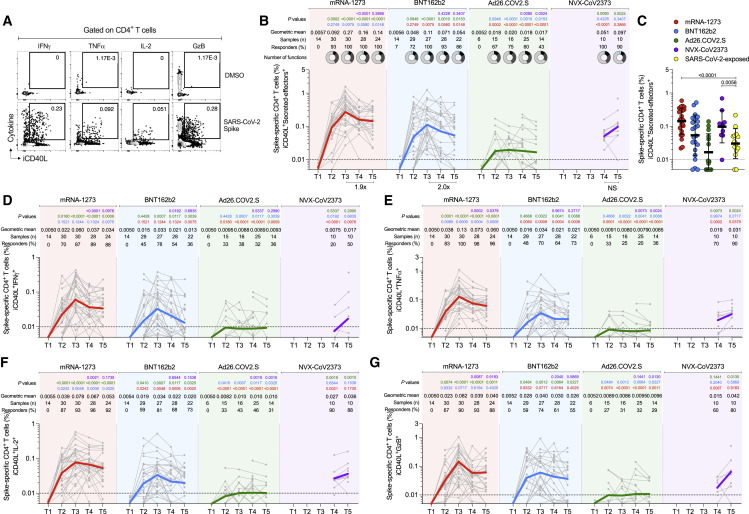
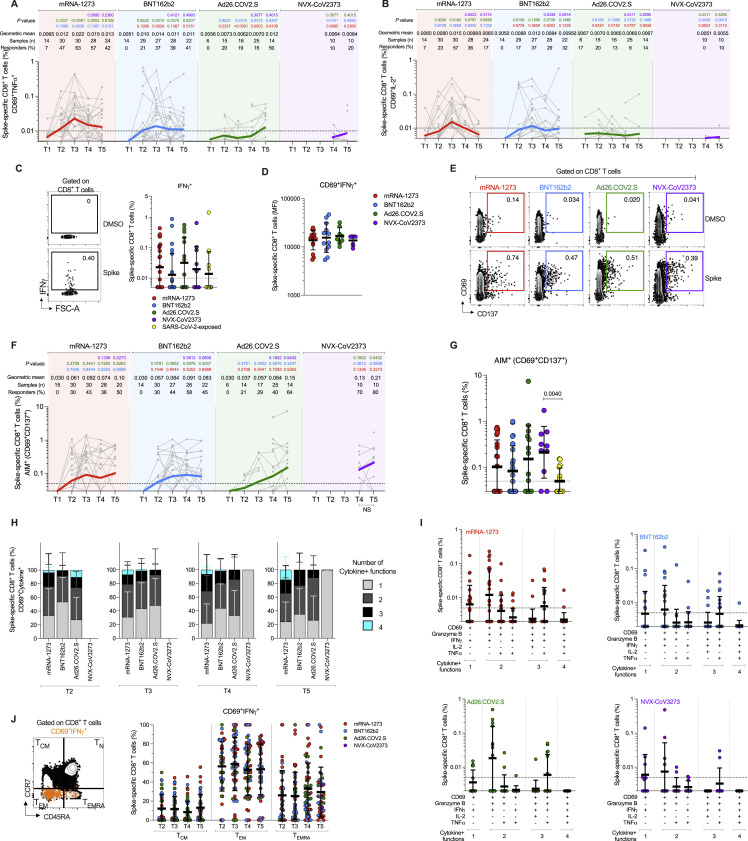
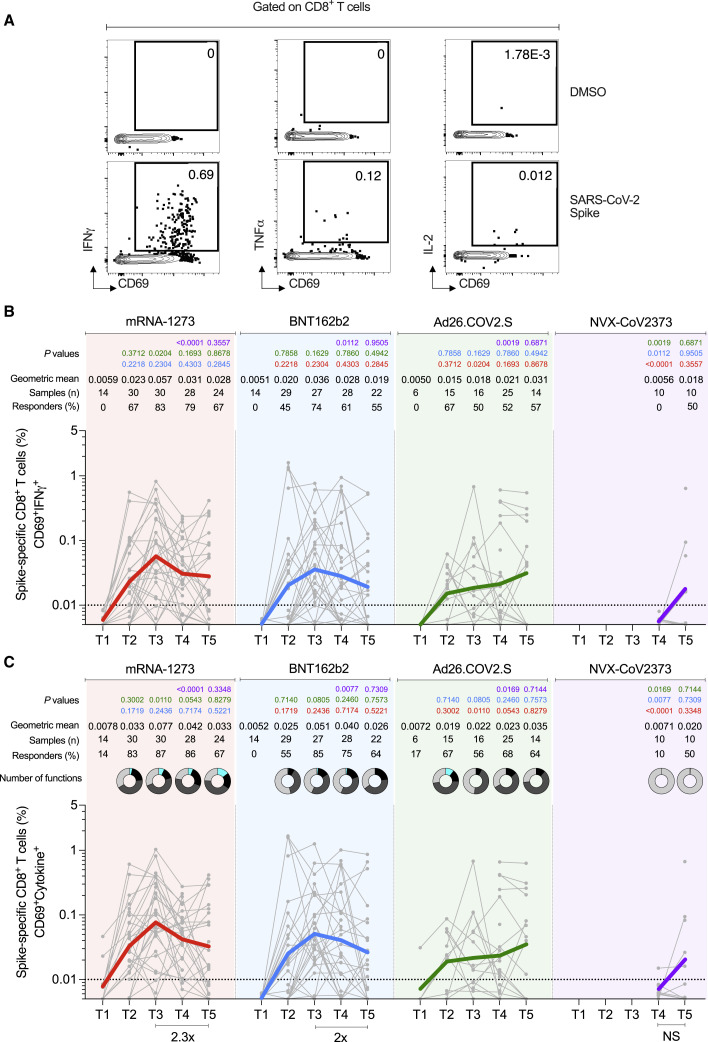
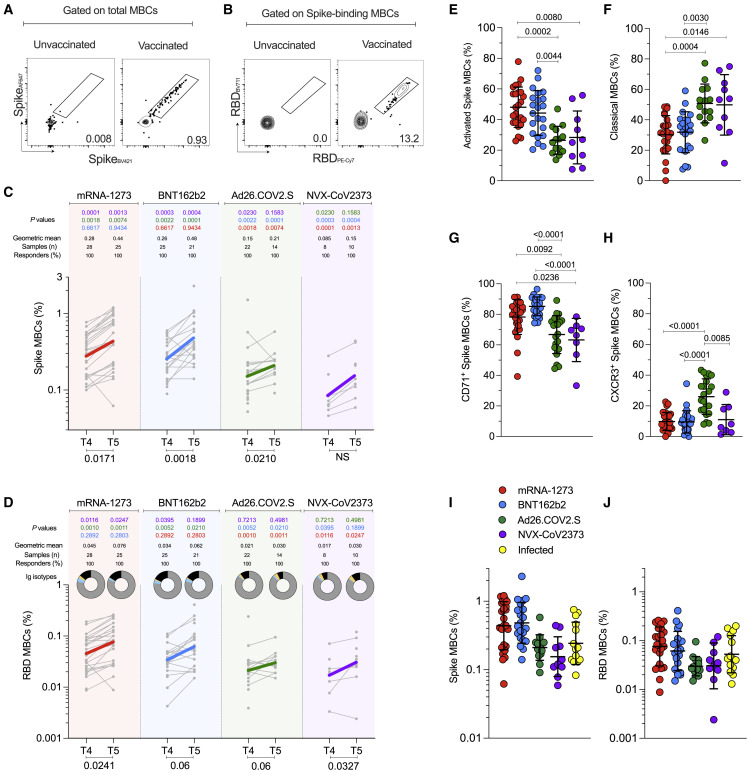
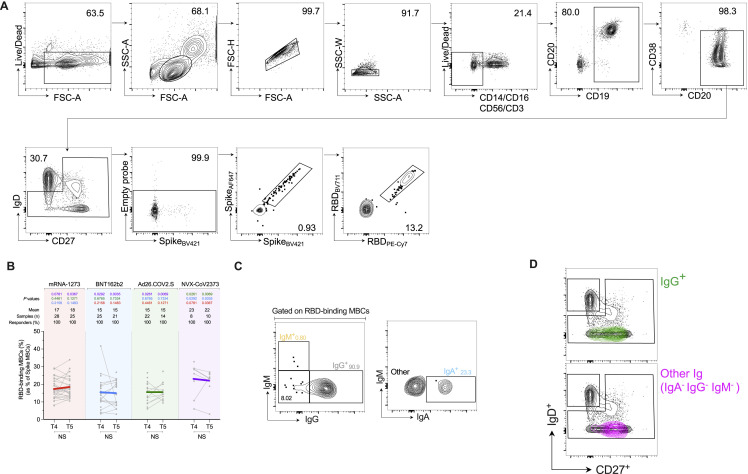
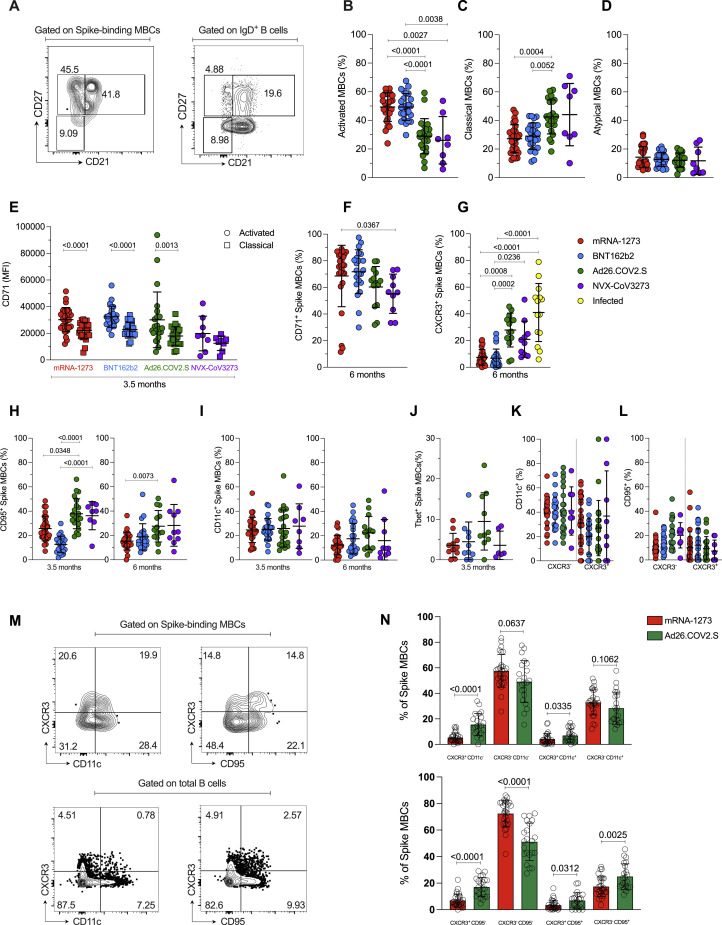
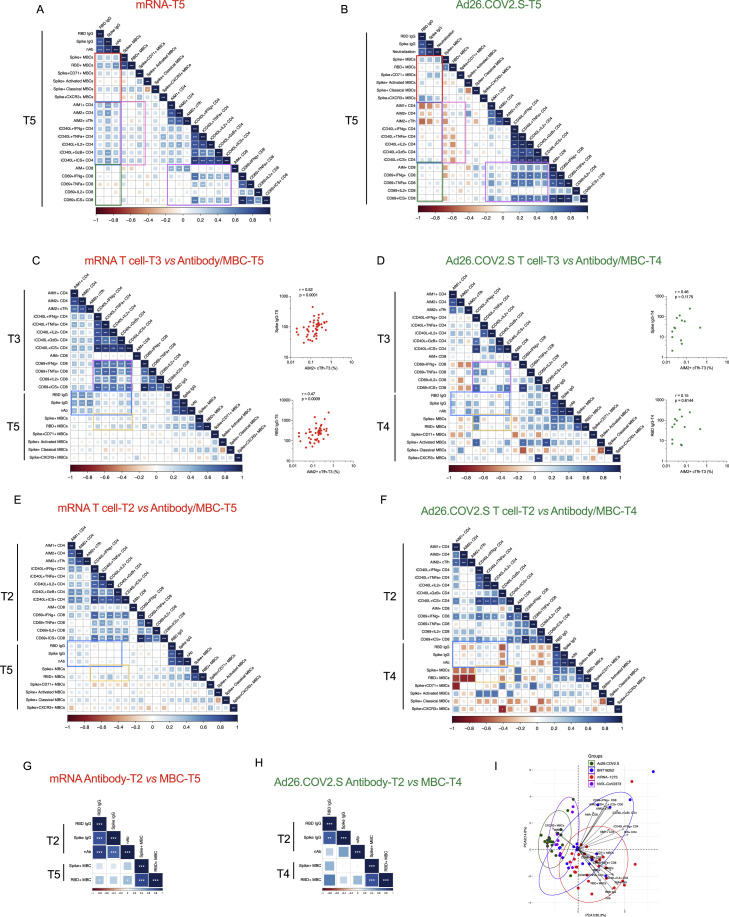
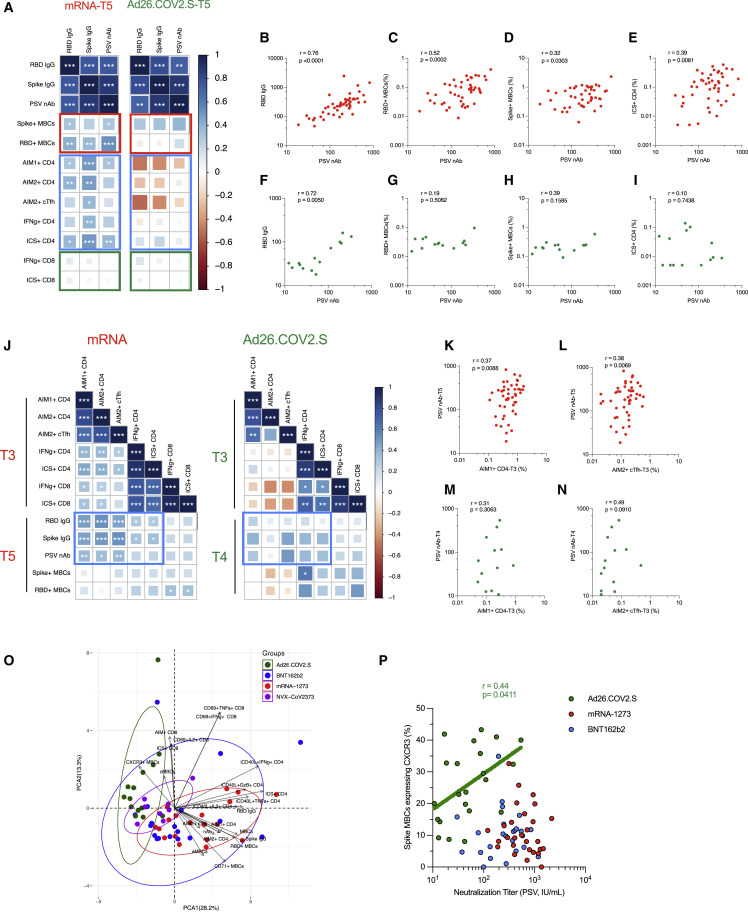
Multiple COVID-19 vaccines, representing diverse vaccine platforms, successfully protect against symptomatic COVID-19 cases and deaths. Head-to-head comparisons of T cell, B cell, and antibody responses to diverse vaccines in humans are likely to be informative for understanding protective immunity against COVID-19, with particular interest in immune memory. Here, SARS-CoV-2-spike-specific immune responses to Moderna mRNA-1273, Pfizer/BioNTech BNT162b2, Janssen Ad26.COV2.S, and Novavax NVX-CoV2373 were examined longitudinally for 6 months 100% of individuals made memory CD4+ T cells, with cTfh and CD4-CTL highly represented after mRNA or NVX-CoV2373 vaccination. mRNA vaccines and Ad26.COV2.S induced comparable CD8+ T cell frequencies, though only detectable in 60-67% of subjects at 6 months. A differentiating feature of Ad26.COV2.S immunization was a high frequency of CXCR3+ memory B cells. mRNA vaccinees had substantial declines in antibodies, while memory T and B cells were comparatively stable. These results may also be relevant for insights against other pathogens.

Keywords: COVID-19 vaccine; SARS-COV2; cellular immunity; humoral immunity; immune memory.


Conflict of interest statement

Declaration of interests A.S. is a consultant for Gritstone Bio, Flow Pharma, ImmunoScape, Avalia, Moderna, Fortress, Repertoire, Gerson Lehrman Group, RiverVest, MedaCorp, and Guggenheim. S.C. has consulted for GSK, JP Morgan, Citi, Morgan Stanley, Avalia NZ, Nutcracker Therapeutics, University of California, California State Universities, United Airlines, Adagio, and Roche. LJI has filed for patent protection for various aspects of T cell epitope and vaccine design work. All other authors declare no conflict of interest.

Figures

None
Graphical abstract
Figure 1
Figure 1
COVID-19 vaccine recipient cohorts (A) Donor cohort characteristics. (B) The timeline of immunizations and bleeds for each vaccine is shown. Arrows indicate immunizations, red circles indicate bleeds, and the numbers below red circles indicate the days after the first-immunization. See method details for detailed information. (C) Subjects received mRNA-1273, BNT162b2, Ad26.COV2.S, or NVX-CoV2373 vaccine and donated blood at different times post-vaccination. Each COVID-19 vaccine cohort is color-coded: mRNA-1273 (red), BNT162b2 (blue), Ad26.COV2.S (green), or NVX-CoV2373 (purple). The first column displays the number of donors included in each vaccine cohort, and the bottom row shows the number of samples collected for each time point.
Figure S1
Figure S1
Antibodies elicited by mRNA-1273, BNT162b2, Ad26.COV2.S, and NVX-CoV2373 COVID-19 vaccine platforms. Related to Figure 2 (A) Comparison of longitudinal SARS-CoV-2 spike Nucleocapsid (NC) levels from all donors to the mRNA-1273 (red), BNT162b2 (blue), Ad26.COV2.S (green) and NVX-CoV2373 (purple) over 6 months. Individual subjects are show as gray symbols with connecting lines for longitudinal samples. Geometric means of overall responses are shown in thick colored lines. The dotted line indicates the limit of quantification (LOQ). LOQ was established on the basis of pre-vaccinated samples (timepoint 1) and set as the titer at which 95% of pre-vaccinated samples (T1) fell below the dotted line. p values on the top show the differences between each time point and vaccine between the different vaccines, color-coded per comparison based on the vaccine compared. NS, non-significant; GMT, Geometric mean titers. (B–D) (B) Comparison of area under the curve (AUC) for spike IgG, (C) RBD IgG, and (D) PSV neutralization titers across the full 6-month window for mRNA-1273, BNT162b2, and Ad26.COV2.S. Statistical analysis by Mann-Whitney t-test. Data are represented as geometric mean ± geometric SD. (E–G) (E) Comparison of area under the curve (AUC) for spike IgG, (F) RBD IgG, and (G) PSV neutralization titers across the 3.5 to 6-month window for mRNA-1273, BNT162b2, Ad26.COV2.S, and NVX-COV2373. Statistical analysis by Mann-Whitney t-test. Data are represented as geometric mean ± geometric SD.
Figure S2
Figure S2
Representative gating strategy for T cell analysis. Related to Figure 3, Figure 4, Figure 5 (A) Representative strategies to define CD3+CD4+ and CD3+CD8+ cells by AIM and ICS assays. (B-C) Representative gating strategy of spike-specific AIM+ CD4+ T cells induced by mRNA-1273, BNT162b2, Ad26.COV2.S, and NVX-CoV2373 COVID-19 vaccine platforms. Spike-specific CD4+ T cells were measured by Activation-Induced Makers (AIM) assay: AIM+ OX40+ and CD137+ (B) and AIM+ OX40+ and surface CD40L+ (C). (D) Representative gating strategy of spike-specific circulating follicular helper T cells (cTFH) induced by mRNA-1273, BNT162b2, Ad26.COV2.S, and NVX-CoV2373 COVID-19 vaccine platforms. mRNA-1273 (red), BNT162b2 (blue), Ad26.COV2.S (green), and NVX-CoV2373 (purple).
Figure S3
Figure S3
Multifunctional spike-specific CD4+ T cells expressing iCD40L+ in subjects vaccinated with the mRNA-1273, BNT162b2, Ad26.COV2.S, or NVX-CoV2373 COVID-19 vaccines. Related to Figure 4 (A) Comparison of multifunctional profiles of spike-specific CD4+ T cells iCD40L+Secreted-effector+ in subjects vaccinated with the mRNA-1273, BNT162b2, Ad26.COV2.S, or NVX-CoV2373 COVID-19 vaccine at T2, T3, T4, and T5. The blue, green, yellow, and red colors in the stacked bar charts depict the production of one, two, three, and four Secreted-effector+ functions, respectively. Data were analyzed for statistical significance using the Kruskal-Wallis (KW) test and Dunn’s post-test for multiple comparisons. (B) Predominant multifunctional profiles of spike-specific CD4+ T cells expressing iCD40L with one, two, three, and four Secreted-effector+ functions were analyzed in subjects vaccinated with the mRNA-1273, BNT162b2, Ad26.COV2.S, or NVX-CoV2373 COVID-19 vaccine at 6 months post-vaccination (T5). Boolean analysis was carried out to define the functional profiles and the analysis included GzB, IFNγ, IL-2, and TNFα gated on CD3+CD4+ cells expressing iCD40L (See Figure 4). Each Secreted-effector+ profile combination was considered positive with >0.005% and an SI > 2 for CD4+ T cells. The dotted line indicates the limit of quantification (LOQ). The bars show the Geometric mean and geometric SD of the spike-specific CD4+ T cells iCD40L+.
Figure 2
Figure 2
Antibodies elicited by mRNA-1273, BNT162b2, Ad26.COV2.S, and NVX-CoV2373 COVID-19 vaccine platforms (A–C) (A) Comparison of longitudinal SARS-CoV-2 spike IgG levels, (B) SARS-CoV-2 RBD IgG levels, and (C) SARS-CoV-2 pseudovirus neutralizing titers (PSV) from all donors to the mRNA-1273 (red), BNT162b2 (blue), Ad26.COV2.S (green) and NVX-CoV2373 (purple) COVID-19 vaccines over 6 months. Individual subjects are show as gray symbols with connecting lines for longitudinal samples. Geometric means are shown in thick colored lines. Dotted lines indicate the limit of quantification (LOQ). p values show differences between each time point between the different vaccines, color-coded per comparison based on the vaccine compared. NS, non-significant; GMT, geometric mean titers. Bottom bars indicate fold changes between two time points. (D–F) (D) Comparison of spike IgG, (E) RBD IgG, and (F) PSV neutralization titers at 185 ± 6 days post-vaccination to SARS-CoV-2-infected individuals at 170 to 195 days post-symptom onset. Statistical analysis by Mann-Whitney t-test. Data are represented as geometric mean ± geometric SD. See also Figure S1.
Figure 3
Figure 3
Acute and memory CD4+ T cell responses after mRNA-1273, BNT162b2, Ad26.COV2.S, or NVX-CoV2373 immunization (A) Longitudinal spike-specific CD4+ T cell responses induced by four different COVID-19 vaccines measured by OX40+CD137+ AIM+ after spike megapool (MP) stimulation. See Figure S2B for the representative gating strategy of OX40+CD137+ AIM+ cells. (B) Longitudinal spike-specific CD4+ T cell responses induced by four different COVID-19 vaccines measured by OX40+ surface CD40L+ AIM after spike megapool (MP) stimulation. See Figure S2C for the representative gating strategy of OX40+sCD40L+AIM+ cells. (C) Longitudinal spike-specific circulating T follicular helper cells (cTfh) induced by COVID-19 vaccines. Spike-specific cTfh cells (CXCR5+OX40+sCD40L+, as % of CD4+ T cells) after stimulation with spike MP. See Figure S2D for the representative gating strategy of cTfh cells. (D–F) Comparison of spike-specific CD4+ T cells by OX40+CD137+ AIM+ (D), OX40+sCD40L+AIM+ (E), and cTfh (F) between COVID-19 vaccinees at 185 ± 6 days post-vaccination and SARS-CoV-2-exposed subjects 170 to 195 days PSO. Data are represented as geometric mean ± geometric SD. The dotted black line indicates the limit of quantification (LOQ). The color-coded bold lines in (A), (B), and (C) represent the geometric mean each time post-vaccination. Background-subtracted and log data analyzed. p values on the top in (A), (B), and (C) show the differences between each time point in the different vaccines and are color-coded as per Figure 1. Bottom bars in (A), (B), and (C) show fold-changes between T3 and T5. Data were analyzed for statistical significance using the Mann-Whitney test ([A–F]). NS, non-significant. See also Figure S2.
Figure 4
Figure 4
Cytokine memory CD4+ T cell responses after mRNA-1273, BNT162b2, Ad26.COV2.S, or NVX-CoV2373 immunization (A) Representative gating strategy of spike-specific CD4+ T cells expressing iCD40L+ producing cytokines or Granzyme B (GzB) detected in COVID-19 vaccine platforms at T3. Secreted-effector+ CD4+ T cell responses were quantified by expressing iCD40L+ along with the production of IFNγ, TNFα, IL-2, and/or GzB after stimulation with spike MP. (B) Spike-specific CD4+ T cells measured by ICS. Expressing iCD40L and producing IFNγ, TNFα, IL-2, or GzB (Secreted-effector+ = ICS+). Donut charts depict the proportions of multifunctional secreted effector profiles among the spike-specific ICS+ CD4+ T cells: 1 (light gray), 2 (dark gray), 3 (black), and 4 (turquoise) functions. (C) Comparison of spike-specific CD4+ T cells measured by ICS between COVID-19 vaccinees at 185 ± 6 days post-vaccination and SARS-CoV-2-exposed subjects 170 to 195 days PSO. Data are represented as geometric mean ± geometric SD. (D–G) Spike-specific CD4+ T cells expressing iCD40L+ and producing IFNγ (B), TNFα (C), IL-2 (D), or GzB (E) from COVID-19 vaccinees evaluated at T1, T2, T3, T4, and T5. The dotted black line indicates the limit of quantification (LOQ). The color-coded bold lines in (B and D–G) represent the Geometric mean in each time post-vaccination. Background-subtracted and log data analyzed. p values on the top in (B and D–G) show the differences between each time point in the different vaccines and are color coded as follows: mRNA-1273 (red), BNT162b2 (blue), Ad26.COV2.S (green), or NVX-CoV2373 (purple). Data were analyzed for statistical significance using the Mann-Whitney test ([B–G]). T1, Baseline; T2, 15 ± 3 days; T3, 42 ± 7 days; T4, 108 ± 9 days; T5, 185 ± 8 days. See also Figures S2 and S3.
Figure S4
Figure S4
Additional analyses in spike-specific CD8+ T cells in subjects vaccinated with the mRNA-1273, BNT162b2, Ad26.COV2.S, or NVX-CoV2373 COVID-19 vaccines. Related to Figure 5 (A-B) Spike-specific CD8+ T cells expressing CD69+ and producing TNFα (A) and IL-2 (B) from COVID-19 vaccinees at T1, T2, T3, T4, and T5. (C) Comparison of spike-specific IFNγ+ CD8+ T cell responses between COVID-19 vaccinees at 185 ± 6 days post-vaccination and SARS-CoV-2-exposed subjects 170 to 195 days PSO. For this analysis, IFNγ-producing CD8+ T cells were gated based on total CD8+ T cells (no CD69 gating), as no CD69 marker was available for the samples from the previously SARS-CoV-2-infected subjects. Representative gating strategy of spike-specific CD8+ T cells producing IFNγ detected in COVID-19 vaccine platforms (Left panel). (D) Spike-specific CD8+ T cells expressing CD69+ and producing IFNγ from COVID-19 vaccinees at 6 months post-vaccination (T5). Median fluorescence intensity (MFI) levels of IFNγ were evaluated on COVID-19 vaccinees with a positive IFNγ response at T5 (See Figure 5). (E-F) Longitudinal spike-specific CD8+ CD69+CD137+ AIM+ T cell responses induced by COVID-19 vaccines at T1, T2, T3, T4, and T5. Representative gating strategy of spike-specific AIM+ CD8+ T cells (E) and spike-specific CD8+ T cells were measured by AIM assay: AIM+ CD69+ and CD137+ after stimulation with spike MP (F). (G) Comparison of spike-specific CD8+ T cell responses (AIM+ CD69+CD137+) between COVID-19 vaccinees at 185 ± 6 days post-vaccination and SARS-CoV-2-exposed subjects 170 to 195 days PSO. (H) Comparison of multifunctional profiles of spike-specific CD8+ T cells CD69+Cytokine+ in subjects vaccinated with the mRNA-1273, BNT162b2, Ad26.COV2.S, or NVX-CoV2373 COVID-19 vaccine at T2, T3, T4, and T5. (I) Predominant multifunctional profiles of spike-specific CD8+ T cells expressing CD69 with one, two, three, and four functions analyzed in subjects vaccinated with the mRNA-1273, BNT162b2, Ad26.COV2.S, or NVX-CoV2373 COVID-19 vaccines at 6 months post-vaccination (T5). Boolean analysis was carried out to define the functional profiles and the analysis included GzB, IFNγ, IL-2, and/or TNFα gated on CD3+CD8+ cells expressing CD69 (See Figure 5). Each Cytokine+ profile combination was considered positive with >0.005% and an SI > 2 for CD8+ T cells. (J) Longitudinal analysis of the memory subsets evaluated on spike-specific CD8+ T cells expressing CD69+ and producing IFNγ in subjects vaccinated with the mRNA-1273, BNT162b2, Ad26.COV2.S, or NVX-CoV2373 COVID-19 vaccines. Representative gating strategy of the memory subsets evaluated on CD8+ T cells. The memory subsets were defined based on the expression of CCR7 and CD45RA: central memory (TCM, CCR7+CD45RA), effector memory (TEM, CCR7-CD45RA), and terminally differentiated effector cells (TEMRA, CCR7-CD45RA+) (Left Panel). The dotted black line indicates the limit of quantification (LOQ). The color-coded bold lines (A, B, and F) represent the Geometric mean each time post-vaccination. Lines in C, D, G, and I represent the Geometric mean and Geometric SD, or in H and J represent the Mean and SD Background-subtracted and log data analyzed. p values on the top (A, B, and F) show the differences between each time point in the different vaccines. Data were analyzed for statistical significance using the Mann-Whitney test [(A, B, F)]. T1, Baseline; T2, 15 ± 3 days; T3, 42 ± 7 days; T4, 108 ± 9 days; T5, 185 ± 8 days.
Figure 5
Figure 5
Acute and memory CD8+ T cell responses after mRNA-1273, BNT162b2, Ad26.COV2.S, or NVX-CoV2373 immunization (A) Representative gating of spike-specific CD8+ T cells. Cytokine-producing (“cytokine+”) CD8+ T cells were quantified as CD69+ along with IFNγ, TNFα, or IL-2 expression after stimulation with spike MP. (B) Longitudinal quantitation of CD69+IFNγ+ spike-specific CD8+ T cells. See Figures S4A and S4B for TNFα and IL-2, and Figures S4H and S4I for additional analysis. (C) Longitudinal quantitation of cytokine+ spike-specific CD8+ T cells. CD8+ T cells were quantified as CD69+ along with IFNγ, TNFα, or IL-2 expression after stimulation with spike MP. Bottom bars show fold-changes between T3 and T5. The donut charts depict the proportions of multifunctional cytokine+ profiles of the spike-specific CD8+ T cells, including IFNγ, TNFα, or IL-2 and GzB: 1 (light gray), 2 (dark gray), 3 (black), and 4 (turquoise) functions. The dotted black line indicates the limit of quantification (LOQ). Graphs are color-coded as per Figure 1. Background-subtracted and log data analyzed. Data were analyzed for statistical significance using the Mann-Whitney test ([B], [C]). See Figure S4 for additional analysis on spike-specific CD8+ T cells. See also Figures S2 and S4.
Figure 6
Figure 6
SARS-CoV-2-specific memory B cells to mRNA-1273, BNT162b2, Ad26.COV2.S, and NVX-CoV2373 vaccines (A and B) Representative gating strategy for (A) spike-binding and (B) RBD-binding memory B cells (“MBCs”) (See also Figure S5). (C and D) Frequency of (C) spike-binding and (D) RBD-binding MBCs from total MBCs elicited after 3.5 and 6 months. Limit of detection = 0.0017. RBD donut graphs represent isotype distribution; IgG (gray), IgA (blue), IgM (yellow), and other (black). (E and F) Proportion of spike-binding MBCs with (E) activated (CD21CD27+) and (F) classical (CD21+CD27+) phenotypes at 6 months. Data are represented as mean ± SD. (G and H) Proportion of spike-binding MBCs expressing (G) CD71 or (H) CXCR3 at 3.5 months. Data are represented as mean ± SD. (I and J) Comparisons between vaccinees and SARS-CoV-2-infected individuals for (I) Spike-binding MBCs and (J) RBD-binding MBCs at 6 months. Data are represented as geometric mean ± geometric SD. The vaccines are color-coded as per Figure 2. The color-coded bold lines in (C) and (D) represent the geometric mean at each time post-vaccination. Bottom bars show T4 to T5 statistics. Data were analyzed for statistical significance using the Mann-Whitney test ([C], [D]), Kruskal-Wallis (KW) test and Dunn’s post-test for multiple comparisons ([E], [F], [G], [H], [I], [J]0. NS, non-significant. See also Figures S5 and S6.
Figure S5
Figure S5
Identification of SARS-CoV-2-binding MBCs. Related to Figure 6 (A) Flow cytometry gating strategy for identification of spike and RBD-binding MBCs. (B) Frequency of RBD MBCs gated from spike MBCs. p values on the top show the differences between each time point in the different vaccines. The bottom bars show T4 to T5 statistics. (C) Representative gating strategy of Ig isotypes gated on RBD-binding MBCs. Colors reflect the Ig isotype distribution displayed in the donut graphs in Figure 6D. (D) Overlay of Ig isotypes from RBD MBCs onto CD27 and IgD flow cytometry plots. The “other” RBD MBCs were predominantly IgDneg and CD27+, similarly to the IgG+ RBD MBCs. Since most of the RBD MBCs were IgG+, the phenotypic similarity of the “other” RBD MBCs suggests they may be IgG isotype MBCs that did not sufficiently bind to the anti-IgG reagent. Data were analyzed for statistical significance using the Mann-Whitney test [(B)].
Figure S6
Figure S6
Phenotypic characterization of SARS-CoV-2-specific MBCs elicited by COVID-19 vaccines. Related to Figure 6 (A) Representative gating strategy of spike MBCs with a classical (CD21+CD27+), activated (CD21CD27+) and atypical (CD21CD27) phenotype. Control gating on IgD+ B cells is shown for comparison. (B-D) Freq. of (B) activated (CD21CD27+), (C) classical (CD21+CD27+) and (D) atypical (CD21 CD27) spike MBCs at 3.5 months. (E) CD71 expression by activated and classical spike-binding MBCs, at 3.5 months. (F-G) Frequency of (F) CD71+ and (G) CXCR3+ spike-binding MBCs, at 6 months. (H) Frequency of CD95+ cells among spike MBCs at 3.5 (left) and 6 (right) months. (I) Frequency of CD11c+ cells among spike MBCs at 3.5 (left) and 6 (right) months. (J) Frequency of Tbet+ cells among spike MBCs at 3.5 months. (K-L) Frequency of CD11c+ or CD95+ cells among CXCR3+ or CXCR3- spike MBCs at 3.5 months. (M) Representative gating to evaluate co-expression of CXCR3 and CD95 or CD11c. (N) Example of co-expression of CXCR3 and CD95 or CD11c in response to mRNA-1273 or Ad26.COV2.S vaccines. Data were analyzed for statistical significance using Kruskal-Wallis (KW) test [(B), (C), (D), (E), (F), (G), (H), (I), (J), (K), (L)], Mann-Whitney test [(N)], Wilcoxon matched-pairs signed rank test [(E)]. Data are represented as mean ± SD.
Figure S7
Figure S7
Vaccine-specific correlation analyses. Related to Figure 7 (A-B) Correlation matrix of T5 (6-month) samples, plotted as mRNA (mRNA-1273 and BNT162b2) and Ad26.COV2.S COVID-19 vaccines. The red rectangle indicated the association between antibody and memory B cells; the blue rectangle indicated the association between antibody and CD4+ T cell; the green rectangle indicated the association between antibody and CD8+ T cell; the pink rectangle indicated the association between CD4 T cells and memory B cell; the purple rectangle indicated the association between CD4 T cells and CD8 T cells. Spearman rank-order correlation values (r) are shown from red (−1.0) to blue (1.0); r values are indicated by color and square size. p values are indicated by white asterisks as p < 0.05, ∗∗p < 0.01, ∗∗∗p < 0.001. (C-F) Correlation matrix of CD4+ and CD8+ T cell data from the early time point T3 (C-D) or T2 (E-F) with memory B cell and antibody data from the late timepoint. The blue rectangle indicates the association between CD4+ T cell and antibody; the orange rectangle indicated the association between CD4 T cells and memory B cell. Spearman rank-order correlation values (r) are shown from red (−1.0) to blue (1.0); r values are indicated by color and square size. p values are indicated by white asterisks as p < 0.05, ∗∗p < 0.01, ∗∗∗p < 0.001. The T4 MBC and antibody data were preferred for Ad26.COV2.S due to fewer T5 paired samples. The association of spike IgG or RBD IgG with AIM2+cTfh were also shown by scatterplot (C-D). Red indicated mRNA, green indicated Ad26.COV2.S. Spearman rank-order correlation values (r) and p values were shown. (G-H) Correlation matrix of antibody data from the T2 time point with memory B cell data from the late timepoint. Spearman rank-order correlation values (r) are shown from red (−1.0) to blue (1.0); r values are indicated by color and square size. p values are indicated by white asterisks as p < 0.05, ∗∗p < 0.01, ∗∗∗p < 0.001. The T4 MBC data was preferred for Ad26.COV2.S due to fewer T5 paired samples. (I) Principal component analysis (PCA) representation of mRNA-1273 (n = 28), BNT162b2 (n = 19), Ad26.COV2.S (n = 20), and NVX-Cov-2373 (n = 8) on the basis of all parameters obtained 3.5-month post-vaccination. Only paired subjects were used for the PCA analysis. Arrows indicated the prominent immunological distinguishing features. Ellipse represented the clustering of each vaccine. Red indicated mRANA-1273, blue indicated BNT162b2, and green indicated Ad26.COV2.S. MBCs indicates spike-specific memory B cell, cMBCs indicates spike-specific classical memory B cell, aMBCs indicates spike-specific activated memory B cell, AIM1+ indicates OX40+CD137+, AIM2+ indicates OX40+CD40L+, nAb indicates neutralization antibody.
Figure 7
Figure 7
Vaccine-specific immunological correlations analyses (A) Correlation matrix of T5 (6-month) samples, plotted as mRNA (mRNA-1273 and BNT162b2) and Ad26.COV2.S COVID-19 vaccines. The red rectangle indicates the association between antibody and MBC; the blue rectangle indicates the association between antibody and CD4+ T cells; the green rectangle indicates the association between antibody and CD8+ T cells. Spearman rank-order correlation values (r) are shown from red (−1.0) to blue (1.0); r values are indicated by color and square size. p values are indicated by white asterisks as p < 0.05, ∗∗p < 0.01, ∗∗∗p < 0.001. MBCs indicates memory B cell, AIM1 indicates OX40+CD137+, AIM2 indicates OX40+sCD40L+, nAb indicates neutralization antibody. (B–I) The association of indicated parameters shown by scatterplot. Red indicated mRNA, green indicated Ad26.COV2.S. Spearman rank-order correlation values (r) and p values were shown. (J) Correlation matrix of CD4+ and CD8+ T cell data from the early time point with MBCs and antibody data from the late timepoint. The blue rectangle indicates the association between CD4+ T cell and antibody. Spearman rank-order correlation values (r) are shown from red (−1.0) to blue (1.0); r values are indicated by color and square size. p values are indicated by white asterisks as p < 0.05, ∗∗p < 0.01, ∗∗∗p < 0.001. T4 MBC and antibody data were preferred for Ad26.COV2.S due to fewer T5 paired samples. (K–N) The association of indicated parameters shown by scatterplot. Red indicated mRNA, green indicated Ad26.COV2.S. Spearman rank-order correlation values (r) and p values were shown. (O) Principal component analysis (PCA) representation of mRNA-1273 (n = 19), BNT162b2 (n = 14), Ad26.COV2.S (n = 14), and NVX-Cov-2373 (n = 10) on the basis of all parameters obtained 6-month post-vaccination. Only paired subjects were used for the PCA analysis. Arrows indicated the prominent immunological distinguishing features. Ellipse represents the clustering of each vaccine. Red indicates mRANA-1273, blue indicates BNT162b2, and green indicates Ad26.COV2.S. MBCs indicates spike-specific memory B cell, cMBCs indicates spike-specific classical MBCs, aMBCs indicates spike-specific activated MBCs, AIM1+ indicates OX40+CD137+, AIM2+ indicates OX40+CD40L+, nAb indicates neutralization antibody. (P) Spearman rank-order correlation between PSV neutralization titers and frequency of spike MBCs expressing CXCR3 at 3.5 months after vaccination. Background-subtracted and log data analyzed. Only Ad26.COV2.S shows a positive correlation and spearman rank-order correlation values (r) and p values are shown as green. Linear regression analysis of Ad26.COV2.S is shown for visual reference. See also Figure S7.

Update of

References

    1. Atmar R.L., Lyke K.E., Deming M.E., Jackson L.A., Branche A.R., El Sahly H.M., Rostad C.A., Martin J.M., Johnston C., Rupp R.E., et al. Homologous and heterologous Covid-19 booster vaccinations. N. Engl. J. Med. 2022 doi: 10.1056/NEJMoa2116414. - DOI - PMC - PubMed
    1. Baden L.R., El Sahly H.M., Essink B., Kotloff K., Frey S., Novak R., Diemert D., Spector S.A., Rouphael N., Creech C.B., et al. Efficacy and safety of the mRNA-1273 SARS-CoV-2 vaccine. N. Engl. J. Med. 2021;384:403–416. doi: 10.1056/NEJMoa2035389. - DOI - PMC - PubMed
    1. Barouch D.H., Stephenson K.E., Sadoff J., Yu J., Chang A., Gebre M., McMahan K., Liu J., Chandrashekar A., Patel S., et al. Durable humoral and cellular immune responses 8 Months after Ad26.COV2.S vaccination. N. Engl. J. Med. 2021;385:951–953. doi: 10.1056/NEJMc2108829. - DOI - PMC - PubMed
    1. Carreno J.M., Alshammary H., Tcheou J., Singh G., Raskin A.J., Kawabata H., Sominsky L.A., Clark J.J., Adelsberg D.C., Bielak D.A., et al. Activity of convalescent and vaccine serum against SARS-CoV-2 Omicron. Nature. 2022;602:682–688. doi: 10.1038/s41586-022-04399-5. - DOI - PubMed
    1. Cho A., Muecksch F., Schaefer-Babajew D., Wang Z., Finkin S., Gaebler C., Ramos V., Cipolla M., Mendoza P., Agudelo M., et al. Anti-SARS-CoV-2 receptor-binding domain antibody evolution after mRNA vaccination. Nature. 2021;600:517–522. doi: 10.1038/s41586-021-04060-7. - DOI - PMC - PubMed

Publication types