. 2022 Aug;63(8):100247.
doi: 10.1016/j.jlr.2022.100247. Epub 2022 Jun 25.

Differential expression patterns of phospholipase D isoforms 1 and 2 in the mammalian brain and retina

Affiliations

Differential expression patterns of phospholipase D isoforms 1 and 2 in the mammalian brain and retina

Casey N Barber et al. J Lipid Res. 2022 Aug.

Abstract

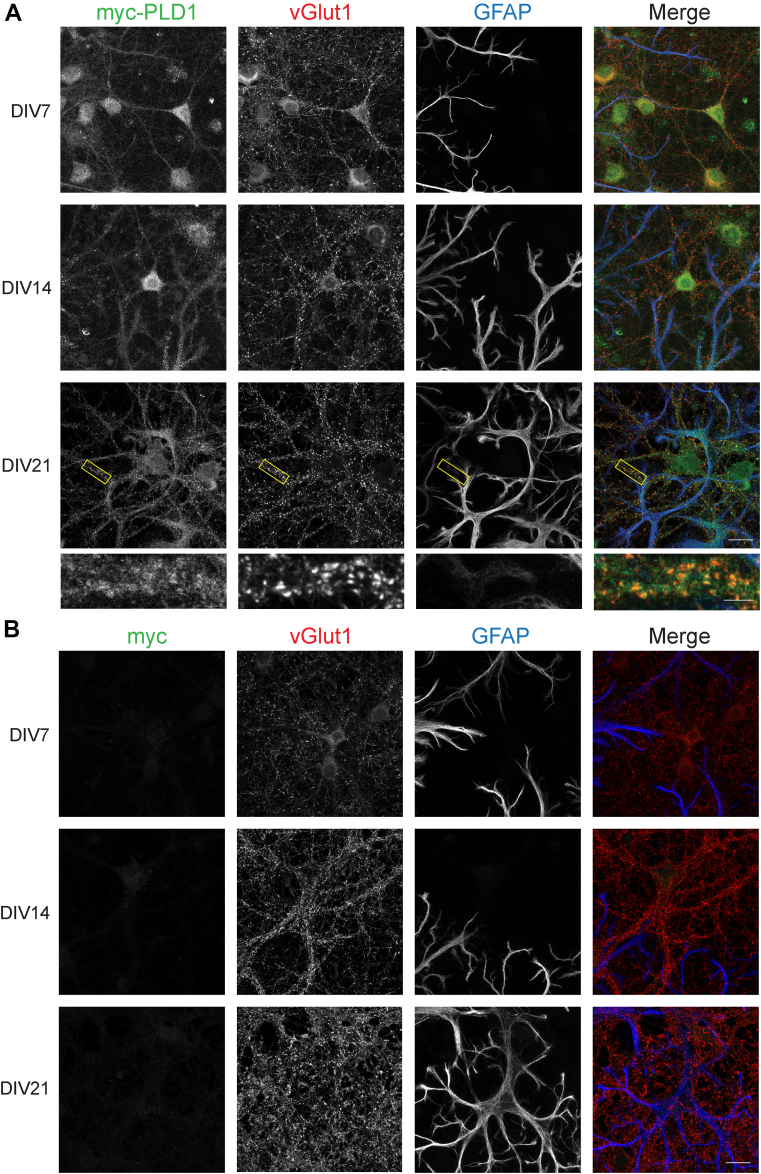
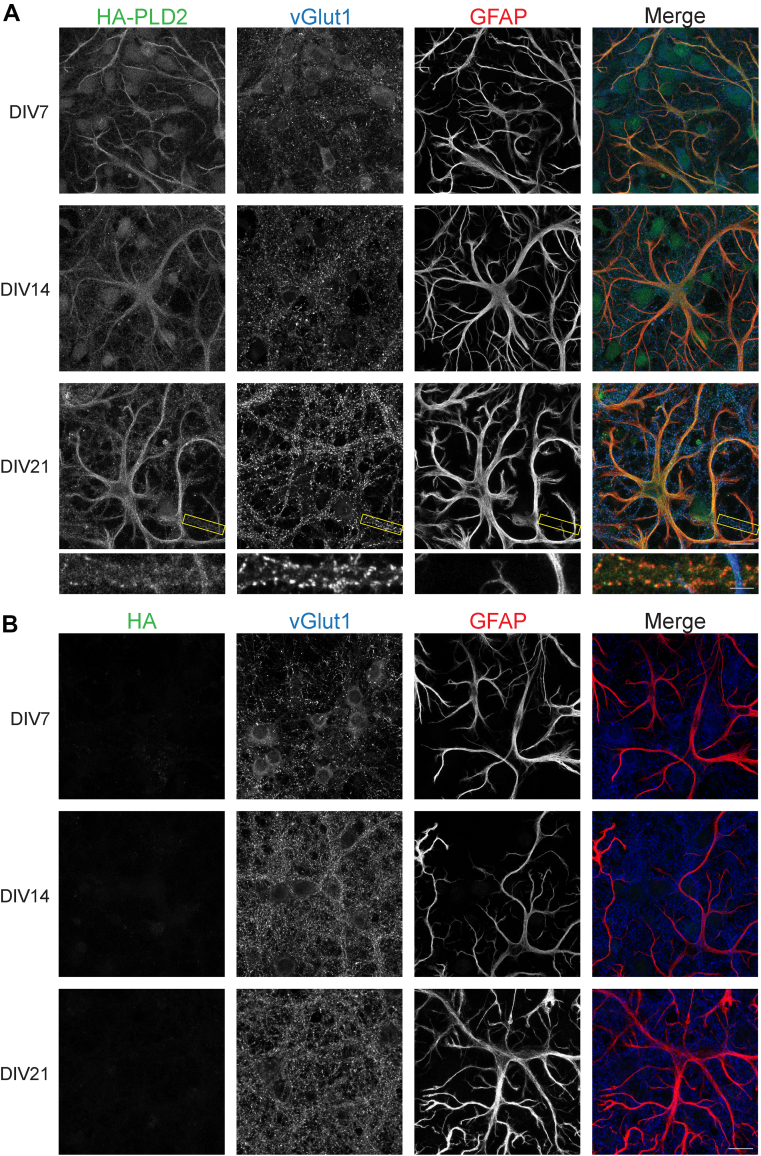
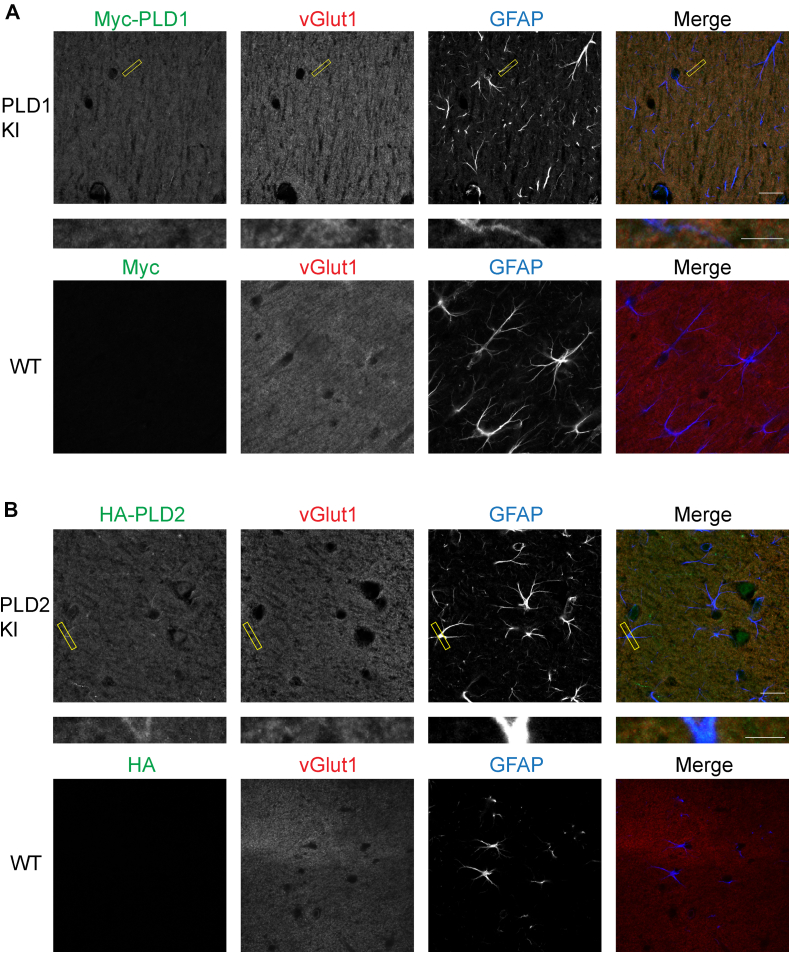
Phosphatidic acid is a key signaling molecule heavily implicated in exocytosis due to its protein-binding partners and propensity to induce negative membrane curvature. One phosphatidic acid-producing enzyme, phospholipase D (PLD), has also been implicated in neurotransmission. Unfortunately, due to the unreliability of reagents, there has been confusion in the literature regarding the expression of PLD isoforms in the mammalian brain which has hampered our understanding of their functional roles in neurons. To address this, we generated epitope-tagged PLD1 and PLD2 knockin mice using CRISPR/Cas9. Using these mice, we show that PLD1 and PLD2 are both localized at synapses by adulthood, with PLD2 expression being considerably higher in glial cells and PLD1 expression predominating in neurons. Interestingly, we observed that only PLD1 is expressed in the mouse retina, where it is found in the synaptic plexiform layers. These data provide critical information regarding the localization and potential role of PLDs in the central nervous system.

Keywords: CRISPR/Cas9; brain lipids; exocytosis; eye/retina; glia; knock-in mice; neurotransmission; phospholipases/D; phospholipids/phosphatidic acid; synaptic plexiform layer.


Conflict of interest statement

Conflict of interest The authors declare that they have no conflicts of interest with the contents of this article.

Figures

Fig. 1
Fig. 1
Validation of myc-PLD1 and HA-PLD2 mouse lines. A: Using CRISPR-Cas9, three tandem myc tags were inserted into the N-terminal region of the PLD1 protein, upstream of the phox homology (PX) domain, to generate the myc-PLD1 mouse line. Additionally, three tandem HA tags were inserted into the N-terminal region of the PLD2 protein, upstream of the PX domain. B: Western blots were performed with whole brain lysates from WT, myc-PLD1, and HA-PLD2 mice. A myc antibody visualizes the myc tag in the myc-PLD1 lysate specifically (∼125 kDa), and an HA antibody recognizes the HA band in the HA-PLD2 lysate only (∼109 kDa). PX, phox homology domain; PH, plekstrin homology domain; HKD, HxK(x)4D (H-histidine, K-lysine, D-aspartic acid).
Fig. 2
Fig. 2
PLD1 is expressed predominantly in neurons, marginally in glia, and is synaptic at DIV21. A: Myc-PLD1 cortical neuron and glia cultures were stained with a myc antibody to visualize myc-PLD1 protein, a vGlut1 antibody as a marker of presynaptic boutons, and a GFAP antibody to visualize glial processes at DIV 7, 14, and 21. B: WT mouse cortical neuron and glia cultures were stained with myc, vGlut1, and GFAP antibodies as in (A). Scale bars represent 20 μm and 5 μm (cropped region). Images are representative of three separate experiments. GFAP, glial fibrillary acidic protein; vGlut1, vesicular glutamate transporter 1.
Fig. 3
Fig. 3
Quantification of myc-PLD1 and WT cortical neuron immunofluorescence. The percent colocalization was calculated for myc + vGlut1 and myc + GFAP in myc-PLD1 and WT cortical neurons at DIV7 (A), DIV14 (B), and DIV21 (C). Data is representative of three experiments and error bars represent SEM. A: myc-PLD1 n = 5, WT n = 3; B, myc-PLD1 n = 6, WT n = 3; C, myc-PLD1 n = 8, WT n = 3. vGlut1, vesicular glutamate transporter 1; GFAP, glial fibrillary acidic protein.
Fig. 4
Fig. 4
PLD2 expression is robust in glia, moderate in neurons, and is synaptic at DIV21. A: HA-PLD2 cortical neuron and glia cultures were stained with an HA antibody to visualize PLD2 protein, a vGlut1 antibody as a marker of presynaptic boutons, and a GFAP antibody to visualize glial processes at DIV 7, 14, and 21. B: WT mouse cortical neuron and glia cultures were stained with HA, vGlut1, and GFAP antibodies as in (A). Scale bars represent 20 μm and 5 μm (cropped region). Images are representative of three separate experiments. GFAP, glial fibrillary acidic protein; vGlut1, vesicular glutamate transporter 1.
Fig. 5
Fig. 5
Quantification of HA-PLD2 and WT cortical neuron immunofluorescence. The percent colocalization was calculated for HA + vGlut1 and HA + GFAP in myc-PLD1 and WT cortical neurons at DIV7 (A), DIV14 (B), and DIV21 (C). Data is representative of three experiments and error bars represent SEM. A: HA-PLD2 n = 5, WT n = 3; B, HA-PLD2 n = 5, WT n = 3; C, HA-PLD2 n = 6, WT n = 2. GFAP, glial fibrillary acidic protein; vGlut1, vesicular glutamate transporter 1.
Fig. 6
Fig. 6
In brain slices, PLD1 and PLD2 are both expressed in neurons, with PLD2 expression higher in glial processes. A: P26 myc-PLD1 brains were fixed, sectioned, and stained with myc, vGlut1, and GFAP antibodies. No myc staining is observed in WT mouse (P25) cortical brain slices. B: P32 HA-PLD2 brains were fixed, sectioned, and stained with HA, vGlut1, and GFAP antibodies. No HA staining is observed in WT mouse (P25) cortical brain slices. Scale bars represent 20 μm and 5 μm (cropped region). Images are representative of three separate experiments. GFAP, glial fibrillary acidic protein; vGlut1, vesicular glutamate transporter 1.
Fig. 7
Fig. 7
Quantification of myc-PLD1, HA-PLD2, and WT cortical brain slices. Percent colocalization of myc + vGlut1 and myc + GFAP was calculated for myc-PLD1 and WT cortical brain slices (A) and HA-PLD2 and WT cortical brain slices (B). Data is representative of two experiments (two mice) and error bars represent SEM. A: myc-PLD1 n = 3, WT n = 3; B, HA-PLD2 n = 3, WT n = 3. vGlut1, vesicular glutamate transporter 1; GFAP, glial fibrillary acidic protein.
Fig. 8
Fig. 8
PLD1 exclusively is expressed in mouse retinal slices. A: Retinal slices from P55 myc-PLD1 mice were stained with a myc antibody to visualize PLD1 localization, a PKCα antibody to label bipolar and ganglion cells, and a vGlut1 antibody as a marker of presynaptic boutons. No myc staining is observed in P67 WT retinal slices. B: Retinal slices from P59 HA-PLD2 mice were also stained with HA, PKCα, and vGlut1 antibodies. No HA staining is observed in P67 WT retinal slices. Scale bars represent 20 μm and 5 μm (cropped region). Percent colocalization of myc + PKCα and myc + vGlut1 was calculated for myc-PLD1 and WT retinal slices (C) and of HA + PKCα and HA + vGlut1 for HA-PLD2 and WT retinal slices (D). Data is representative of three experiments and error bars represent SEM. C: myc-PLD1 n = 6, WT n = 5; D, HA-PLD2 n = 5, WT n = 5. Images are representative of three separate experiments. GC, ganglion cell layer; IP, inner plexiform layer; IN, inner nuclear layer; OP, outer plexiform layer; vGlut1, vesicular glutamate transporter 1.
Fig. 9
Fig. 9
ERG recordings from WT and PLD1 KO mice reveal no significant differences in the A or B wave. WT and PLD1 KO mice (all P58) were dark adapted and ERG recordings were measured in response to a range of light intensities. The average a-wave amplitude (A) and b-wave amplitude (B) from responses are plotted by each light stimulus. Data analyzed with unpaired t-tests. A: −2.0 cd .s/m2P = 0.7953, −1.0 cd .s/m2P = 0.7471, 0.0 cd .s/m2P = 0.7676; B: −2.0 cd .s/m2P = 0.3876, −1.0 cd .s/m2P = 0.8327, 0.0 cd .s/m2P = 0.9168. n = 3 mice. Error bars represent SEM. ERG, electroretinogram.

References

    1. Zeniou-Meyer M., Zabari N., Ashery U., Chasserot-Golaz S., Haeberle A., Demais V., et al. Phospholipase D1 production of phosphatidic acid at the plasma membrane promotes exocytosis of large dense core granules at a late stage. J. Biol. Chem. 2007;282:21746–21757. - PubMed
    1. Tanguy E., Coste de Bagneaux P., Kassas N., Ammar M., Wang Q., Haeberle A., et al. Mono- and poly-unsaturated phosphatidic acid regulate distinct steps of regulated exocytosis in neuroendocrine cells. Cell Rep. 2020;32:108026. - PubMed
    1. Chasserot-Golaz S., Coorssen J.R., Meunier F.A., Vitale N. Lipid dynamics in exocytosis. Cell Mol. Neurobiol. 2010;30:1335–1342. - PMC - PubMed
    1. English D. Phosphatidic acid: a lipid messenger involved in intracellular and extracellular signalling. Cell Signal. 1996;8:341–347. - PubMed
    1. Wang X., Devaiah S., Zhang W., Welti R. Signaling functions of phosphatidic acid. Prog. Lipid Res. 2006;45:250–278. - PubMed

Publication types

LinkOut - more resources