. 2022 Jun;10(6):e004561.
doi: 10.1136/jitc-2022-004561.

Tumor-targeted interleukin-12 synergizes with entinostat to overcome PD-1/PD-L1 blockade-resistant tumors harboring MHC-I and APM deficiencies

Affiliations

Tumor-targeted interleukin-12 synergizes with entinostat to overcome PD-1/PD-L1 blockade-resistant tumors harboring MHC-I and APM deficiencies

Christine M Minnar et al. J Immunother Cancer. 2022 Jun.

Abstract

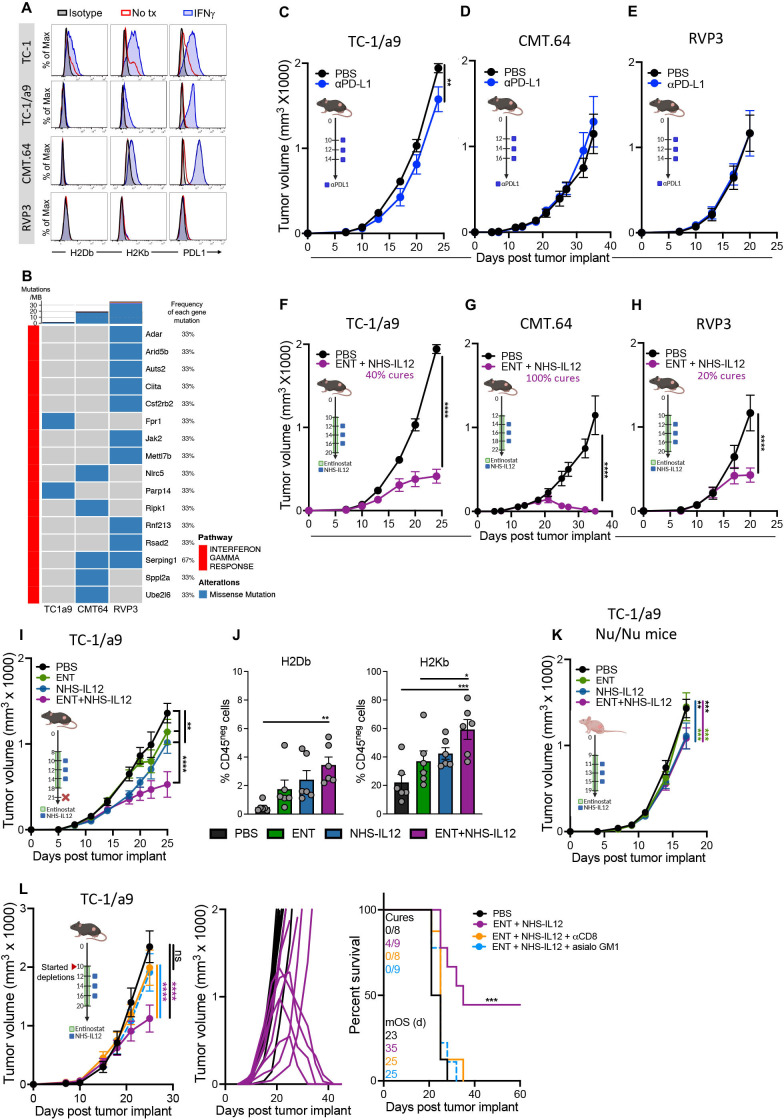
Background: Immune checkpoint blockade (ICB) has achieved unprecedented success in treating multiple cancer types. However, clinical benefit remains modest for most patients with solid malignancies due to primary or acquired resistance. Tumor-intrinsic loss of major histocompatibility complex class I (MHC-I) and aberrations in antigen processing machinery (APM) and interferon gamma (IFN-γ) pathways have been shown to play an important role in ICB resistance. While a plethora of combination treatments are being investigated to overcome ICB resistance, there are few identified preclinical models of solid tumors harboring these deficiencies to explore therapeutic interventions that can bypass ICB resistance. Here, we investigated the combination of the epigenetic modulator entinostat and the tumor-targeted immunocytokine NHS-IL12 in three different murine tumor models resistant to αPD-1/αPD-L1 (anti-programmed cell death protein 1/anti-programmed death ligand 1) and harboring MHC-I, APM, and IFN-γ response deficiencies and differing tumor mutational burden (TMB).

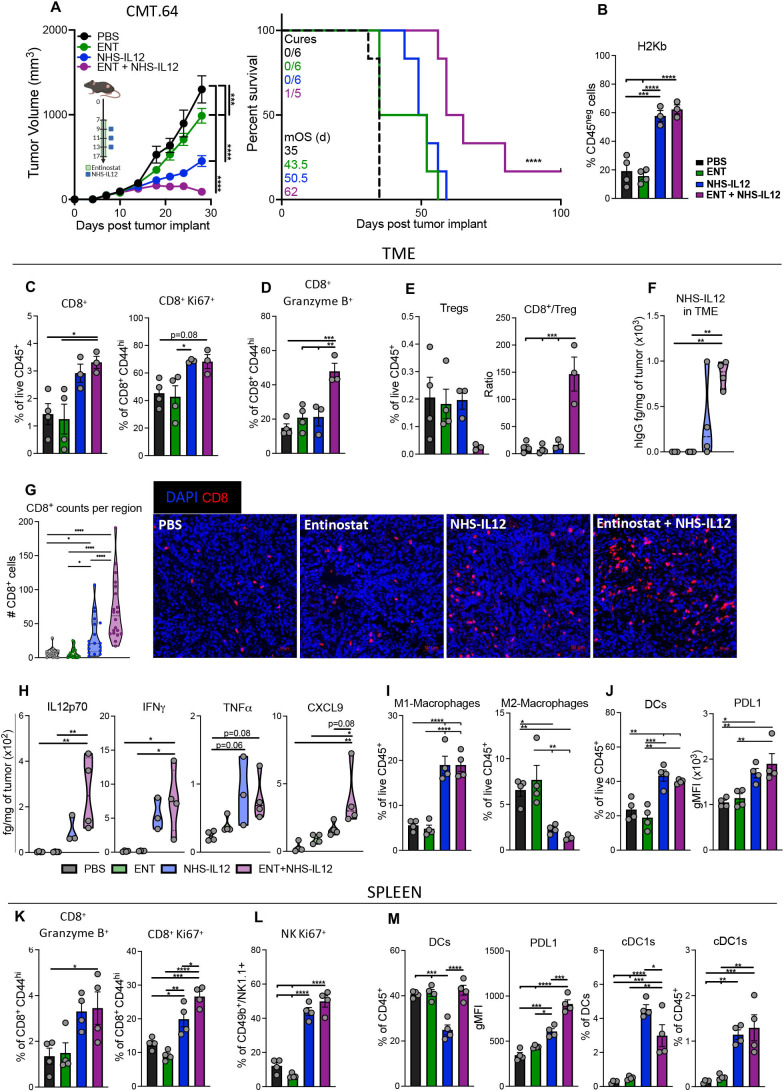
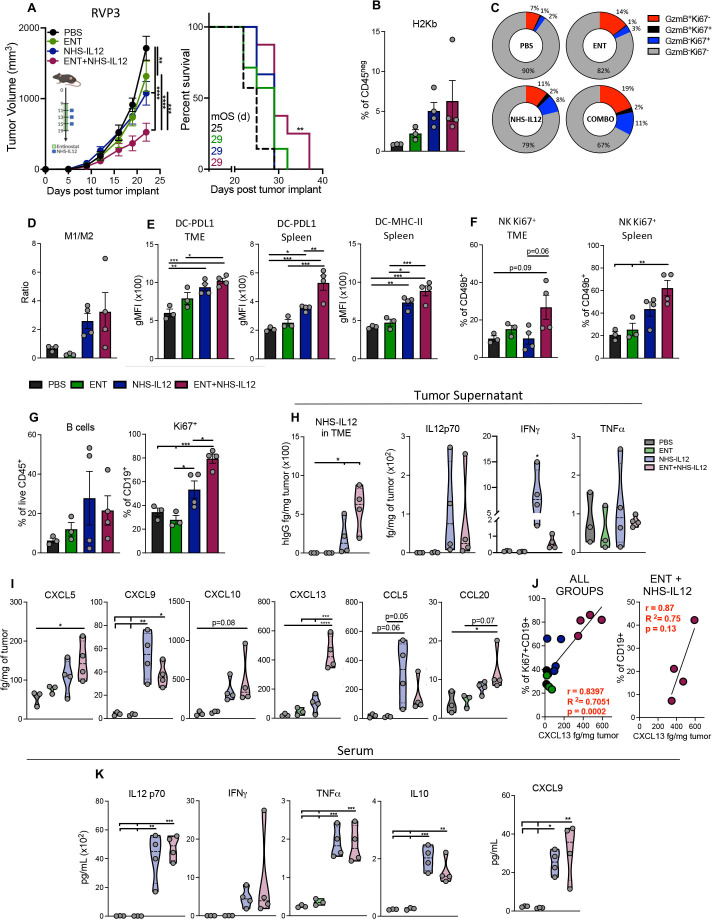
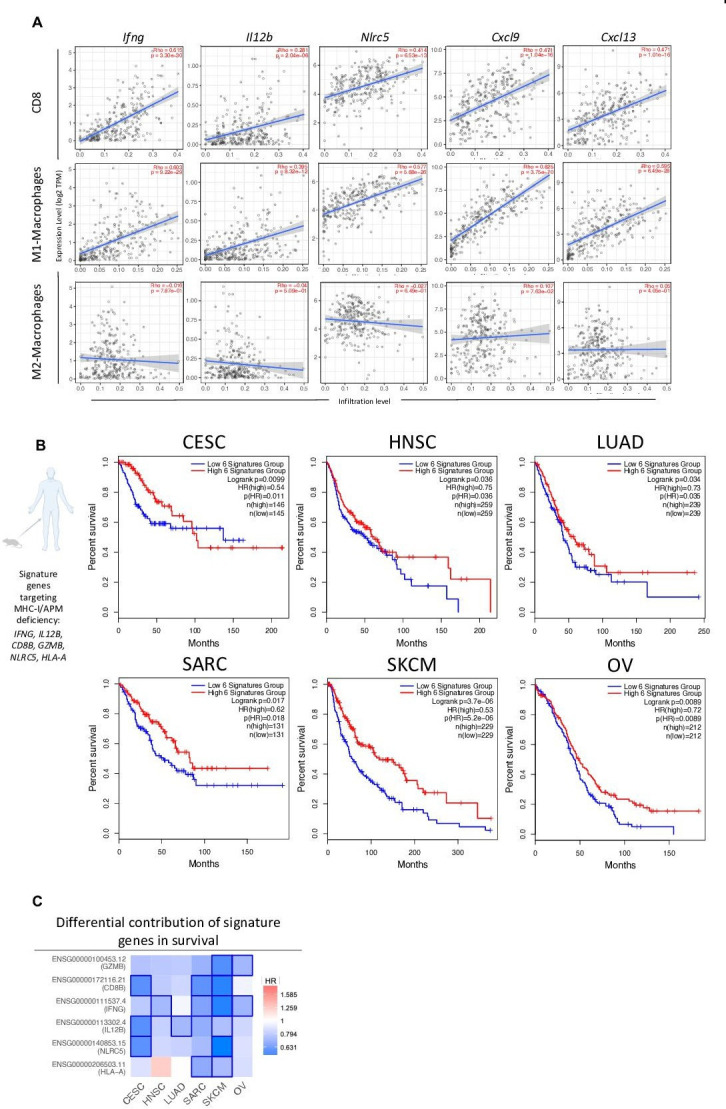
Methods: Entinostat and NHS-IL12 were administered to mice bearing TC-1/a9 (lung, HPV16 E6/E7+), CMT.64 lung, or RVP3 sarcoma tumors. Antitumor efficacy and survival were monitored. Comprehensive tumor microenvironment (TME) and spleen analysis of immune cells, cytokines, and chemokines was performed. Additionally, whole transcriptomic analysis was carried out on TC-1/a9 tumors. Cancer Genome Atlas (TCGA) datasets were analyzed for translational relevance.

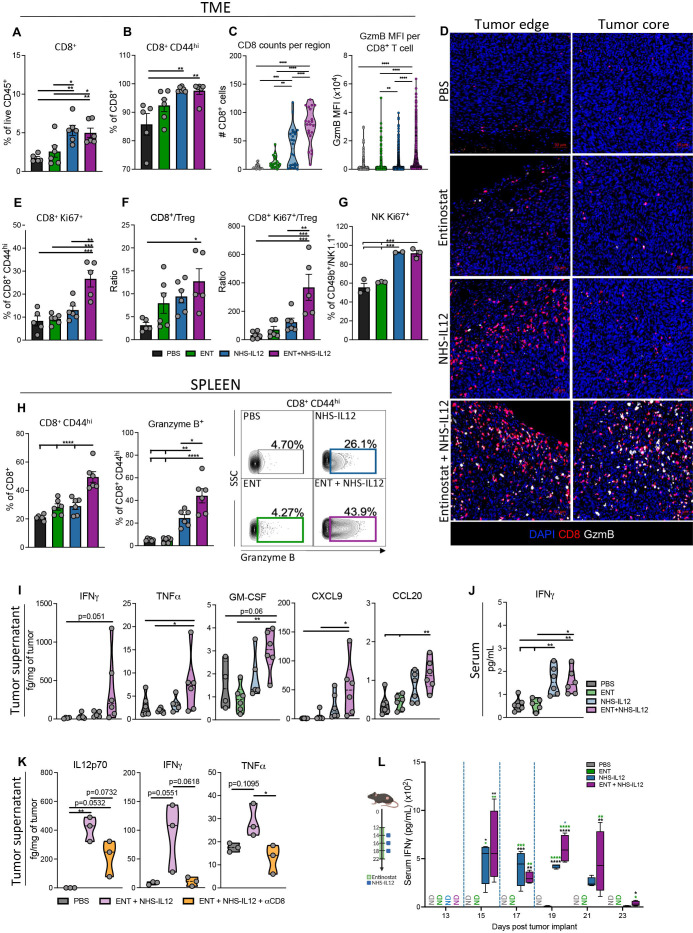
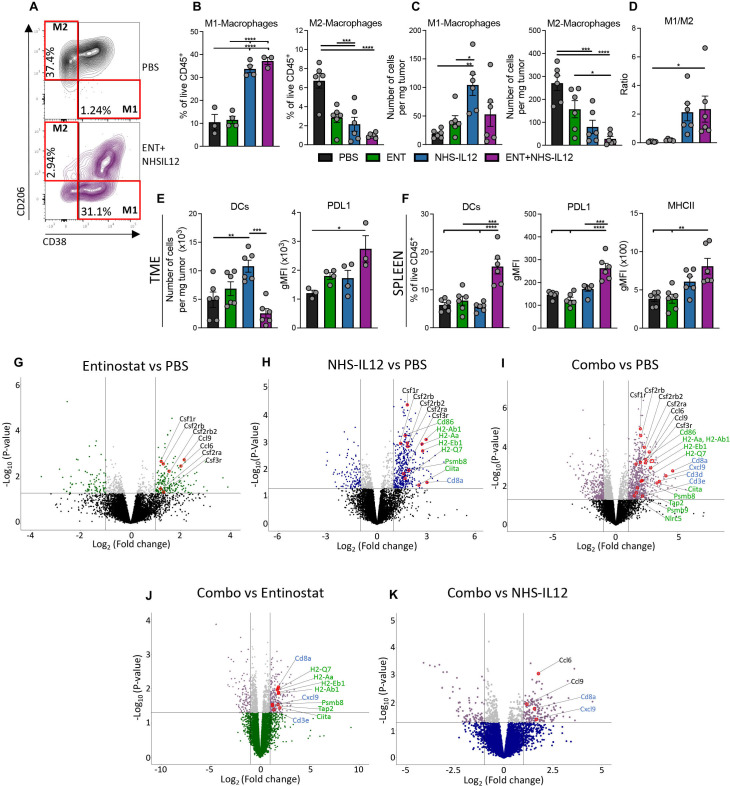
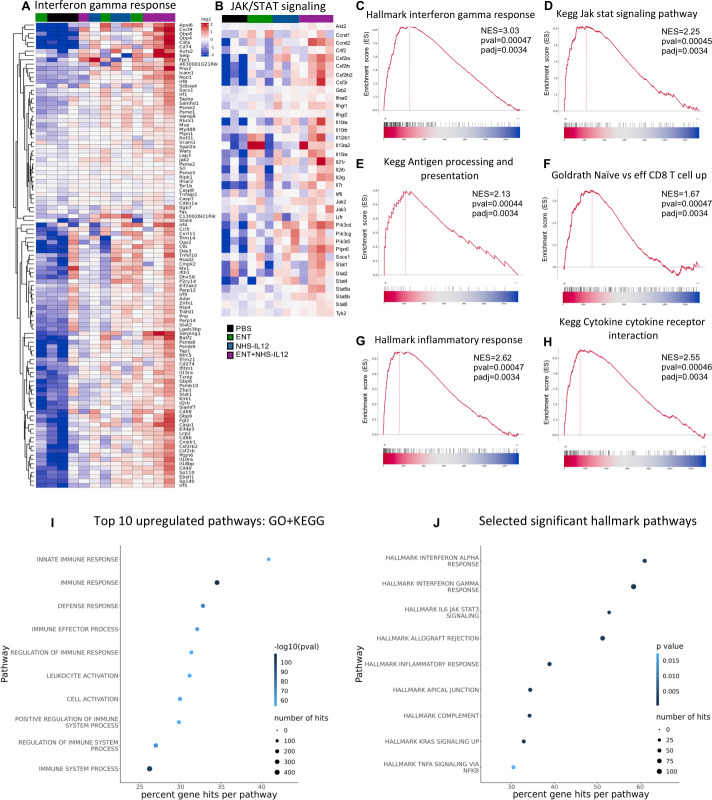
Results: We demonstrate that the combination of entinostat and NHS-IL12 therapy elicits potent antitumor activity and survival benefit through prolonged activation and tumor infiltration of cytotoxic CD8+ T cells, across αPD-1/αPD-L1 refractory tumors irrespective of TMB, including in the IFN-γ signaling-impaired RVP3 tumor model. The combination therapy promoted M1-like macrophages and activated antigen-presenting cells while decreasing M2-like macrophages and regulatory T cells in a tumor-dependent manner. This was associated with increased levels of IFN-γ, IL-12, chemokine (C-X-C motif) ligand 9 (CXCL9), and CXCL13 in the TME. Further, the combination therapy synergized to promote MHC-I and APM upregulation, and enrichment of JAK/STAT (janus kinase/signal transducers and activators of transcription), IFN-γ-response and antigen processing-associated pathways. A biomarker signature of the mechanism involved in these studies is associated with patients' overall survival across multiple tumor types.

Conclusions: Our findings provide a rationale for combining the tumor-targeting NHS-IL12 with the histone deacetylase inhibitor entinostat in the clinical setting for patients unresponsive to αPD-1/αPD-L1 and/or with innate deficiencies in tumor MHC-I, APM expression, and IFN-γ signaling.

Keywords: combined modality therapy; cytokines; immunotherapy; programmed cell death 1 receptor; tumor microenvironment.


Conflict of interest statement

Competing interests: The Laboratory of Tumor Immunology and Biology/Center for Immuno-Oncology, NCI, has a Cooperative Research and Development Agreement with Syndax Pharmaceuticals and EMD Serono. KCH is now an AstraZeneca employee.

Figures

Figure 1
Figure 1
Entinostat and NHS-IL12 combination elicits potent CD8 T and NK cell-dependent antitumor efficacy in αPD-L1‒resistant tumor models harboring APM deficiencies. (A) Cell surface expression of MHC-I haplotypes and PD-L1 on untreated cells were compared with isotype controls or IFN-γ treated cells for TC-1, TC-1/a9, CMT.64, and RVP3 cell lines. (B) Oncoplot of gene mutations in the IFN-γ response pathway for TC1a9, CMT.64, and RVP3 cell lines; top bar plot shows tumor mutation burden per cell line. (C–E) Graphs show tumor growth for (C) TC-1/a9, (D) CMT.64, and (E) RVP3 tumor-bearing mice treated with PBS or αPD-L1 as per respective schematic insets (blue squares denote αPD-L1 dosing), n=4–5 mice/group. (F–H) Treatment schedule and tumor growth curves of (F) TC-1/a9, (G) CMT.64, and (H) RVP3 tumor-bearing C57Bl/6 mice treated with PBS or entinostat+NHS-IL12, n=4–5 mice/group. (I) Treatment schedule and tumor growth curves of TC-1/a9 tumor-bearing mice treated with PBS, entinostat, and/or NHS-IL12 as per schematic, n=8–9 mice/group. (J) Frequency of tumor non-immune (CD45neg) cells expressing H-2Db and H-2Kb on day 21 post-tumor implant (7 days after last dose of NHS-IL12) as in figure 1I, n=6 mice/group. (K) Treatment schedule and tumor growth curves for TC-1/a9 tumor-bearing nu/nu mice treated with PBS, entinostat, and/or NHS-IL12 as per schematic, n=9–10 mice/group. (L) Treatment schedule, tumor mean and individual tumor growth curves, and survival for TC-1/a9 tumor-bearing mice treated with PBS or entinostat+NHS-IL12 as per schematic with CD8 or NK cell (asialo GM1) depletion, n=4–9 mice/group; ns=not significant. Insets denote number of cured mice/treatment group, and mOS in days (d). All graphs show mean±SEM; data are representative of 1 (B, D–E, J–L), 2 (A, I), 3 (C, G–H) or 4 (F) independent experiments yielding similar results. Tumor volumes: two-way ANOVA; Survival: Mantel-Cox; Bar graphs: one-way ANOVA with Tukey’s multiple comparisons test; *p<0.05, **p<0.01, ***p<0.001, ****p<0.0001. In vivo schemas were created with BioRender.com. αPD-L1, anti-programmed death ligand 1; ANOVA, analysis of variance; APM, antigen processing machinery; IFN-γ, interferon gamma; MHC-I, major histocompatibility complex class I; mOS, median overall survival; NK, natural killer; PBS, phosphate-buffered saline.
Figure 2
Figure 2
Combination therapy increases proliferative CD8+ T and NK cells with an antitumorigenic cytokine and chemokine profile in MHC-I deficient TC-1/a9 tumors. TC-1/a9 tumor-bearing mice treated with PBS, entinostat, NHS-IL12 or entinostat+NHS-IL12 were sacrificed 7 days after last dose of NHS-IL12 as in figure 1I, n=5–6 mice/group (A and B, E and F, H and J) or 2 days after last dose of NHS-IL12, n=3–4 mice/group (C and D, G, K, L). CD8+ T and NK cells were analyzed by flow cytometry. (A) CD8+ TILs as frequency of CD45+ cells. (B) Frequency of CD8+CD44hi TILs. (C–D) CD8+ T cells and granzyme B were examined by immunofluorescence (IF). (C) IF quantification of CD8+ T cells per region of interest (six equal sized regions per tumor; 1 dot=1 region) and mean fluorescence intensity (MFI) of granzyme B per CD8+ T cell in tumor core. (D) Representative images of immune fluorescent staining for DAPI (blue), CD8 (red), and granzyme B (white); scale bar, 50 µm. (E) Frequency of CD8+CD44hi cells expressing Ki67. (F) Tumor CD8+ (CD44hi) TIL-to-Treg and CD8+Ki67+ (CD44hi) TIL-to-Treg ratios. (G) Frequency of CD49b+/NK1.1+ NK cells expressing Ki67. (H) Frequency of splenic CD8+ T cells expressing CD44hi and CD8+CD44hi T cells expressing granzyme B with representative contour plots. (I) Levels of designated cytokines and chemokines in the TME. (J) Levels of serum IFN-γ. (K) Levels of designated cytokines in the TME. (L) Serum IFN-γ kinetics in TC-1/a9 tumor-bearing mice as treated in schematic (blue dashed line indicates timing of NHS-IL12 dosing), n=4 mice/group. Bar graphs show mean±SEM. Data shown are representative of 1 (C, D, F–L) or 2 (A, B, E) independent experiments yielding similar results. Truncated violin plots show values from individual mice with contours denoting distribution density, dashed line denoting median, and dotted lines denoting quartiles. Bar graphs and violin plots: One-way ANOVA with Tukey’s multiple comparisons test; Box plot: Two-way ANOVA with Tukey’s multiple comparisons test. *p<0.05, **p<0.01, ***p<0.001, ****p<0.0001. ANOVA, analysis of variance; IFN-γ, interferon gamma; MHC-I, major histocompatibility complex class I; NK, natural killer; PBS, phosphate-buffered saline; TIL, tumor-infiltrating lymphocyte; TME, tumor microenvironment; Treg, regulatory T cell.
Figure 3
Figure 3
Combination therapy shifts macrophage M1-to-M2 ratio while increasing genes associated with antigen presentation, CD8+ T cells, and monocytic/macrophage lineage. TC-1/a9 tumor bearing mice treated as in figure 1I were sacrificed on day 21 post-tumor implant (7 days after last dose of NHS-IL12), n=6 mice/group. M1-like and M2-like macrophages and DCs in TME and/or spleen were analyzed by flow cytometry. (A) Representative flow cytometry contour plots of M1-like (F4/80+/CD38+/CD206neg) and M2-like (F4/80+/CD38neg/CD206+) TAMs in mice treated with PBS or combination therapy. M1- and M2-like TAMs as (B) frequency of CD45+ cells and (C) number of cells per milligram of tumor. (D) Ratio of M1-to-M2 TAMs. (E) Numbers of DCs per milligram of tumor and PD-L1 expression (gMFI) on DCs. (F) Frequency of CD45+ splenic DCs plus PD-L1 and MHC-II expression (gMFI) on DCs. (G–K) TC-1/a9 tumor-bearing mice treated as in figure 1I were sacrificed on day 25 post-tumor implant and tumor whole transcriptome analysis was performed, n=3–4 mice/group. Volcano plots show differentially expressed genes (p<0.05) relative to PBS control for (G) entinostat, (H) NHS-IL12, and (I) combination therapy, and combination therapy relative to (J) entinostat and (K) NHS-IL12. Right upper quadrant shows genes upregulated. Horizontal lines indicate threshold for significant changes in gene expression. Gene names highlighted are as follows: green, genes associated with antigen presentation; blue, genes associated with T-cell activation; black, genes involved in migration and differentiation of monocytic/macrophage lineages. Bar graphs show mean±SEM. Data are representative of 1 (F–K) to 2 (A–E) independent experiments yielding similar results. Bar graphs: one-way ANOVA with Tukey’s multiple comparisons test. *p<0.05, **p<0.01, ***p<0.001, ****p<0.0001. ANOVA, analysis of variance; DC, dendritic cell; gMFI, geometric mean fluorescence intensity; MHC-II, major histocompatibility complex class II; PBS, phosphate-buffered saline; PD-L1, programmed death ligand 1; TAM, tumor-associated macrophage; TME, tumor microenvironment.
Figure 4
Figure 4
Transcriptomic analysis of combination-treated tumors shows significant enrichment of IFN-γ, antigen processing, and effector T-cell pathways. TC-1/a9 tumor-bearing mice treated as in figure 1I were sacrificed on day 25 post-tumor implant and tumor whole transcriptome analysis was performed. Gene set enrichment analysis was carried out for entinostat+NHS-IL12 combination-treated tumors compared with PBS. Heatmap of significantly altered genes in the (A) Hallmark IFN-γ response and (B) KEGG JAK/STAT signaling pathways. Enrichment plots show NES by ranked genes for (C) Hallmark IFN-γ response, (D) KEGG JAK/STAT signaling, (E) KEGG antigen processing and presentation, (F) GOLDRATH naive versus effector CD8 T-cell response, (G) Hallmark inflammatory response, and (H) KEGG cytokine–cytokine receptor interaction pathways. (I) Top 10 GO/KEGG and (J) selected significant Hallmark pathways. Data represents one experiment, n=3–4 mice/group. Fisher’s test for top pathways applied top 10% genes with p value cut-off of p=0.001. GO, gene ontology; IFN-γ, interferon gamma; JAK, janus kinase; KEGG, Kyoto Encyclopedia of Genes and Genomes; NES, normalized enrichment score; PBS, phosphate-buffered saline; STAT, signal transducers and activators of transcription.
Figure 5
Figure 5
Combination therapy elicited significant tumor control in the MHC-I-deficient CMT.64 lung tumor model, associated with increased T-cell activity and reduced immune regulatory cells, while potentiating peripheral NK and APCs. (A) Treatment schedule, tumor growth curves and survival for CMT.64 tumor-bearing mice treated with PBS, entinostat and/or NHS-IL12. Green area represents time course of entinostat treatment, whereas blue squares denote NHS-IL12 administration, n=5–6 mice/group. Insets denote number of cured mice/group and mOS (days). (B–M) CMT.64 tumor-bearing mice were treated as in online supplemental figure 6 and sacrificed 2 days after last NHS-IL12 administration (day 15), n=3–4 mice/group. Immune and non-immune cells in the TME and spleen were analyzed by flow cytometry. Tumor CD8+ cells were examined by immunofluorescence (IF). (B) Cell surface expression of H-2Kb on tumor non-immune (CD45neg) cells. (C) CD8+ TILs as frequency of CD45+ cells and frequency of CD8+ CD44hi TILs expressing Ki67 and (D) granzyme B. (E) Tumor-infiltrating Tregs as frequency of CD45+ cells and CD8+ TILs-to-Treg ratio. (F) Levels of NHS-IL12 in TME and (G) quantification of CD8+ T cells per region of interest (six equal sized regions per tumor; 1 dot=1 region) in tumor core and representative images for DAPI (blue) and CD8 (red) IF staining; scale bar, 50 µm. (H) Designated cytokines and chemokines in the TME. (I) M1- and M2-like TAMs as frequency of CD45+ cells. (J) Tumor-infiltrating DCs as frequency of CD45+ cells and PD-L1 expression (gMFI) on DCs. (K) Frequency of splenic CD8+ CD44hi T cells expressing granzyme B and Ki67 proteins. (L) Frequency of splenic CD49b+/NK1.1+ NK cells expressing Ki67. (M) DCs as frequency of CD45+ cells, PD-L1 expression (gMFI) of DCs, cDC1 as frequency of DCs and CD45+ splenocytes. Bar graphs show mean±SEM. Data are representative of 1 (B–H, K–M) to 2 (A, I–J) independent experiments yielding similar results. Truncated violin plots show values from individual mice with contours denoting distribution density, dashed line denoting median, and dotted lines denoting quartiles. Tumor volume graphs: two-way ANOVA; Survival: Mantel-Cox; Bar graphs and violin plots: One-way ANOVA with Tukey’s multiple comparisons test; *p<0.05, **p<0.01, ***p<0.001, ****p<0.0001. In vivo schemas were created with BioRender.com. ANOVA, analysis of variance; APC, antigen presenting cell; cDC, conventional type 1 dendritic cell; DC, dendritic cell; gMFI, geometric mean fluorescence intensity; MHC-I, major histocompatibility complex class I; mOS, median overall survival; NK, natural killer; PBS, phosphate-buffered saline; PD-L1, programmed death ligand 1; TAMs, tumor-associated macrophages; TILs, tumor-infiltrating lymphocytes; TME, tumor microenvironment; Tregs, regulatory T cells.
Figure 6
Figure 6
Combination therapy elicited moderate control of IFN-γ-resistant RVP3 tumors, associated with increased B cell and CD8+ TIL activation, and augmented M1-like TAM infiltration. (A) Treatment schedule, tumor growth curves and survival for RVP3 tumor-bearing mice treated with PBS, entinostat, and/or NHS-IL12. Green area represents time course of entinostat treatment while blue squares denote NHS-IL12 administration, n=6–8 mice/group. (B–J) Two days after last NHS-IL12 administration (day 17), n=3–4 mice/group, TME cells were analyzed by flow cytometry. (B) Cell surface expression of H-2Kb as frequency of tumor non-immune (CD45neg) cells. (C) Expression frequencies of granzyme B+ and/or Ki67+ in CD8+CD44hi TILs. (D) Ratio of M1- to M2-like TAMs. (E) PD-L1 and MHC-II expression (gMFI) on tumor infiltrating and splenic DCs. (F) Frequency of CD49+ NK cells expressing Ki67 in TME and spleen. (G) B cells (CD19+) as frequency of CD45+ cells and frequency of B cells expressing Ki67. (H) Levels of NHS-IL12 and designated cytokines and (I) chemokines in TME. (J) Pearson correlation of CXCL13 tumor levels from individual combination-treated mice with the frequency of Ki67+ B cells and with frequency of B cells (CD19+) in the TME. (K) Serum levels of designated cytokines and chemokines. Bar graphs show mean±SEM from one experiment. Truncated violin plots show values from individual mice with contours denoting distribution density, dashed line denoting median, and dotted lines denoting quartiles. Tumor volume graphs: two-way ANOVA; Survival: Mantel-Cox; Bar graphs and violin plots: One-way ANOVA with Tukey’s multiple comparisons test; *p<0.05, **p<0.01, ***p<0.001, ****p<0.0001. In vivo schemas were created with BioRender.com. ANOVA, analysis of variance; DCs, dendritic cells; IFN-γ, interferon gamma; gMFI, geometric mean fluorescence intensity; MHC-II, major histocompatibility complex class II; NK, natural killer; PBS, phosphate-buffered saline; PD-L1, programmed death ligand 1; TAM, tumor-associated macrophage; TIL, tumor-infiltrating lymphocyte; TME, tumor microenvironment.
Figure 7
Figure 7
Combination therapy-associated signature shows translational relevance in HPV+ and HPVneg malignancies. TIMER (A) and GEPIA (B–C) TCGA data analysis platforms were used for producing immune correlations and Kaplan-Meier survival curves across multiple cancers. (A) Dot plots of two-tailed Spearman’s correlation of CD8+ T cell, M1- and M2-macrophage tumor infiltration to genes (IFNG, IL12B, NLRC5, CXCL9, CXCL13) encoding combination therapy-induced key immune markers from TCGA CESC dataset (n=291 patients). Spearman’s r >0 indicates positive correlation. Spearman’s r <0 indicates negative correlation. Line represents best-fitting regression line with 95% CIs (gray shading). (B) Correlation between clinical overall survival for designated cancers with key immune signature (IFNG, IL12B, CD8B, GZMB, NLRC5, and HLA-A) observed in murine models of MHC deficiency. (C) HR of key immune signature genes to survival across malignancies. Kaplan-Meier curves were generated with a median high/low 50% cut-off. Mouse and human icons created with BioRender.com. CESC, cervical squamous cell carcinoma and endocervical adenocarcinoma; CI, confidence interval; GEPIA, Gene Expression Profiling Interactive Analysis; HNSC, head and neck squamous cell carcinoma; HPV, human papilloma virus; HR, hazard ratio; LUAD, lung adenocarcinoma; MHC, major histocompatibility complex; SARC, sarcoma; SKCM, skin cutaneous melanoma; TCGA, The Cancer Genome Atlas; TIMER, Tumor Immune Estimation Resource; OV, ovarian serous cystadenocarcinoma.

References

    1. Pitt JM, Vétizou M, Daillère R, et al. . Resistance mechanisms to immune-checkpoint blockade in cancer: tumor-intrinsic and -extrinsic factors. Immunity 2016;44:1255–69. 10.1016/j.immuni.2016.06.001 - DOI - PubMed
    1. Schoenfeld AJ, Hellmann MD. Acquired resistance to immune checkpoint inhibitors. Cancer Cell 2020;37:443–55. 10.1016/j.ccell.2020.03.017 - DOI - PMC - PubMed
    1. Yoshihama S, Cho SX, Yeung J, et al. . NLRC5/CITA expression correlates with efficient response to checkpoint blockade immunotherapy. Sci Rep 2021;11:3258. 10.1038/s41598-021-82729-9 - DOI - PMC - PubMed
    1. Fabrizio D, Cristescu R, Albacker L, et al. . Real-world prevalence across 159 872 patients with cancer supports the clinical utility of TMB-H to define metastatic solid tumors for treatment with pembrolizumab. Ann Oncol 2021;32:1193–4. 10.1016/j.annonc.2021.05.805 - DOI - PubMed
    1. Marabelle A, Fakih M, Lopez J, et al. . Association of tumour mutational burden with outcomes in patients with advanced solid tumours treated with pembrolizumab: prospective biomarker analysis of the multicohort, open-label, phase 2 KEYNOTE-158 study. Lancet Oncol 2020;21:1353–65. 10.1016/S1470-2045(20)30445-9 - DOI - PubMed

Publication types