. 2022 Jun 28;13(1):3729.
doi: 10.1038/s41467-022-31280-w.

The genomic basis of the plant island syndrome in Darwin's giant daisies

Affiliations

The genomic basis of the plant island syndrome in Darwin's giant daisies

José Cerca et al. Nat Commun. .

Abstract

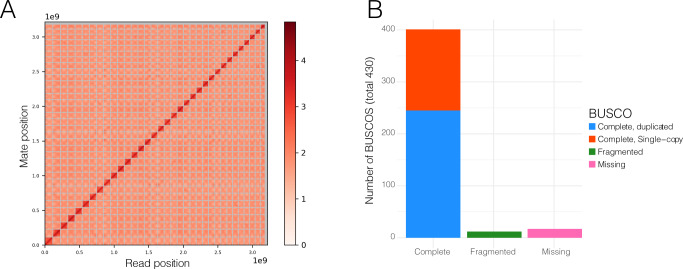
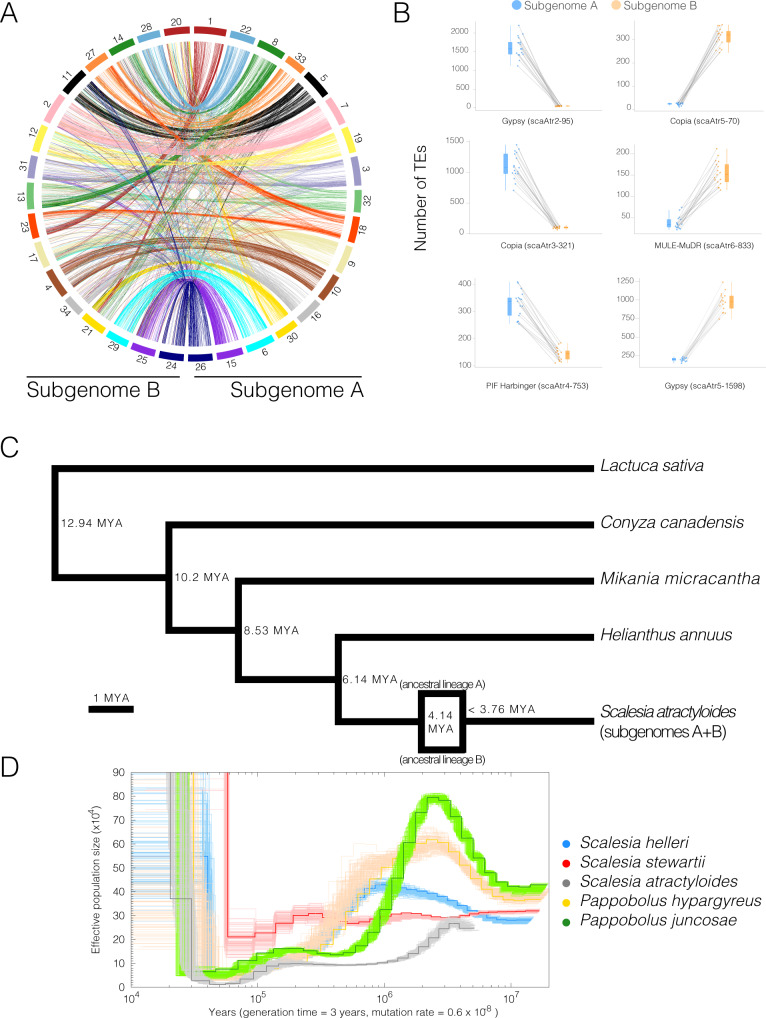
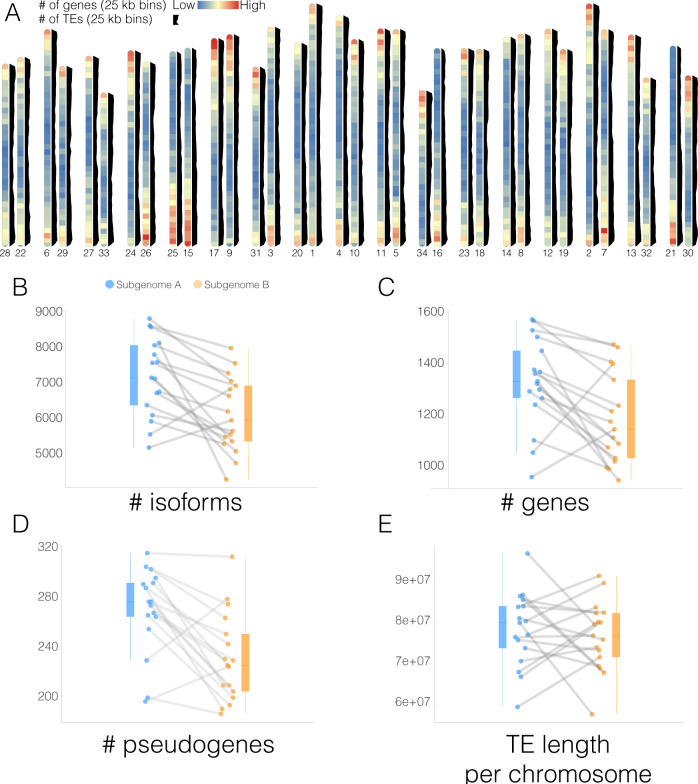
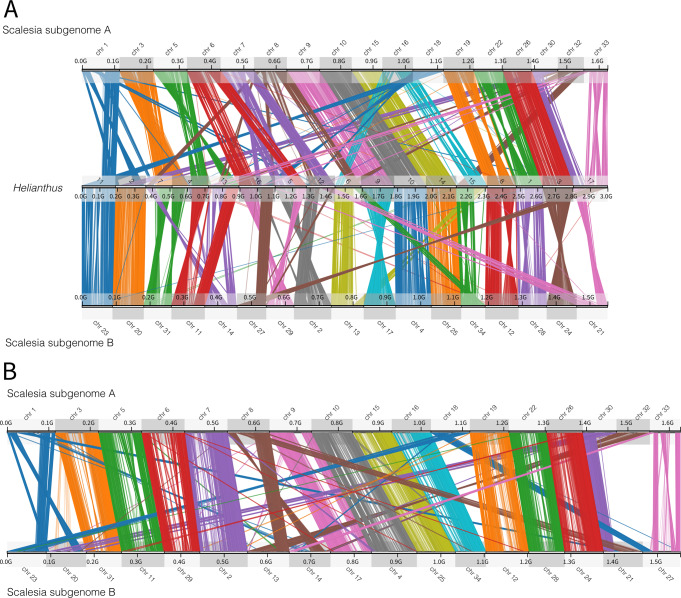
The repeated, rapid and often pronounced patterns of evolutionary divergence observed in insular plants, or the 'plant island syndrome', include changes in leaf phenotypes, growth, as well as the acquisition of a perennial lifestyle. Here, we sequence and describe the genome of the critically endangered, Galápagos-endemic species Scalesia atractyloides Arnot., obtaining a chromosome-resolved, 3.2-Gbp assembly containing 43,093 candidate gene models. Using a combination of fossil transposable elements, k-mer spectra analyses and orthologue assignment, we identify the two ancestral genomes, and date their divergence and the polyploidization event, concluding that the ancestor of all extant Scalesia species was an allotetraploid. There are a comparable number of genes and transposable elements across the two subgenomes, and while their synteny has been mostly conserved, we find multiple inversions that may have facilitated adaptation. We identify clear signatures of selection across genes associated with vascular development, growth, adaptation to salinity and flowering time, thus finding compelling evidence for a genomic basis of the island syndrome in one of Darwin's giant daisies.


Conflict of interest statement

The authors declare no competing interests.

Figures

Fig. 1
Fig. 1. Chromosome-resolved assembly of the Scalesia atractyloides nuclear genome.
A Link density histogram, with 34 linkage groups (chromosome models) identified by contiguity ligation sequencing. The x and y axes show mapping positions of the first and second read in read pairs. B Viridiplantae BUSCO set, which offers a characterisation of conserved orthologue genes.
Fig. 2
Fig. 2. Subgenomes and evolutionary history of Scalesia.
A Circos plots displaying the 34 chromosome models in the assembly. Pairs are organised to the left and right from the top, and have the same colour coding. B Selected families of transposable elements (TEs) that are differently represented on each subgenome (17 pairwise comparisons; each TE is labelled after the assembly (scaAtr), round and family number (2–95) after RepeatMasker). These TE families were likely active while the two subgenomes were separated, being thus unevenly represented. These highlight subgenome identification. Each data point corresponds to a chromosome in a subgenome (subgenome A in blue and B in orange). Chromosome pairs are linked by grey lines. C Single-copy ortholog phylogeny of the studied Asteraceae genome assemblies. Node ages are provided to the right of each node, as well as the predicted time for the polyploidization event. D Pairwise sequentially Markovian coalescent (PSMC) estimation of the demographic history of Scalesia atractyloides, two other Scalesia species, and two members of the Pappobolus genus, which is the sister taxon to Scalesia using bootstrapping (100 replicates). PSMC runs for the whole genome and subgenomes yielded similar results (Supplementary Fig. 03).
Fig. 3
Fig. 3. Subgenome evolution and characterisation.
A Ideogram with gene and transposable element distribution in 25-kbp bins. Gene density is plotted in chromosome representations and transposable element distribution is plotted to the side of each chromosome in black. Chromosomes are arranged in homoelogous pairs. B The number of isoforms detected for each subgenome. Each data point corresponds to a chromosome in a subgenome (subgenome A in blue and B in orange; 17 pairwise comparisons; subgenome A: min = 5176; max = 8817, avg = 7175; Subgenome B: min = 4277; max = 7982, avg = 6103). Chromosome pairs are linked by grey lines. C Number of genes detected for each subgenome (17 pairwise comparisons; subgenome A: min = 1571; max = 1571, avg = 1327; Subgenome B: min = 944; max = 1474, avg = 1181). D The number of pseudogenes detected for each subgenome (17 pairwise comparisons; Subgenome A: min = 196; max = 315, avg = 270; subgenome B: min = 186; max = 312, avg = 230). E Length of transposable elements detected for each subgenome (17 pairwise comparisons; subgenome A: min = 59,440,194; max = 97,142,619, avg = 78,545,717; Subgenome B: min = 57,631,669; max = 91,646,014, avg = 76,870,839).
Fig. 4
Fig. 4. Chromosome stability plots.
These reveal the role of inversions and translocations in the differential in each subgenome. A Chromosome stability plot between the two Scalesia subgenomes and the Helianthus annuus genome. Each line connects a pair of orthologous genes, colour-coded by chromosome pair. B Chromosome stability between the two Scalesia subgenomes. Each line connects orthologous genes in subgenomes A and B, colour-coded by chromosome pair.
Fig. 5
Fig. 5. Positive selection and gene-family expansion across the Scalesia atractyloides genome.
A GO term enrichment of the genes under selection across the genome. GO terms assigned to at least four genes are labelled. Size refers to the number of genes associated with a particular GO term. B GO term enrichment of the genes belonging to expanded gene families across the genome according to a CAFE analysis. Only GOs within a group of three or more overlapping circles are included. Uniqueness measures the degree to which a particular GO term is distinct relative to the whole list.

References

    1. Darwin, C. On the origin of species by means of natural selection, or, The preservation of favoured races in the struggle for life. (1859). - PMC - PubMed
    1. Wallace, A. R. The Malay Archipelago: The Land of the Orang-utan and the Bird of Paradise; a Narrative of Travel, with Studies of Man and Nature (Courier Corporation, 1962).
    1. Mayr, E. Systematics and the Origin of Species from the Viewpoint of a Zoologist (Columbia Uni. Press, 1942).
    1. Emerson BC. Speciation on islands: what are we learning? Biol. J. Linn. Soc. Lond. 2008;95:47–52. doi: 10.1111/j.1095-8312.2008.01120.x. - DOI
    1. Lomolino, M. V., Riddle, B. R., Whittaker, R. J., Brown, J. H. & Lomolino, M. V. Biogeography (Sunderland, Mass: Sinauer Associates, 2017).

Publication types

Substances