. 2022 Jun 28;13(1):3728.
doi: 10.1038/s41467-022-31331-2.

MYCN-driven fatty acid uptake is a metabolic vulnerability in neuroblastoma

Affiliations

MYCN-driven fatty acid uptake is a metabolic vulnerability in neuroblastoma

Ling Tao et al. Nat Commun. .

Abstract

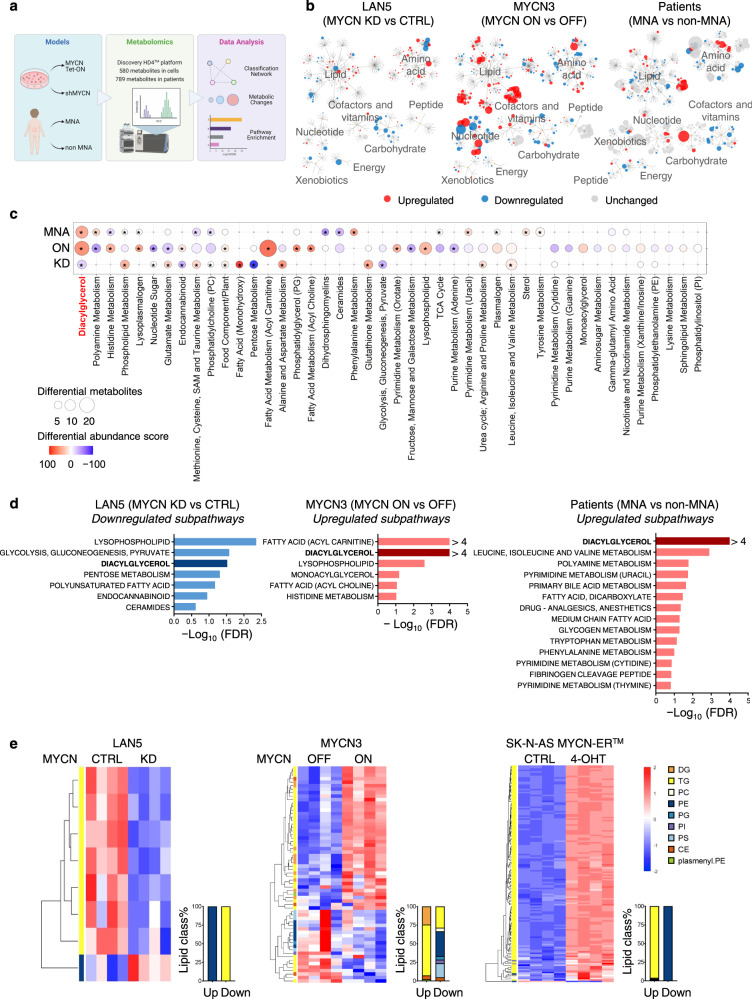
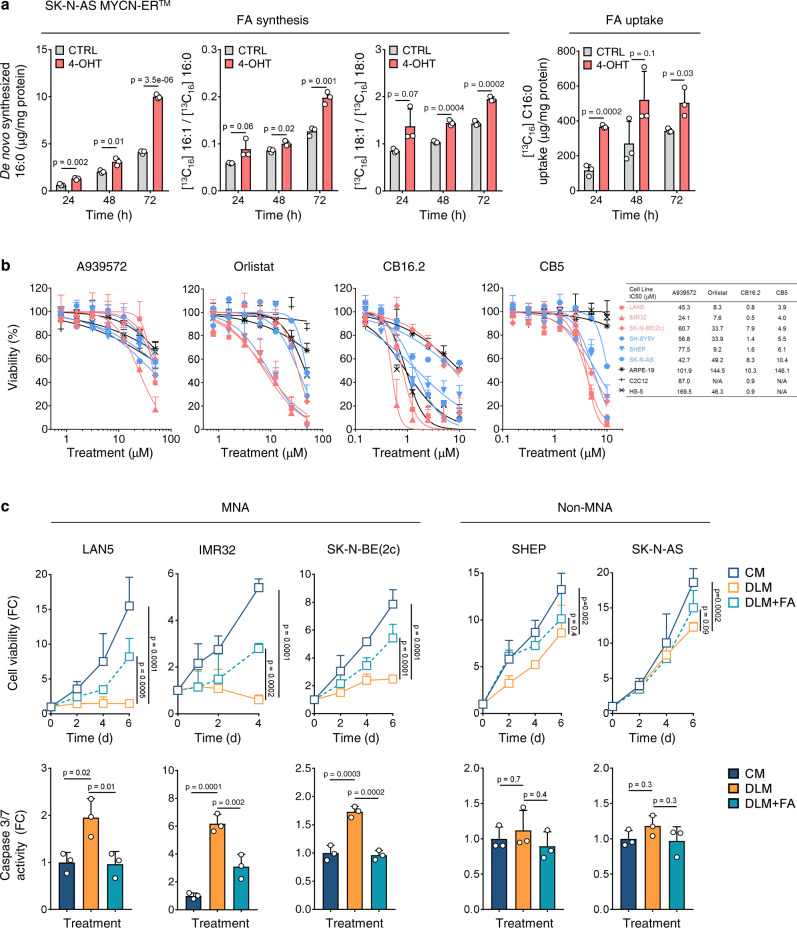
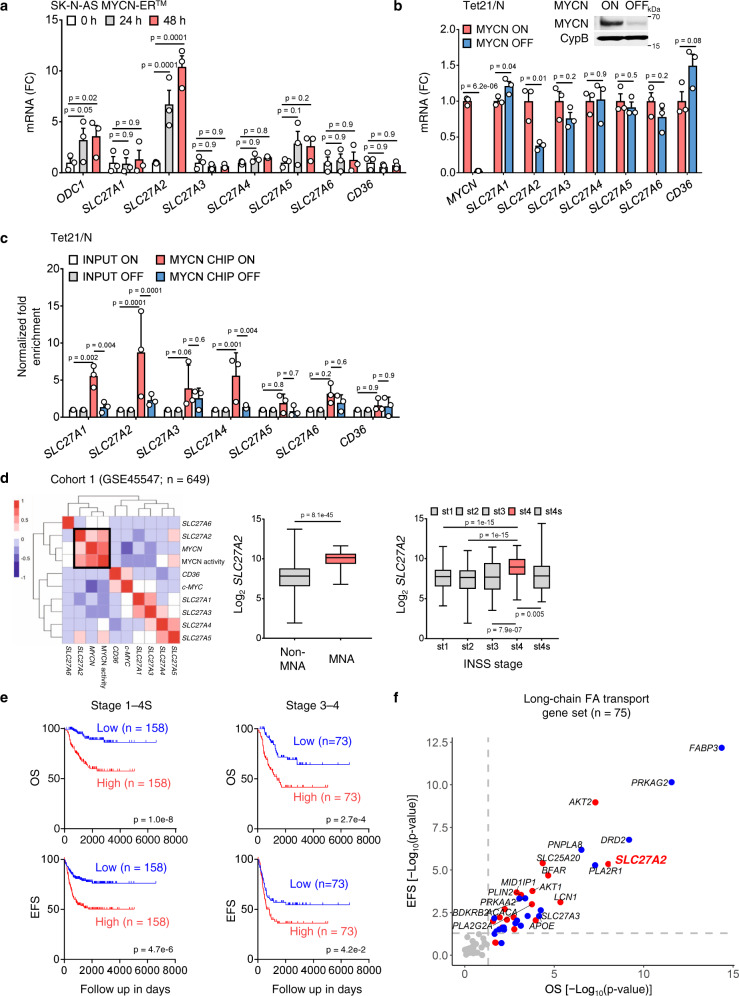
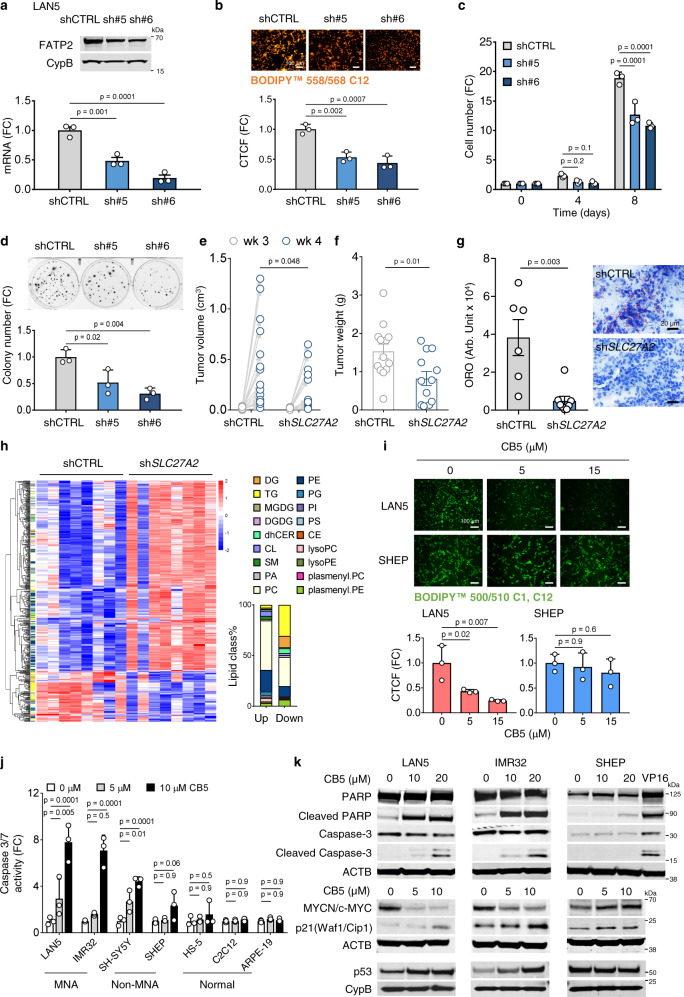
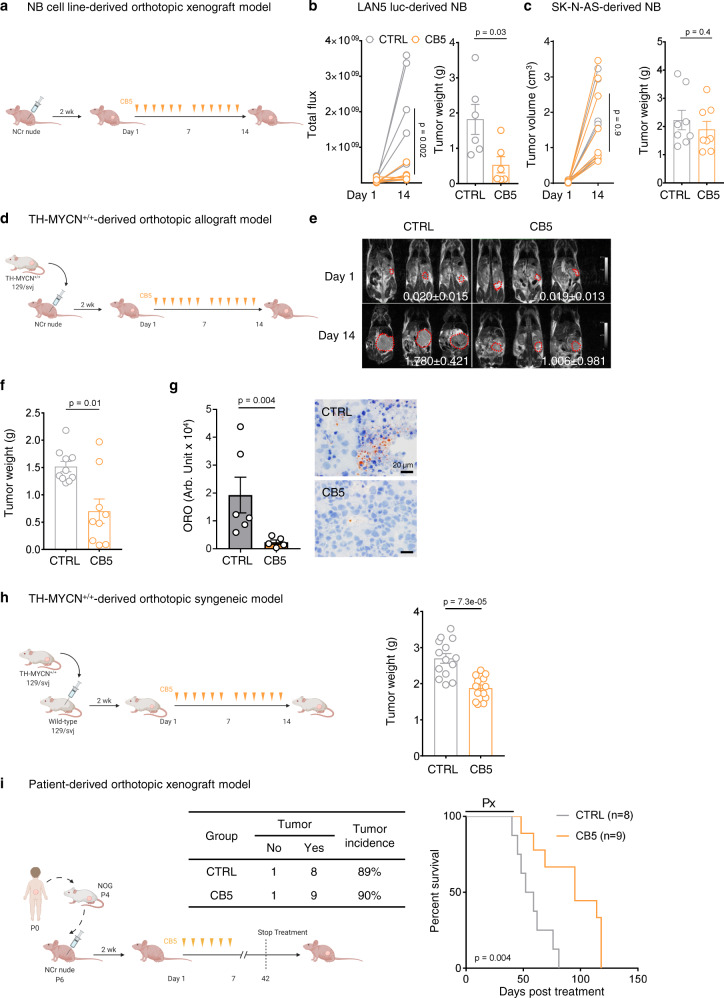
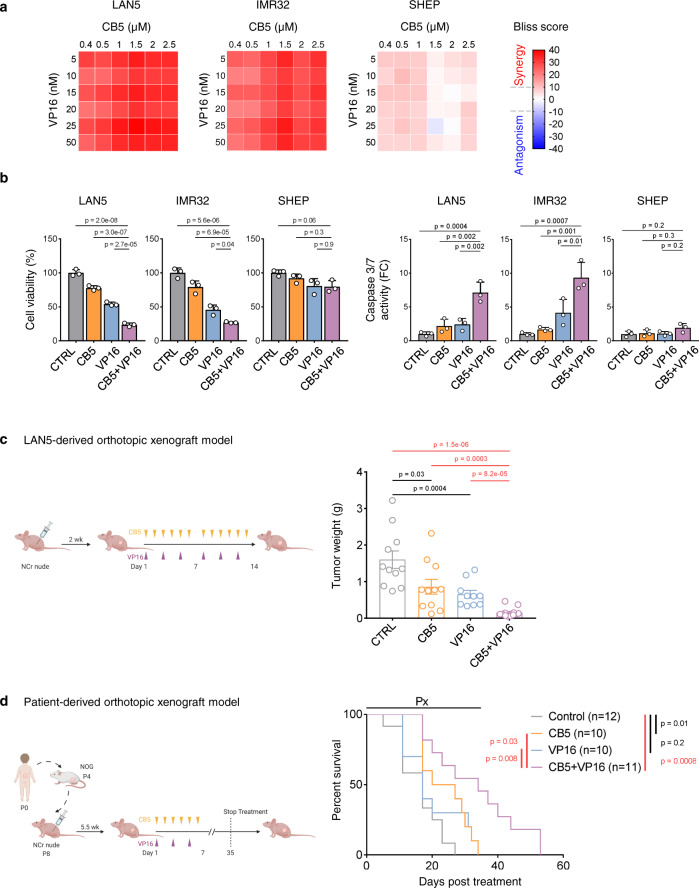
Neuroblastoma (NB) is a childhood cancer arising from sympatho-adrenal neural crest cells. MYCN amplification is found in half of high-risk NB patients; however, no available therapies directly target MYCN. Using multi-dimensional metabolic profiling in MYCN expression systems and primary patient tumors, we comprehensively characterized the metabolic landscape driven by MYCN in NB. MYCN amplification leads to glycerolipid accumulation by promoting fatty acid (FA) uptake and biosynthesis. We found that cells expressing amplified MYCN depend highly on FA uptake for survival. Mechanistically, MYCN directly upregulates FA transport protein 2 (FATP2), encoded by SLC27A2. Genetic depletion of SLC27A2 impairs NB survival, and pharmacological SLC27A2 inhibition selectively suppresses tumor growth, prolongs animal survival, and exerts synergistic anti-tumor effects when combined with conventional chemotherapies in multiple preclinical NB models. This study identifies FA uptake as a critical metabolic dependency for MYCN-amplified tumors. Inhibiting FA uptake is an effective approach for improving current treatment regimens.


Conflict of interest statement

The authors declare no competing interests.

Figures

Fig. 1
Fig. 1. MYCN reprograms NB metabolism.
a Untargeted metabolomics profiling workflow using UHPLC-MS/MS and GC-MS (Discovery HD4 platform, Metabolon Inc.) in LAN5 cells (MYCN KD for 0, 72, and 96 h, n = 4 each), MYCN3 cells (MYCN-ON for 0, 48, and 72 h, n = 4 each), and primary tumors (MNA, n = 18; non-MNA, n = 18). b Metabolite classification network. Each circle represents a metabolite. Circle size indicates absolute log2FC of metabolite level in comparisons of MYCN KD 72 h vs. CTRL, MYCN-ON 72 h vs. MYCN-OFF and MNA vs. non-MNA. Red=upregulated metabolite; blue=downregulated metabolite (p ≤ 0.05). One-way ANOVA or Welch’s two-sample t-test was used to compare metabolite levels between groups. c Metabolic changes within subpathways. Comparison groups are the same as in (b). Differential abundance scores were calculated from subpathways containing at least three measured metabolites. 100 or −100 = all metabolites in the subpathway are upregulated or downregulated (p ≤ 0.05). Circle size=number of differentially altered metabolites (p ≤ 0.05). *indicates FDR < 0.25, hypergeometric test with p-value adjusted by Benjamini–Hochberg procedure. d Pathway enrichment analysis using GSEA-based algorithm. Subpathways with FDR < 0.25 were selected and ranked by –log10(FDR). Red=upregulated subpathway; blue=downregulated subpathway. e Lipidomics profiling in LAN5 shMYCN (CTRL and MYCN KD for 72 h), MYCN3 [MYCN-OFF (-DOX) and MYCN-ON (+DOX) for 72 h] and SK-N-AS MYCN-ER [MYCN-OFF (−4-OHT) and MYCN-ON (+4-OHT) for 48 h] cells (n = 4 each). Two-sided unpaired t-test; p-value adjusted by Benjamini–Hochberg procedure to obtain FDR. Significantly altered lipids (FDR < 0.25) were selected for heatmap (color is scaled by Z-score: red=upregulated; blue=downregulated). Percentages of upregulated and downregulated lipid classes are shown in stacked bar graphs. DG diacylglycerol, TG triacylglycerol, PC phosphatidylcholine, PE phosphatidylethanolamine, PG phosphatidylglycerol, PI phosphatidylinositol, PS phosphatidylserine, CE cholesteryl ester, plasmenyl. PE plasmenyl phosphatidylethanolamine. KD knockdown, MNA MYCN-amplified, non-MNA non MYCN-amplified. Source data are provided in the Source Data file.
Fig. 2
Fig. 2. MNA cell survival relies on FA uptake.
a Stable isotope tracing of FA synthesis and FA uptake in SK-N-AS MYCN-ER cells with or without 4-OHT (500 nM) for 24, 48, and 72 h. Mean ± SD (n = 3); two-sided unpaired t-test per time point. b Viability of NB and normal cells upon 72 h treatment with FA synthesis inhibitors (A939572, orlistat) and FA uptake inhibitors (CB16.2 and CB5). IC50 calculated in GraphPad Prism (7.01). Mean ± SD (n = 3). c Top, cell viability in complete media, delipidized media, and delipidized media supplemented with 0.025% FAs. MNA: LAN5 (0–6 day), IMR32 (0–4 day) and SK-N-BE(2c) (0–6 day); non-MNA: SHEP (0–6 day) and SK-N-AS (0–6 day). Mean ± SD (n = 3); two-way ANOVA with Dunnett’s multiple comparisons test. Bottom, Caspase 3/7 activity in complete media, delipidized media, and delipidized media supplemented with 0.025% FAs for 4 days. Mean ± SD (n = 3); one-way ANOVA with Dunnett’s multiple comparisons test. FC fold change, CM complete media, DLM delipidized media. Source data are provided in the Source Data file.
Fig. 3
Fig. 3. MYCN directly upregulates FA transporter SLC27A2.
a FA transporters (SLC27A1–6, CD36) and ODC1 mRNA expression in SK-N-AS MYCN-ER cells (1 µM 4-OHT for 0, 24, 48 h). Mean±SEM (n = 3); two-way ANOVA with Dunnett’s multiple comparisons test. b FA transporters (SLC27A1–6, CD36) mRNA expression in Tet21/N cells (±2 µg/mL DOX for 24 h). Mean±SEM (n = 3); two-sided unpaired t-test. MYCN protein expression in Tet21/N cells (−DOX, MYCN-ON and +DOX, MYCN-OFF). c MYCN ChIP-qPCR assays in TET21/N cells (±2 µg/mL DOX for 48 h). Input and MYCN ChIP samples were analyzed by qPCR using specific primers for SLC27A1–6 and CD36. Mean±SD (n = 3); two-way ANOVA with Dunnett’s multiple comparisons test. d Gene expression analysis in Cohort 1 (GSE45547). Left, correlation matrix of transporter gene expression, MYCN expression/activity, and c-MYC expression. Correlations with p-values < 0.05 are represented in the heatmap. Red = positive; blue = negative correlation. Middle, SLC27A2 expression in MNA (n = 93) and non-MNA patients (n = 550). Two-sided unpaired Welch’s t-test. Right, SLC27A2 expression in stage 1–4 S patients (stage 1: n = 153; stage 2: n = 113; stage 3: n = 91; stage 4: n = 214; stage 4 s: n = 78). One-way ANOVA with Tukey’s multiple comparisons test. Box plots indicate median (middle line), 25th and 75th percentiles (box), as well as min and max (whisker). e, f Survival analyses in Cohort 1 (GSE45547). e OS and EFS rates for stage 1–4 S and stage 3–4 patients with high (top third) or low (bottom third) SLC27A2 expression. f OS and EFS predictions for genes in the long-chain FA transport geneset (GO: 0015909); –log10(p-value). Kaplan–Meier method was used to plot survival curves, and log-rank test was used for statistical analysis. Red=high expression has poor prognosis (p < 0.05); blue = low expression has poor prognosis (p < 0.05); gray = no significance. FC fold change, OS overall survival, EFS event-free survival. Source data are provided in the Source Data file.
Fig. 4
Fig. 4. Suppressing FA uptake impairs NB cell survival.
a Silencing SLC27A2 in LAN5 cells. Two shSLC27A2 GIPZ vectors tested, with empty GIPZ vector as control. Mean ± SEM (n = 3). b FA uptake in LAN5 shCTRL and shSLC27A2 cells. Cells stained with the FA analog BODIPY 558/568 C12 and quantified as CTCF by ImageJ2. Mean±SD (n = 3). c Cell growth in LAN5 shCTRL and shSLC27A2 cells. Mean ± SD (n = 3). d Clonogenic assay in LAN5 shCTRL and shSLC27A2 cells. Mean ± SD (n = 3); eh LAN5 shCTRL and shSLC27A2 orthotopic xenograft model. e Tumor volumes at weeks 3 and 4 post-implantation. CTRL = 15; shSLC27A2 = 14; two-way ANOVA with Sidak’s multiple comparisons test. f Tumor weights at week 5 post-implantation. Mean ± SEM (CTRL = 13, shSLC27A2 = 12); two-sided unpaired Mann–Whitney test. g Oil Red O staining of intratumoral lipids. Mean ± SEM (CTRL = 6, shSLC27A2 = 8); two-sided unpaired Mann–Whitney test. h Lipidomics profiling of shCTRL and shSLC27A2 tumors (n = 8 each). Lipids (FDR < 0.25, absolute FC > 2) are shown in the heatmap (color scaled by Z-score: red = upregulated; blue = downregulated). MGDG monogalactosyldiacylglycerol, DGDG digalactosyldiacylglycerol, dhCER dihydroceramides, CL cardiolipin, SM sphingomyelin, PA phosphatidic acid, lyso.PC lysophosphatidylcholine, lyso.PE lysophosphatidylethanolamine, plasmenyl.PC plasmenylphosphatidylcholine, all other abbreviations consistent with Fig. 1e. i FA uptake following CB5 treatment in LAN5 and SHEP cells (0–15 µM, 5 min). Cells stained with BODIPY 500/510 C1, C12 and quantified as CTCF by ImageJ2. Mean ± SD (n = 3). j Caspase 3/7 activity of NB and normal cells after CB5 treatment (0–10 µM, 24 h). Mean ± SD (n = 3). k Apoptosis, p53/p21, and MYCN/c-MYC protein expression in LAN5, IMR32, and SHEP with CB5 (0–20 µM, 16–24 h). VP16 (10 µM, 24 h) = positive CTRL. Representative blots from three independent experiments are shown. FC fold change, Arb. Unit arbitrary unit. a, b, d, and i, one-way ANOVA with Dunnett’s multiple comparisons test; c and j, two-way ANOVA with Dunnett’s multiple comparisons test. Source data are provided in the Source Data file.
Fig. 5
Fig. 5. Suppressing FA uptake exerts anti-tumor effects in multiple preclinical models.
ac NB cell line-derived orthotopic xenograft model. a LAN5 or SK-N-AS cells were orthotopically implanted in NCr nude mice. Two weeks later mice were treated with vehicle or CB5 (25 mg/kg, b.i.d., 6 days/week) for 2 weeks. b LAN5 tumor sizes (IVIS) and weights after treatment. Mean±SEM (CTRL = 6, CB5 = 6); two-way ANOVA with Sidak’s multiple comparisons test (left); two-sided unpaired Mann–Whitney test (right). c SK-N-AS tumor volumes (MRI) and weights after treatment. Mean ± SEM (CTRL = 8, CB5 = 8); two-way ANOVA with Sidak’s multiple comparisons test (left); two-sided unpaired Mann–Whitney test (right). dg TH-MYCN+/+-derived orthotopic allograft model. d Cells from one TH-MYCN+/+ tumor were orthotopically implanted in NCr nude mice. Two weeks later mice were treated with vehicle or CB5 (25 mg/kg, b.i.d., 6 days/week) for 2 weeks. e Tumor volumes (MRI) on treatment days 1 and 14. Tumors were framed and quantified; representative images and mean ± SEM are shown (CTRL = 10, CB5 = 9). f Tumor weights at treatment day 14. Mean ± SEM (CTRL = 10, CB5 = 9); two-sided unpaired Mann–Whitney test. g Oil Red O staining of intratumoral lipids. Mean±SEM (CTRL = 6, CB5 = 5 responsive tumors); two-sided unpaired Mann–Whitney test. h Cells from one TH-MYCN+/+ tumor were orthotopically implanted in syngeneic 129 × 1/svj wild-type mice. Two weeks later mice were treated with vehicle or CB5 (30 mg/kg, b.i.d., 6 days/week) for 2 weeks. Tumors were weighed on treatment day 14. Mean ± SEM (CTRL = 14, CB5 = 13); two-sided unpaired Mann–Whitney test. i Cells from one MNA patient tumor (P6) were orthotopically implanted in NCr nude mice, and 2 weeks later mice were treated with vehicle or CB5 (25 mg/kg, b.i.d., 6 days/week) for 6 weeks. Tumor incidence analyzed by Fisher’s exact test (CTRL = 8, CB5 = 9). Kaplan–Meier survival analyzed by log-rank test. Arb. Unit arbitrary unit, Px treatment period. Source data are provided in the Source Data file.
Fig. 6
Fig. 6. Suppressing FA uptake promotes the efficacy of conventional chemotherapies.
a Synergy analyses in MNA (LAN5 and IMR32) and non-MNA (SHEP) cells treated with CB5 (0.4–2.5 µM), VP16 (5–50 nM) and their combination for 72 h. Heatmap represents mean Bliss scores from three independent experiments. Bliss score > 10 indicates synergy. b Cell viability and Caspase 3/7 activity after single and combination treatments. Cells were treated with CTRL, CB5 (3 µM), VP16 (80 nM), or their combination for 72 h. Mean ± SD (n = 3); one-way ANOVA with Tukey’s multiple comparisons test. c Anti-tumor activity of CB5 + VP16 combination therapy in LAN5-derived orthotopic xenografts. LAN5 cells were implanted in the renal capsule of NCr nude mice. Two weeks after implantation, mice were treated with CTRL (vehicle), CB5 (15 mg/kg, b.i.d. 6 days/week), VP16 (8 mg/kg daily, 3 days/week) or their combination for 2 weeks. Tumor weights after 2 weeks of treatment are shown. Mean ± SEM (CTRL = 11, CB5 = 11, VP16 = 10, CB5 + VP16 = 12); two-sided unpaired Mann–Whitney test. d Survival analysis in patient-derived orthotopic xenografts. Cells prepared from one MNA patient tumor (P8) were implanted in the renal capsule of NCr nude mice. Five and half weeks after implantation, mice were treated with CTRL (vehicle), CB5 (15 mg/kg, b.i.d. 6 days/week), VP16 (6 mg/kg daily, 3 days/week), or their combination for 5 weeks. Survival was plotted as a Kaplan–Meier curve and analyzed by the log-rank test (CTRL = 12, CB5 = 10, VP16 = 10, CB5 + VP16 = 11). Px treatment period; FC fold change. Source data are provided in the Source Data file.

References

    1. Park JR, Eggert A, Caron H. Neuroblastoma: biology, prognosis, and treatment. Hematol./Oncol. Clin. North Am. 2010;24:65–86. doi: 10.1016/j.hoc.2009.11.011. - DOI - PubMed
    1. Brodeur GM, Seeger RC, Schwab M, Varmus HE, Bishop JM. Amplification of N-myc in untreated human neuroblastomas correlates with advanced disease stage. Science. 1984;224:1121–1124. doi: 10.1126/science.6719137. - DOI - PubMed
    1. Weiss WA, Aldape K, Mohapatra G, Feuerstein BG, Bishop JM. Targeted expression of MYCN causes neuroblastoma in transgenic mice. EMBO J. 1997;16:2985–2995. doi: 10.1093/emboj/16.11.2985. - DOI - PMC - PubMed
    1. Wolpaw, A. J. et al. Drugging the ‘undruggable’ MYCN oncogenic transcription factor: overcoming previous obstacles to impact childhood cancers. Cancer Res.81, 1627–1632 (2021). - PMC - PubMed
    1. Qing G, et al. Combinatorial regulation of neuroblastoma tumor progression by N-Myc and hypoxia inducible factor HIF-1alpha. Cancer Res. 2010;70:10351–10361. doi: 10.1158/0008-5472.CAN-10-0740. - DOI - PMC - PubMed

Publication types

LinkOut - more resources