. 2022 Jun;3(6):723-733.
doi: 10.1038/s43018-022-00388-9. Epub 2022 Jun 28.

Multimodal data integration using machine learning improves risk stratification of high-grade serous ovarian cancer

Affiliations

Multimodal data integration using machine learning improves risk stratification of high-grade serous ovarian cancer

Kevin M Boehm et al. Nat Cancer. 2022 Jun.

Abstract

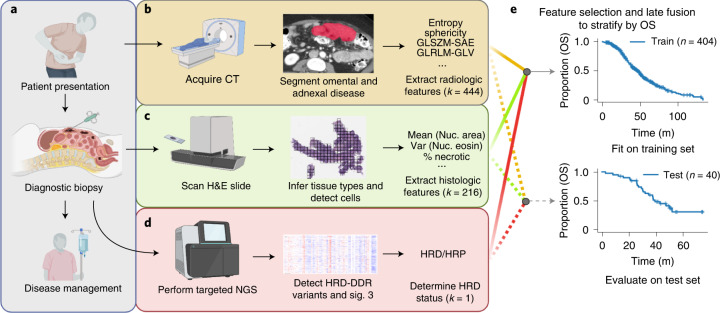
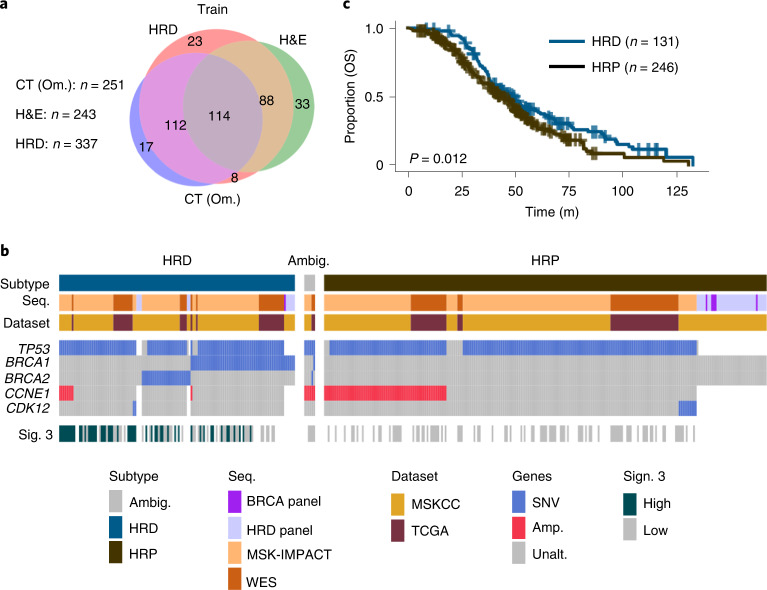
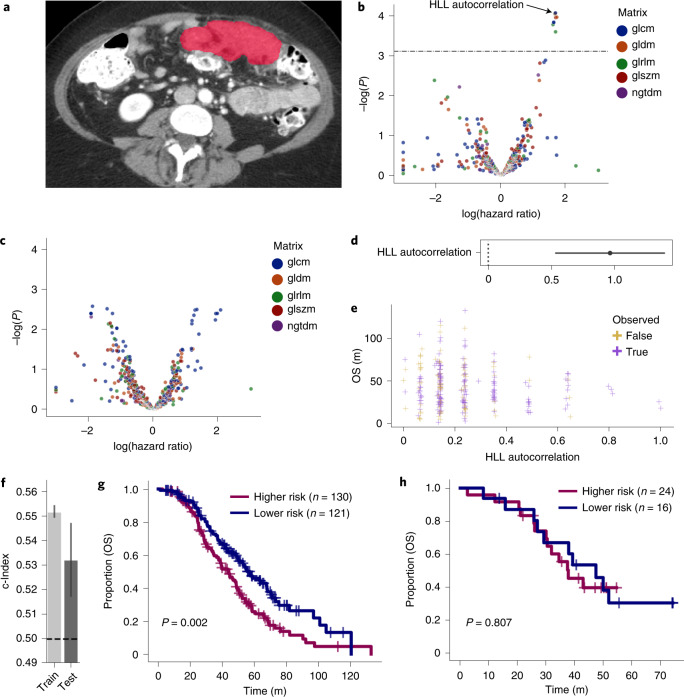
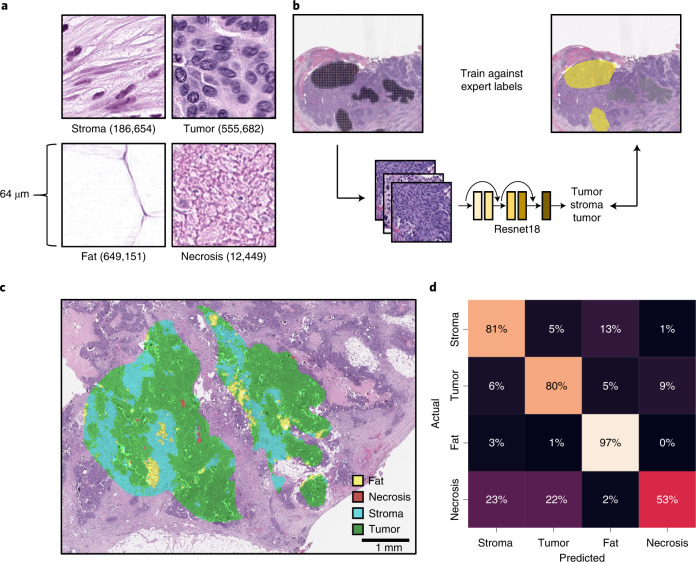
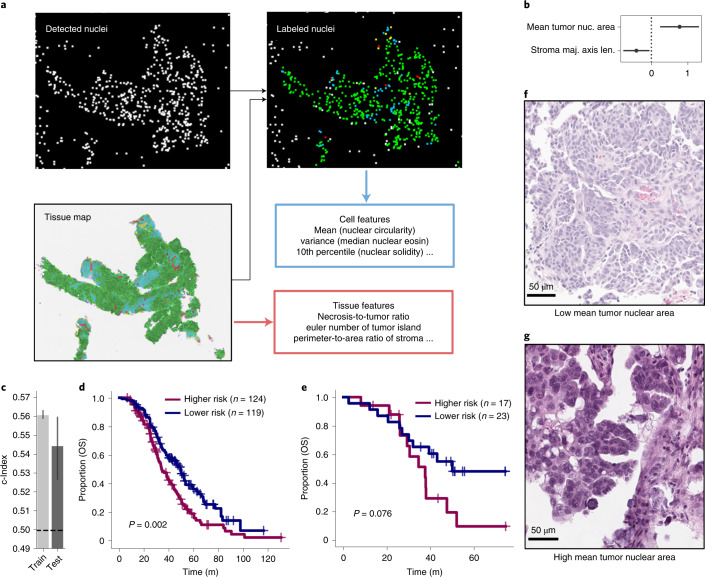
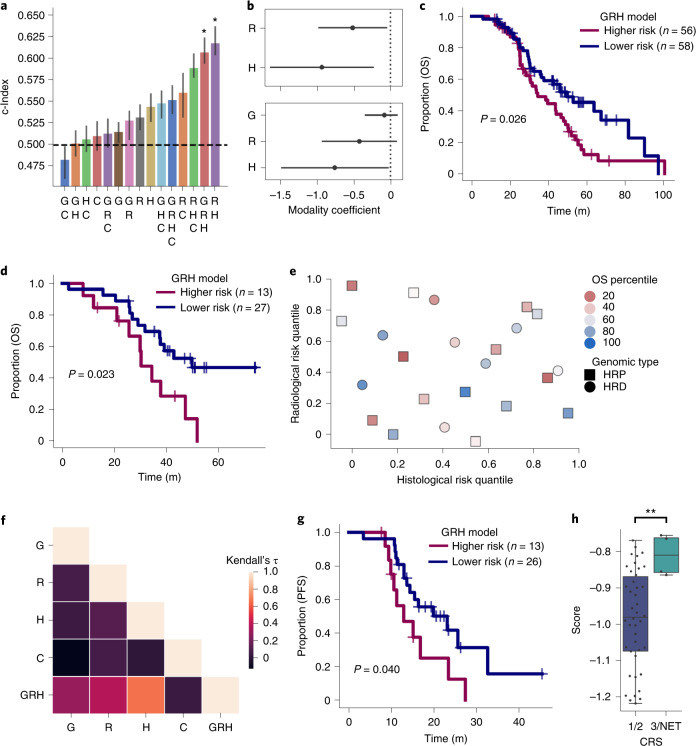
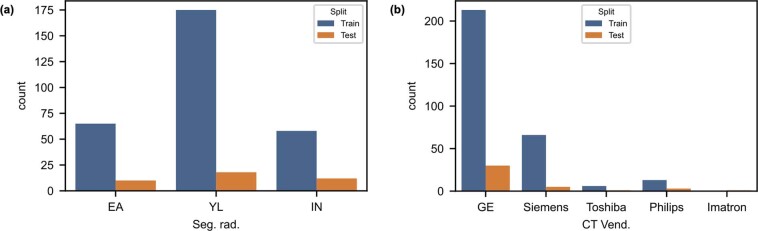
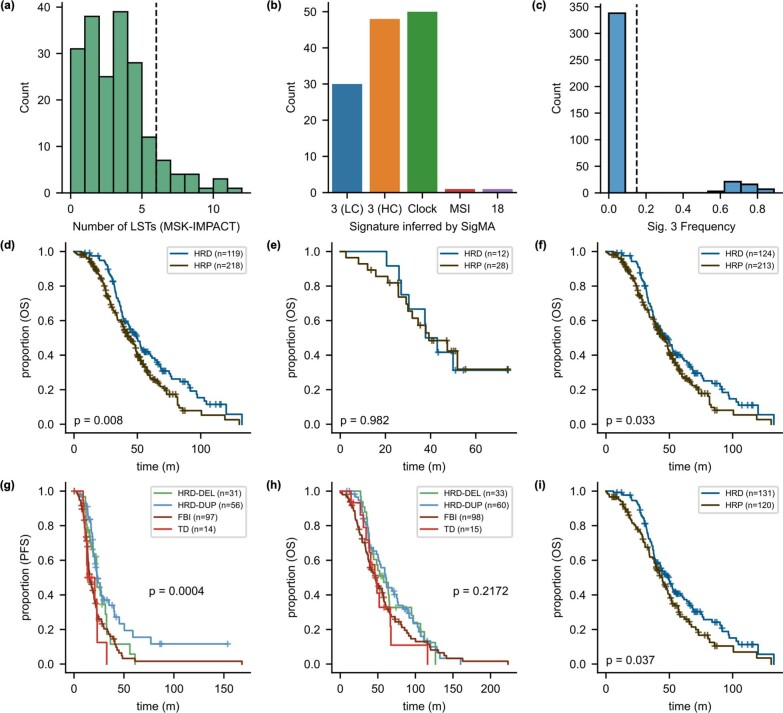
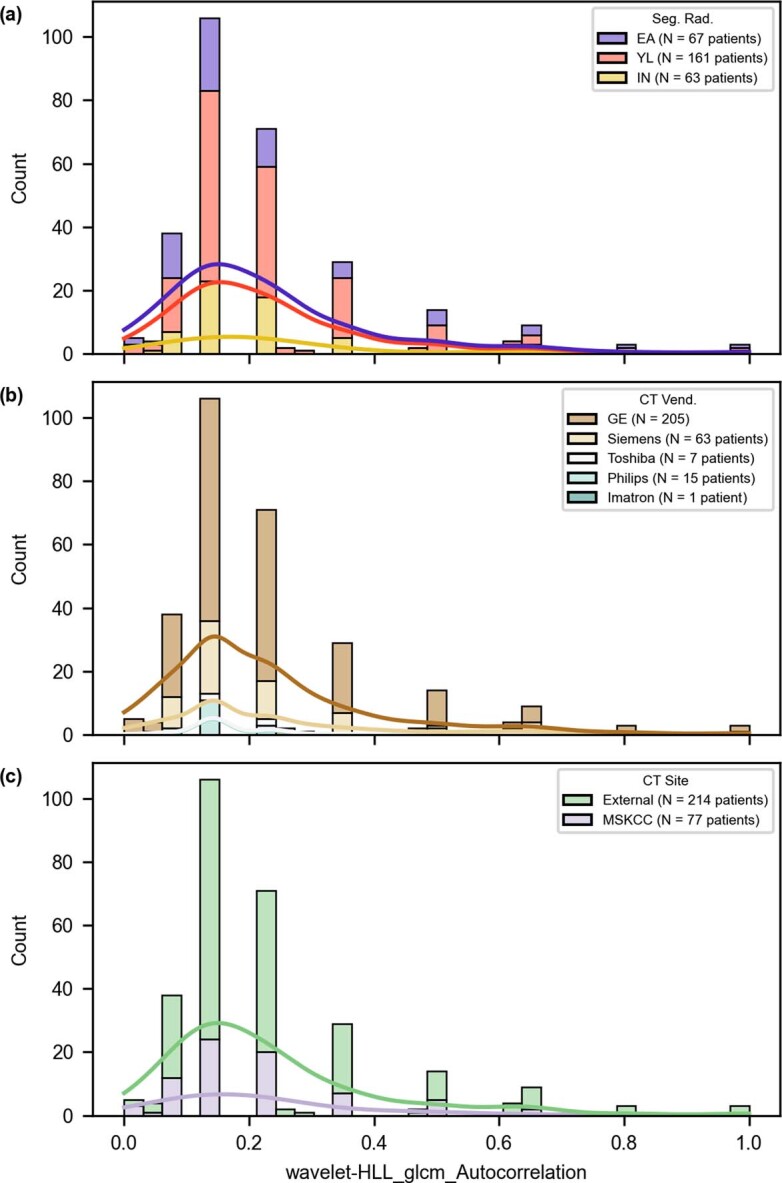
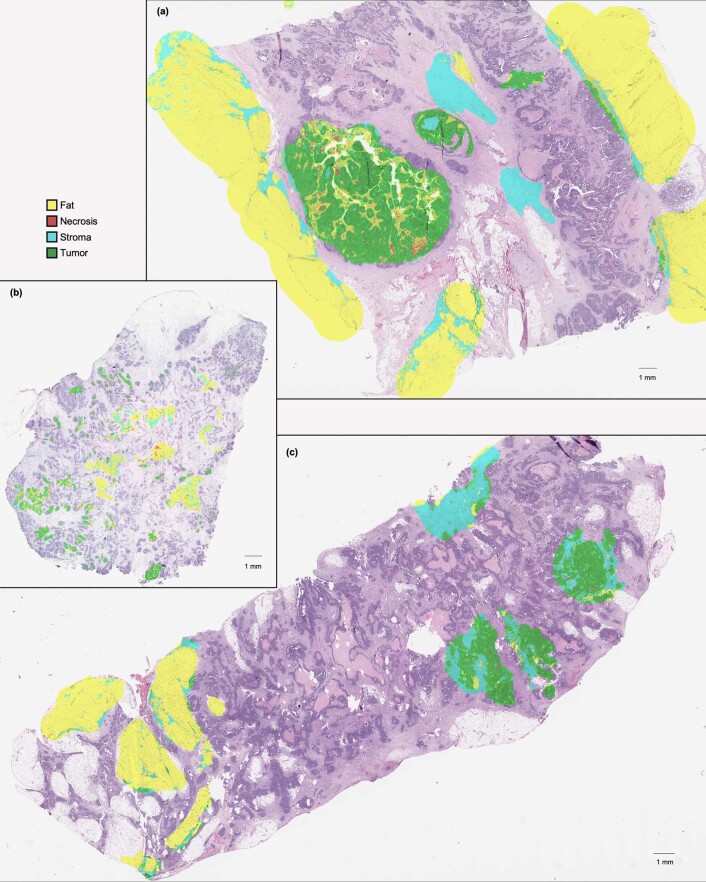
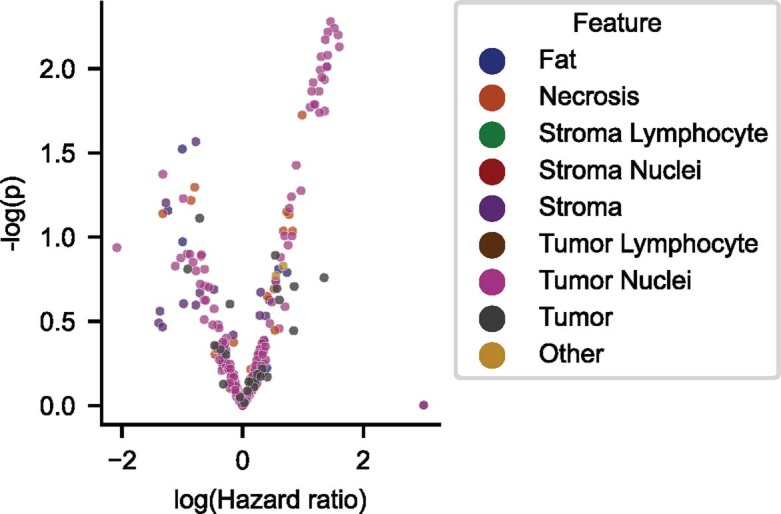
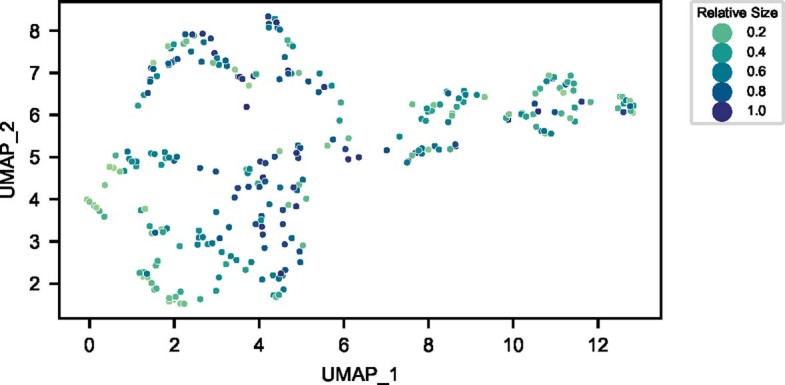
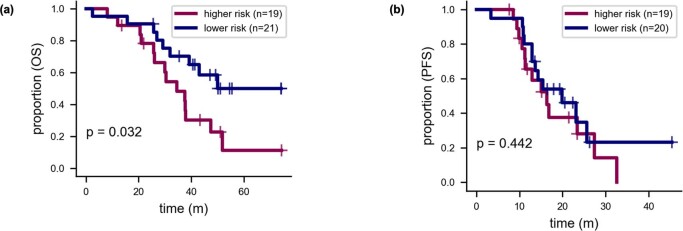
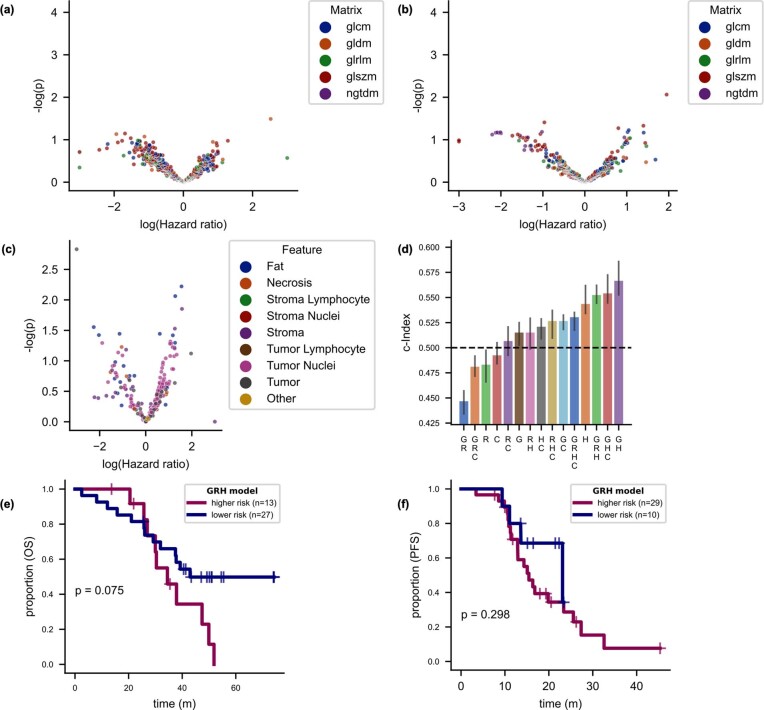
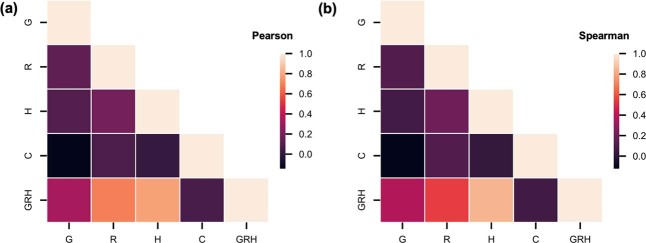
Patients with high-grade serous ovarian cancer suffer poor prognosis and variable response to treatment. Known prognostic factors for this disease include homologous recombination deficiency status, age, pathological stage and residual disease status after debulking surgery. Recent work has highlighted important prognostic information captured in computed tomography and histopathological specimens, which can be exploited through machine learning. However, little is known about the capacity of combining features from these disparate sources to improve prediction of treatment response. Here, we assembled a multimodal dataset of 444 patients with primarily late-stage high-grade serous ovarian cancer and discovered quantitative features, such as tumor nuclear size on staining with hematoxylin and eosin and omental texture on contrast-enhanced computed tomography, associated with prognosis. We found that these features contributed complementary prognostic information relative to one another and clinicogenomic features. By fusing histopathological, radiologic and clinicogenomic machine-learning models, we demonstrate a promising path toward improved risk stratification of patients with cancer through multimodal data integration.


Conflict of interest statement

S.P.S. is a shareholder and consultant to Imagia Canexia Health Inc. Y.L is a shareholder of Y-mAbs Therapeutics Inc. and a consultant to Calyx. J.S.R.-F. reports receiving personal/consultancy fees from Goldman Sachs, REPARE Therapeutics, Paige.AI and Eli Lilly, membership of the scientific advisory boards of VolitionRx, REPARE Therapeutics and Paige.AI, membership of the Board of Directors of Grupo Oncoclinicas and ad hoc membership of the scientific advisory boards of Roche Tissue Diagnostics, Ventana Medical Systems, Novartis, Genentech and InVicro. J.S.R.-F. owns Paige.AI stock options. The other authors declare no competing interests.

Figures

Fig. 1
Fig. 1. Schematic outline of the study.
ad, Multiple data modalities were acquired through routine diagnostics to inform clinical decision making (a): pre-treatment CE-CT scans of the abdomen and pelvis (b), pre-treatment H&E-stained diagnostic biopsies (c) and HRD status inferred from hybridization capture-based targeted sequencing or clinical HRD-DDR gene panels (d). e, Integrated multimodal analyses by late fusion to stratify patients by overall survival. Created with BioRender.com. GLSZM-SAE, gray level size zone matrix small area emphasis; GLRLM-GLV, gray level run length matrix gray level variance; Var, variance; Nuc, nuclear; NGS, next-generation sequencing; LSTs, large-scale state transitions; NtAI, number of subchromosomal regions with allelic imbalance extending to the telomere; LOH, loss of heterozygosity. Source data
Fig. 2
Fig. 2. Overview of cohorts and data types acquired.
a, Venn diagram of patients in the training cohort with available clinical imaging and inferred HRD status. b, Inferred subtypes, sequencing modality, dataset of origin, genes with five or more variants and signature 3 status of each patient. Gray represents sequenced genes without the aberrations shown and white represents an unsequenced gene. c, Kaplan–Meier analysis on OS stratified by HRD status (n = 377 patients). P values were calculated using the log-rank test. Sig., mutational signature; SNV, single-nucleotide variation; Amp., copy number amplification; WES, whole-exome sequencing. Source data
Fig. 3
Fig. 3. High-autocorrelation omental implants are associated with shorter OS.
a, Segmented omental lesion (red) on CE-CT. b, The log HR is depicted for each radiomic feature derived from omental implants (n = 600 features). Features above the line were statistically significant by Cox regression after multiple testing correction of interquartile range-filtered features. c, Adnexal radiomic features (n = 600 features) were not significant by Cox regression after correction of interquartile range-filtered features. d, The hazard ratio with 95% CI as estimated by Cox regression is shown for the feature in the final model, the autocorrelation derived from the gray level co-occurrence matrix for the wavelet-filtered image. e, The value of this feature against OS is plotted for patients in the training set (n = 251 patients). f, Training and test concordance indices for the model are shown; the height of each bar shows the c-Index and the lower and upper points of the respective error bars depict the 95% CI by 100-fold leave-one-out bootstrapping. g,h, Two risk groups based on the model’s predicted risk score are shown for the training and test sets. P values were derived using the log-rank test. glcm, gray level co-occurrence matrix; gldm, gray level dependence matrix; glrlm, gray level run length matrix; glszm, gray level size zone matrix; ngtdm, neighboring gray tone difference matrix. Source data
Fig. 4
Fig. 4. Weakly supervised deep learning accurately infers HGSOC tissue type on H&E.
a, Annotated tiles normalized using Macenko’s method chosen at random. The number of tiles for each tissue type is shown. b, Workflow of ResNet-18 model trained using the annotated regions. c, Example of the model’s predictions for an annotated region. d, The confusion matrix aggregated across folds of cross-validation for each of the tissue classes. Source data
Fig. 5
Fig. 5. Interpretable histopathological features stratify HGSOC patients by OS.
a, Tissue map from H&E slides with nuclear detections yielding tissue-type and cell-type features. b, Log HRs of the two chosen histological features (with 95% CI as estimated by Cox regression; fit on n = 243 patients). c, Training and test concordance indices are shown: the height of each bar shows the c-Index and the lower and upper points of the respective error bars depict the 95% CI by 100-fold leave-one-out bootstrapping. d,e, Kaplan–Meier survival analysis and log-rank test statistics for training (d) and test sets (e). f,g, H&E of extreme examples of the model’s inferred mean tumoral nuclear area (scale bar, 50 µm for each image). Source data
Fig. 6
Fig. 6. Multimodal integration improves stratification and identifies clinically significant subgroups.
a, The test c-Indices for integration of combinations of multimodal features is shown: the height of each bar shows the c-Index and the lower and upper points of the respective error bars depict the 95% CI by 100-fold leave-one-out bootstrapping. Asterisks denote 95% confidence of significant ordering of the test set by 1000-fold permutation test. b, Log HRs of imaging without (top) and with (bottom) HRD integration. Two modalities are shown fitted on n = 122 patients (top) and three are shown fitted on n = 114 patients (bottom). c, Kaplan–Meier plot comparing high- and low- risk groups determined by the GRH model on the training set. P value calculated using the log-rank test. d, Kaplan–Meier plot comparing high- and low- risk groups test set. P value calculated using a log-rank test. e, Unique patients at risk of early death are identified by radiological, histopathological and genomic modalities. Only patients in the test set with uncensored outcomes (n = 23 patients) are shown. f, Kendall rank correlation coefficient of the risk quantile across pairs of the individual modalities, indicating low mutual ordering information between individual modalities in the training set. g, Kaplan–Meier plot of GRH model risk groups on PFS in the test set (one patient has unknown PFS.) P value calculated using the log-rank test. h, Distributions of GRH model score of low (blue) and high (green) CRS in the training set (n = 46 patients). Boxes denote interquartile range, with the center depicting the median and the whiskers denoting the entire distribution excluding any outliers. Significance was assessed by a one-sided Mann–Whitney U-test: P = 0.0044; **P < 0.01. perm.; permutation test; G, genomic model; H, histopathological model; R, radiological model; C, clinical model; NET, no evidence of tumor. Source data
Extended Data Fig. 1
Extended Data Fig. 1. Segmenting radiologist and CT vendor in training and test sets.
a, Three fellowship-trained radiologists segmented the training (N = 298 patients) and test cases (N = 40 patients). b, Scanner vendors (same number as in preceding panel). Source data
Extended Data Fig. 2
Extended Data Fig. 2. Genomic features of the training and test sets.
a, Distribution of large-scale state transitions and threshold. b, Signature 3 detections by SigMA with high confidence (HC; N = 48 patients) and low confidence (LC; N = 30 patients), Clock signature (N = 50 patients), Signature 18 (N = 1 patient), and MSI (N = 1 patient). (c) Signature 3 frequencies for all TCGA-OV cases with sequencing from are shown. 338 patients with low Sig. 3 and 47 with high Sig. 3. d,e Kaplan–Meier analyses of patients by genomic subtype in the training and test sets (p-value by log-rank test). f, Incorporating thresholded LST counts as indicators of HRD status did not increase the difference in OS of the HRD and HRP curves (p-value by log-rank test). g, Stratification by PFS using specific mutational subtypes: HRD-Deletion (HRD-DEL), HRD-Duplication (HRD-DUP), Foldback Inversion (FBI), and Tandem Duplications (TD) (p-value by multivariate log-rank test). h, Stratification by OS using the same mutational subtypes (p-value by log-rank test). i, Kaplan–Meier analysis by OS for only patients with explicit evidence of HRD or HRP, excluding presumed HRP (p-value by multivariate log-rank test). Source data
Extended Data Fig. 3
Extended Data Fig. 3. Radiomic feature values by segmenting radiologist, CT scanner, and site.
The radiomic feature chosen for the model by a segmenting radiologist, b CT vendor, and c whether the scan was acquired at our institution (MSKCC) or elsewhere. Source data
Extended Data Fig. 4
Extended Data Fig. 4. Example cross-validation histopathologic tissue-type classifications.
Three samples (a–c) chosen at random from all slides used for cross-validation.
Extended Data Fig. 5
Extended Data Fig. 5. Histopathologic feature discovery.
The logarithm of the univariate hazard ratio is depicted for each histopathologic feature (N = 281 features) before interquartile range-based filtering, with the cluster in the upper right quadrant comprising primarily features describing tumor nuclear diameter and size. Source data
Extended Data Fig. 6
Extended Data Fig. 6. Histopathologic embeddings by specimen size.
UMAP embeddings of the two-feature histopathologic signature (for N = 283 patients), with each slide’s point colorized by the relative specimen size (here, the quantile of the number of foreground tiles detected). Source data
Extended Data Fig. 7
Extended Data Fig. 7. Test performance of histopathologic-radiomic model.
a, Kaplan–Meier analysis of OS for the RH model’s risk scores (p-value by log-rank test). b, Kaplan–Meier analysis of PFS for the RH model’s risk scores (p-value by log-rank test). Source data
Extended Data Fig. 8
Extended Data Fig. 8. Learning only from cases with full information (N = 114) worsens performance.
Log hazard ratios for radiomic features derived from a omental implants (N = 600 features) and b adnexal masses (N = 600 features; uncorrected p-values shown). c, Log hazard ratios for histopathologic features (N = 281 features; uncorrected p-values shown). d, Concordance indices for the test set by overall survival. The height of each bar shows the c-Index, and the lower and upper points of the respective error bars depict the 95% C.I. by leave-one-out bootstrapping. Asterisks denote 95% confidence of significant ordering of the test set by 1000-fold permutation test. e, KM analysis of OS for the GRH model in the test set. P-value calculated using the log-rank test. f, KM analysis of PFS for the GRH model in the test set. P-value calculated using the log-rank test. Source data
Extended Data Fig. 9
Extended Data Fig. 9. No robust association exists between individual modalities in the training set.
a, The maximal magnitude of the Pearson correlation between individual modalities is 0.191. b, The maximal magnitude of the Spearman correlation between individual modalities is 0.192. Source data
Extended Data Fig. 10
Extended Data Fig. 10. Chemotherapy response scores for all models on the test set.
ao, for C, G, GC, GH, GHC, GR, GRC, GRH, GRHC, H, HC, R, RC, RH, and RHC models, respectively. The box of each plot depicts the 25th, 50th, and 75th percentiles, and the whiskers depict the entire range except for outlier points beyond 1.5 times the interquartile range past from the median 50% of data. Significance was assessed by a one-sided Mann-Whitney U test without correction for multiple tests. * denotes p < 0.05, ** denotes p < 0.01, ns denotes p > 0.05. P-value in b is 0.012. Each plot depicts N = 9 patients with CRS 3/NET and N = 12 patients with CRS 1/2. Source data

Comment in

References

    1. National Cancer Institute. Cancer Stat Facts. https://seer.cancer.gov/statfacts/
    1. Moore K, et al. Maintenance olaparib in patients with newly diagnosed advanced ovarian cancer. N. Engl. J. Med. 2018;379:2495–2505. doi: 10.1056/NEJMoa1810858. - DOI - PubMed
    1. Gallagher DJ, et al. Survival in epithelial ovarian cancer: a multivariate analysis incorporating BRCA mutation status and platinum sensitivity. Ann. Oncol. 2011;22:1127–1132. doi: 10.1093/annonc/mdq577. - DOI - PMC - PubMed
    1. Gorodnova TV, et al. High response rates to neoadjuvant platinum-based therapy in ovarian cancer patients carrying germ-line BRCA mutation. Cancer Lett. 2015;369:363–367. doi: 10.1016/j.canlet.2015.08.028. - DOI - PubMed
    1. Zhang AW, et al. Interfaces of malignant and immunologic clonal dynamics in ovarian cancer. Cell. 2018;173:1755–1769. doi: 10.1016/j.cell.2018.03.073. - DOI - PubMed

Publication types