. 2022 Jun 28;23(1):476.
doi: 10.1186/s12864-022-08690-7.

eQTLs are key players in the integration of genomic and transcriptomic data for phenotype prediction

Affiliations

eQTLs are key players in the integration of genomic and transcriptomic data for phenotype prediction

Abdou Rahmane Wade et al. BMC Genomics. .

Abstract

Background: Multi-omics represent a promising link between phenotypes and genome variation. Few studies yet address their integration to understand genetic architecture and improve predictability.

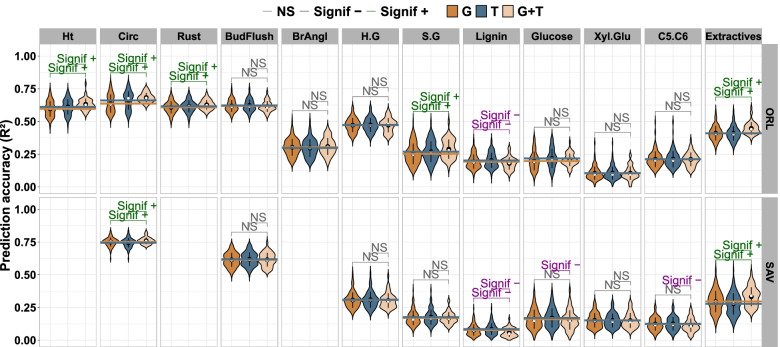
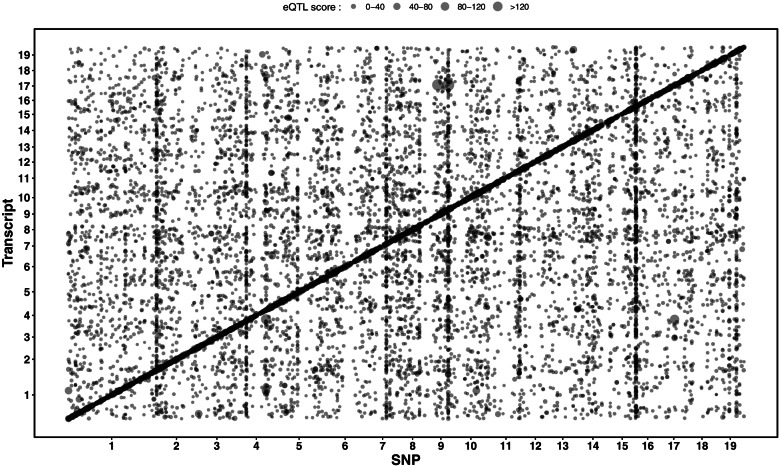
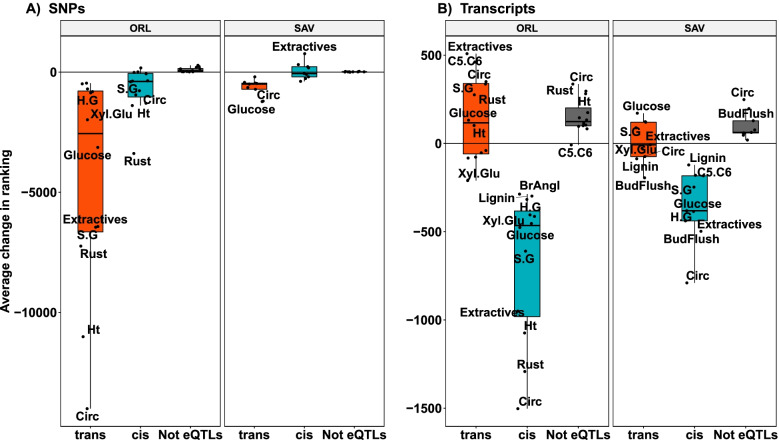
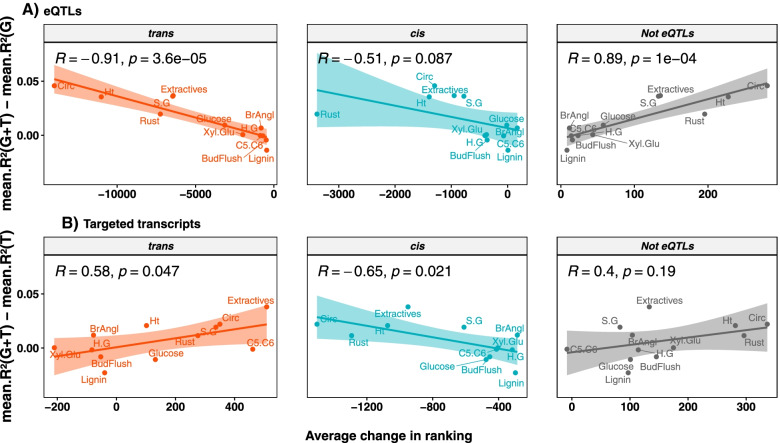
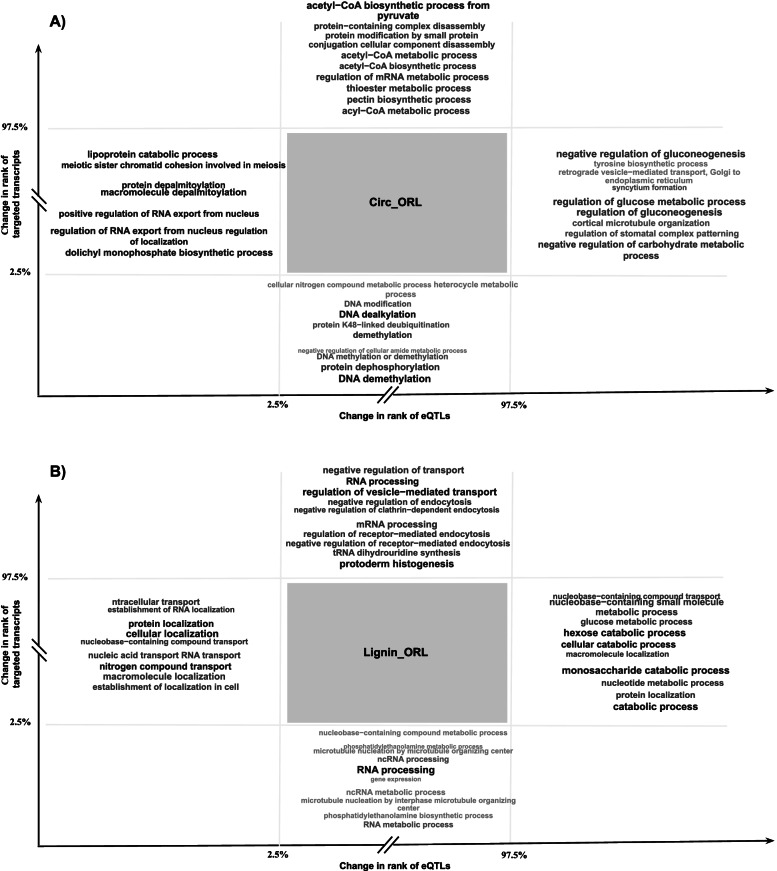
Results: Our study used 241 poplar genotypes, phenotyped in two common gardens, with xylem and cambium RNA sequenced at one site, yielding large phenotypic, genomic (SNP), and transcriptomic datasets. Prediction models for each trait were built separately for SNPs and transcripts, and compared to a third model integrated by concatenation of both omics. The advantage of integration varied across traits and, to understand such differences, an eQTL analysis was performed to characterize the interplay between the genome and transcriptome and classify the predicting features into cis or trans relationships. A strong, significant negative correlation was found between the change in predictability and the change in predictor ranking for trans eQTLs for traits evaluated in the site of transcriptomic sampling.

Conclusions: Consequently, beneficial integration happens when the redundancy of predictors is decreased, likely leaving the stage to other less prominent but complementary predictors. An additional gene ontology (GO) enrichment analysis appeared to corroborate such statistical output. To our knowledge, this is a novel finding delineating a promising method to explore data integration.

Keywords: Genomic Prediction; Multi-omics integration; Omics; Populus nigra; eQTL.


Conflict of interest statement

The authors declare that they have no competing interests.

Figures

Fig. 1
Fig. 1
Prediction accuracies. Violin plots of prediction accuracies (R2) for 21 traits in the poplar dataset according to three models: genotypic data only (G model coloured in dark brown to the left in the panels), transcriptomic data only (T model coloured in dark blue), and concatenating both genotypic and transcriptomic data (G + T model coloured in light brown to the right). Distribution of accuracies resulted from a cross-validation scheme. Significance from paired tests is shown for comparisons between models, with a sign indicating if the accuracy was increased (+) or decreased (-) in the multi-omic model in comparison with the single-omic. Some traits were evaluated at two sites (“ORL” standing for Orleans in France and “SAV” for Savigliano in Italy). The white and black dots show the median and mean of the precision distributions, respectively. The dark brown and dark blue horizontal lines represent the mean of precision distributions of G and T models, respectively
Fig. 2
Fig. 2
eQTL map between SNPs and transcripts. Map of associations (dots) between SNPs (x axis) and transcripts (y axis) through an eQTLs analysis with a multi-locus model. Dot size reflects the association score (-log10 of the p-value of the test) and dot positions correspond to genomic locations of transcripts and SNPs on the 19 chromosomes of the Populus trichocarpa reference genome (v3.0). The darkened diagonal includes all cis mediated associations, while the off-diagonal dots represent the trans associations
Fig. 3
Fig. 3
Distribution of change in predictor rank. Boxplot of the average change in rank of SNPs (panels A) and transcripts (panels B). Each dot represents the average difference per trait, per site of the predictor ranks between the multi-omic model (G + T) and the single-omic models (G for SNPs and T for transcripts). The red and blue boxplots show the distribution of the average rank change for the trans-eQTLs and cis-eQTLs (A) or trans regulated transcripts and cis regulated transcripts (B), respectively. The boxplot in black shows the distribution for the predictors that have not been found to be associated in the eQTL analysis
Fig. 4
Fig. 4
Relationship between change in predictor rank and muti-omic prediction advantage. Regression across traits measured at Orleans between average change in rank of predictors and advantage in performance of the multi-omic model (G + T) over the single-omic counterpart (G for SNPs and T for transcripts). The top panel (A) shows the regression obtained with the eQTLs (trans-eQTLs on the left, cis-eQTLs in the middle, and SNPs not detected as eQTL on the right). The bottom panel (B) shows the regression obtained with the regulated transcripts (trans on the left, cis in the middle, and not found to be associated with eQTLs on the right)
Fig. 5
Fig. 5
Gene ontology (GO) terms enrichment analysis. Schematic representation of the enriched GO terms among the top targeted transcripts or eQTL gene models list for A) the circumference of the tree trunk or B) the lignin content, both evaluated at Orleans. Font size and grey intensity are proportional to -log10(p) of the top 10 GO terms

References

    1. de los Campos G, Hickey JM, Pong-Wong R, Daetwyler HD, Calus MPL. Whole-Genome Regression and Prediction Methods Applied to Plant and Animal Breeding. Genetics. 2013;193(2):327–45. - PMC - PubMed
    1. Varona L, Legarra A, Toro MA, Vitezica ZG. Non-additive Effects in Genomic Selection. Front Genet. 2018;9:78. - PMC - PubMed
    1. Gianola D. Opinionated Views on Genome-Assisted Inference and Prediction During a Pandemic. Front Plant Sci. 2021;12:1533. - PMC - PubMed
    1. Chaudhary K, Poirion OB, Lu L, Garmire LX. Deep Learning-Based Multi-Omics Integration Robustly Predicts Survival in Liver Cancer. Clin Cancer Res. 2018;24:1248–1259. - PMC - PubMed
    1. Pinu FR, Beale DJ, Paten AM, Kouremenos K, Swarup S, Schirra HJ, Wishart D. Systems Biology and Multi-Omics Integration: Viewpoints from the Metabolomics Research Community. Metabolites. 2019;9:76. - PMC - PubMed