. 2022 Jun 28;17(1):249.
doi: 10.1186/s13023-022-02394-7.

Patient-reported outcomes in a Chinese cohort of osteogenesis imperfecta unveil psycho-physical stratifications associated with clinical manifestations

Affiliations

Patient-reported outcomes in a Chinese cohort of osteogenesis imperfecta unveil psycho-physical stratifications associated with clinical manifestations

Peikai Chen et al. Orphanet J Rare Dis. .

Abstract

Background: Osteogenesis imperfecta (OI) is a rare congenital disorder of the skeletal system, inflicting debilitating physical and psychological distress on patients and caregivers. Over the decades, much effort has been channeled towards understanding molecular mechanisms and developing new treatments. It has recently become more apparent that patient-reported outcome measurements (PROM) during treatment, healing and rehabilitation are helpful in facilitating smoother communication, refining intervention strategies and achieving higher quality of life. To date, systematic analyses of PROM in OI patients remain scarce.

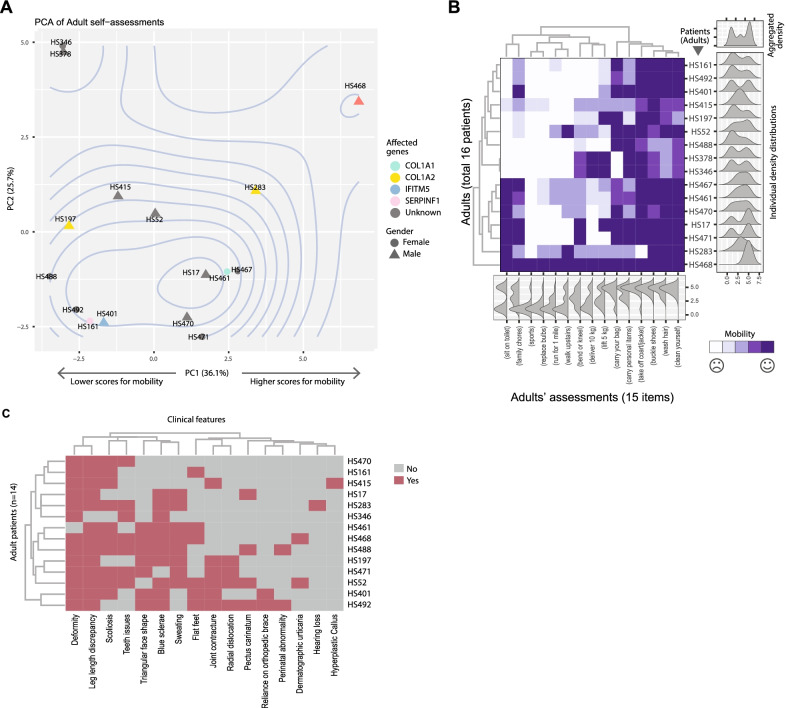
Results: Here, utilizing a PROM Information System, we report a cross-sectional and longitudinal study in a southern Chinese cohort of 90 OI patients, covering both the child and adult age-groups. In the child group where both self and parental surveys were obtained, we identified two clusters of comparable sizes showing different outlooks in physical mobility and emotional experiences. One cluster (Cluster 1) is more negative about themselves than the other (Cluster 2). A concordance of 84.7% between self and parental assessments was recorded, suggesting the stability and validity of PROM-based stratification. Clinical subtyping, deformity, leg length discrepancy, and limited joint mobility were significantly associated with this stratification, with Cluster 1 showing higher percentages of severe phenotypes than Cluster 2. Since OI is a genetic disorder, we performed genetic testing on 72 of the 90 patients, but found no obvious association between genotypes and the PROM stratification. Analyses of longitudinal data suggested that patients tended to stay in the same psychological state, in both clusters. Adult patients also showed a continuous spectrum of self-evaluation that matches their clinical manifestations.

Conclusion: By systematically analyzing patient-reported outcomes, our study demonstrated the link between the sociopsychological wellbeing of OI patients, and their clinical manifestations, which may serve as the basis for evaluating clinical interventions and help achieve better patient-centric medical practices. The lack of genotype-PROM association may be due to the diverse mutational spectrum in OI, which warrants further investigation when a larger sample size is available.

Keywords: Adults; Children; Cross-sectional; Genetic testing; Longitudinal; Osteogenesis imperfecta; PROM; Patient stratification; Psycho-physical; Rare disease.


Conflict of interest statement

The authors declare no competing interests.

Figures

Fig. 1
Fig. 1
Schematic diagram showing the study design and data flow
Fig. 2
Fig. 2
Overview of the current patient cohort. A Pie chart showing the frequency of PROMIS tables provided by the 90 patients. B Pie chart showing the gender distribution. C Pyramid histograms showing the age distribution in the two genders. Solid curves represent fitted kernel density estimations. D Treatment strategies among the 86 patients with records. BP: bisphosphonate. E Self-reported socioeconomic situations of the patients’ families, stratified by the sources of medical expenses, among the 63 patients where such data were available. RMB is the Chinese currency. F Pie chart showing the distributions of affected genes among the 59 patients that underwent genetic screening on a panel of 24 genes for targeted sequencing. G Bar chart showing the distribution of Sillence subtypes among the different genotypes
Fig. 3
Fig. 3
PCA and clustering analyses of child and adolescent PROMIS data. A Venn diagram showing the overlap of self and parental assessment cases. B Piechart showing the percentages of variance explained by principal component analysis (PCA). C A three-dimensional scatter plot showing the projections onto the top three components. Each dot represents one patient. D Scatter plot showing the first two PCs, with density contours. Red curves indicate saddle and valley between the two peaks/clusters. E Bar charts showing the ordered loading scores for the first and second PC. F Heatmap with clustering showing data in their original values. Marginal ridge plots show the marginal densities either per-patient (row-wise) or per PROMIS-item (column-wise), with an aggregated density for all data points placed on the top right corner. The meanings of the colors are explained by the smile or sad face symbols. The PROMIS items are abbreviated by their categories and a representative keyword. Refer to Additional file 1 for corresponding questions in full
Fig. 4
Fig. 4
PCA and clustering analyses of parental PROMIS data. A Scatter plot showing the first two PCs, with density contours. Red curves indicate saddle and valley between the two peaks/clusters. B Bar charts showing the ordered loading scores for the first and second PC. C Heatmap with clustering showing data in their original values. Marginal ridge plots show the marginal densities either per-patient (row-wise) or per PROMIS-item (column-wise), with an aggregated density for all data points placed on the top right corner. The meanings of the colors were explained by the smile or sad face symbols. The PROMIS items are abbreviated by their categories and a representative keyword. Refer to Additional file 1 for corresponding questions in full
Fig. 5
Fig. 5
The identification of two PROMIS groups in child and adolescent patients, and clinical characteristics of the groups. A A Venn diagram showing the identification of two PROMIS groups in the young patients by their own assessments and their parents’ assessments. The numbers correspond to the numbers of patients in each category. The labels C1, C2, P1 and P2 correspond to the Figs. 3D and 4A. The 7 patients with discordance between the patients’ own and their parents’ assessments were considered “ambiguous”. B Pie charts showing the distribution of affected genes in the two groups of patients. C Bar-charts showing the clinical features in decreasing order of significance, in terms of their associations with the PROMIS groups. D Pie charts showing the positive rates for each of the four significantly associated clinical features in the two PROMIS groups. E Scatter plot showing the patients’ heights versus their ages. The straight lines are regression curve fitted for each of the four patient groups. F Scatter plot showing the patients’ spine BMD versus their ages. The straight lines are regression curve fitted for each of the four patient groups. G Violin plots showing the residuals of heights after fitting against age, with respect to the four groups. H Violin plots showing the residuals of BMDs after fitting against age, with respect to the four groups. P values in G, H indicate the F-testing result. I Violin plot showing muscle strengths in the two clusters
Fig. 6
Fig. 6
Projections of later PROMIS outcomes to the PCA of the first PROMIS outcome. A Projections of children and adolescent’s later PROMIS outcomes (second, third or fourth) on the loading scores of the PCA of the first PROMIS outcomes. B Projections of parents’ later PROMIS outcomes (second, third or fourth) on the loading scores of the PCA of the first PROMIS outcomes. Arrows point from the PROMIS outcome at one time-point to the next, for each patient. Arrow colors indicate the original states in the first PROMIS. The transition diagrams at the bottoms of A, B show the numbers of state changes for each pair of successive PROMIS surveys. The numbers on the edges show the numbers of patients or numbers of times a patient changes from one state to another (or the same) state
Fig. 7
Fig. 7
PROMIS outcomes of adult patients. A PCA of adult patients’ PROMIS outcomes. B Heatmap showing the individual assessment outcomes. Ridge plots to the right and bottom are the density estimations that show the row-wise or column-wise distributions. C Heatmap showing the clinical features of the adult patients. The PROMIS items are abbreviated by their categories and a representative keyword. Refer to Additional file 1 for corresponding questions in full

References

    1. Marini JC, Forlino A, Bachinger HP, Bishop NJ, Byers PH, Paepe A, et al. Osteogenesis imperfecta. Nat Rev Dis Primers. 2017;3:17052. doi: 10.1038/nrdp.2017.52. - DOI - PubMed
    1. Lindahl K, Astrom E, Rubin CJ, Grigelioniene G, Malmgren B, Ljunggren O, et al. Genetic epidemiology, prevalence, and genotype-phenotype correlations in the Swedish population with osteogenesis imperfecta. Eur J Hum Genet. 2015;23(8):1042–1050. doi: 10.1038/ejhg.2015.81. - DOI - PMC - PubMed
    1. Marini JC, Forlino A, Cabral WA, Barnes AM, San Antonio JD, Milgrom S, et al. Consortium for osteogenesis imperfecta mutations in the helical domain of type I collagen: regions rich in lethal mutations align with collagen binding sites for integrins and proteoglycans. Hum Mutat. 2007;28(3):209–221. doi: 10.1002/humu.20429. - DOI - PMC - PubMed
    1. Forlino A, Marini JC. Osteogenesis imperfecta. Lancet. 2016;387(10028):1657–1671. doi: 10.1016/S0140-6736(15)00728-X. - DOI - PMC - PubMed
    1. Zhytnik L, Maasalu K, Reimann E, Prans E, Koks S, Martson A. Mutational analysis of COL1A1 and COL1A2 genes among Estonian osteogenesis imperfecta patients. Hum Genomics. 2017;11(1):19. doi: 10.1186/s40246-017-0115-5. - DOI - PMC - PubMed

Publication types