

Low reliability of DNA methylation across Illumina Infinium platforms in cord blood: implications for replication studies and meta-analyses of prenatal exposures
- PMID: 35765087
- PMCID: PMC9238140
- DOI: 10.1186/s13148-022-01299-3
Low reliability of DNA methylation across Illumina Infinium platforms in cord blood: implications for replication studies and meta-analyses of prenatal exposures
Abstract
Background: There is an increasing interest in the role of epigenetics in epidemiology, but the emerging research field faces several critical biological and technical challenges. In particular, recent studies have shown poor correlation of measured DNA methylation (DNAm) levels within and across Illumina Infinium platforms in various tissues. In this study, we have investigated concordance between 450 k and EPIC Infinium platforms in cord blood. We could not replicate our previous findings on the association of prenatal paracetamol exposure with cord blood DNAm, which prompted an investigation of cross-platform DNAm differences.
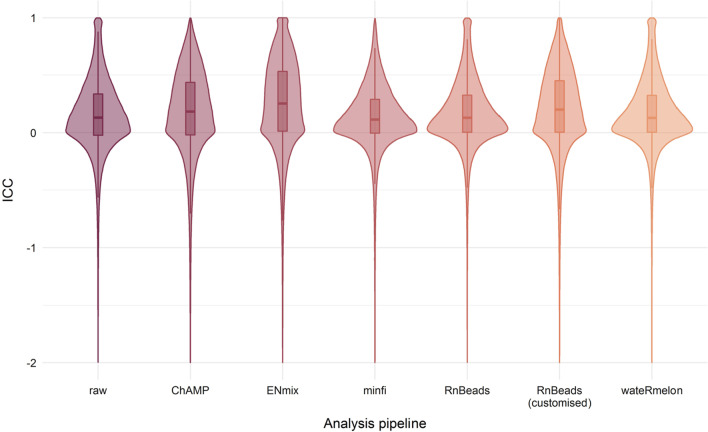
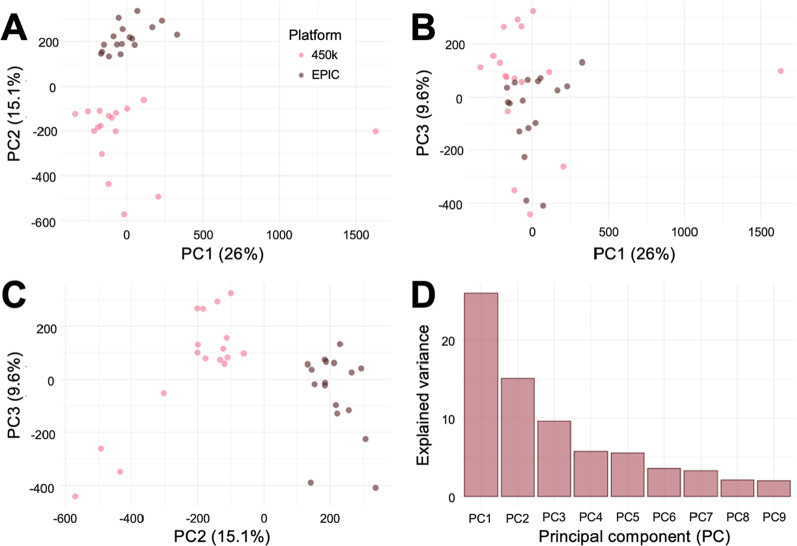
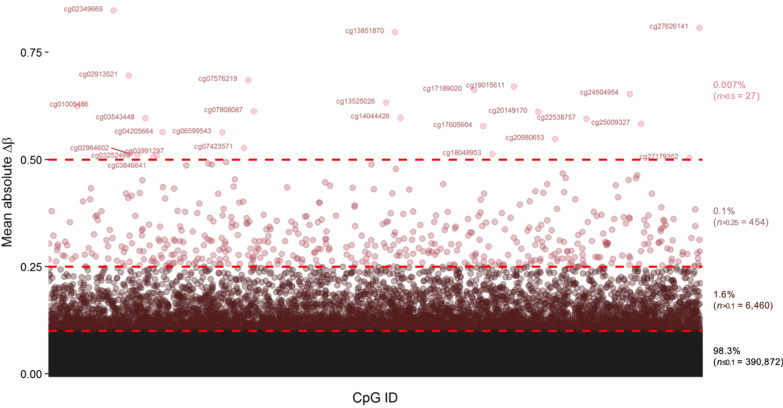
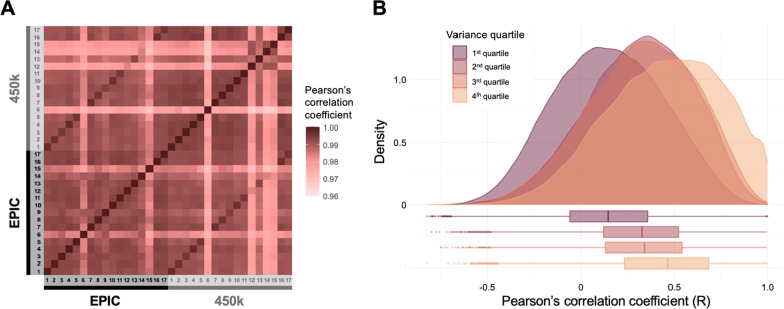
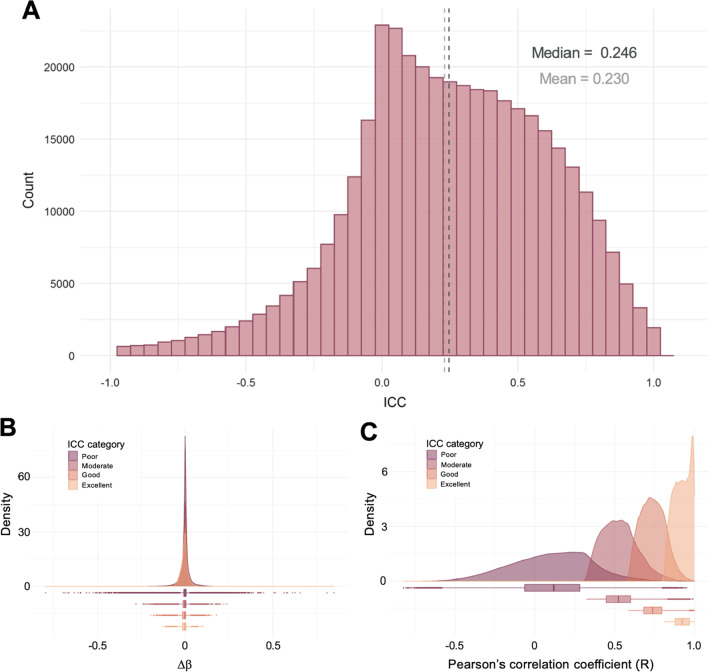
Results: This study is based on two DNAm data sets from cord blood samples selected from the Norwegian Mother, Father and Child Cohort Study (MoBa). DNAm of one data set was measured using the 450 k platform and the other data set was measured using the EPIC platform. Initial analyses of the EPIC data could not replicate any of our previous significant findings in the 450 k data on associations between prenatal paracetamol exposure and cord blood DNAm. A subset of the samples (n = 17) was included in both data sets, which enabled analyses of technical sources potentially contributing to the negative replication. Analyses of these 17 samples with repeated measurements revealed high per-sample correlations ([Formula: see text] 0.99), but low per-CpG correlations ([Formula: see text] ≈ 0.24) between the platforms. 1.7% of the CpGs exhibited a mean DNAm difference across platforms > 0.1. Furthermore, only 26.7% of the CpGs exhibited a moderate or better cross-platform reliability (intra-class correlation coefficient ≥ 0.5).
Conclusion: The observations of low cross-platform probe correlation and reliability corroborate previous reports in other tissues. Our study cannot determine the origin of the differences between platforms. Nevertheless, it emulates the setting in studies using data from multiple Infinium platforms, often analysed several years apart. Therefore, the findings may have important implications for future epigenome-wide association studies (EWASs), in replication, meta-analyses and longitudinal studies. Cognisance and transparency of the challenges related to cross-platform studies may enhance the interpretation, replicability and validity of EWAS results both in cord blood and other tissues, ultimately improving the clinical relevance of epigenetic epidemiology.
Keywords: EWAS; Epigenetic epidemiology; Epigenetics; Illumina Infinium platforms; MBRN; Microarrays; MoBa; Reliability; Replication; Validity.
© 2022. The Author(s).
Conflict of interest statement
The authors declare that they have no competing interests.
Figures
Similar articles
-
Prenatal exposure to phthalates and peripheral blood and buccal epithelial DNA methylation in infants: An epigenome-wide association study.Environ Int. 2022 May;163:107183. doi: 10.1016/j.envint.2022.107183. Epub 2022 Mar 21. Environ Int. 2022. PMID: 35325772
-
Systematic evaluation of DNA methylation age estimation with common preprocessing methods and the Infinium MethylationEPIC BeadChip array.Clin Epigenetics. 2018 Oct 16;10(1):123. doi: 10.1186/s13148-018-0556-2. Clin Epigenetics. 2018. PMID: 30326963 Free PMC article.
-
DNA methylation mediates the effect of maternal smoking on offspring birthweight: a birth cohort study of multi-ethnic US mother-newborn pairs.Clin Epigenetics. 2021 Mar 4;13(1):47. doi: 10.1186/s13148-021-01032-6. Clin Epigenetics. 2021. PMID: 33663600 Free PMC article.
-
Maternal caffeine consumption during pregnancy and offspring cord blood DNA methylation: an epigenome-wide association study meta-analysis.Epigenomics. 2023 Nov;15(22):1179-1193. doi: 10.2217/epi-2023-0263. Epub 2023 Nov 29. Epigenomics. 2023. PMID: 38018434 Free PMC article. Review.
-
What Happens In Utero Does Not Stay In Utero: a Review of Evidence for Prenatal Epigenetic Programming by Per- and Polyfluoroalkyl Substances (PFAS) in Infants, Children, and Adolescents.Curr Environ Health Rep. 2023 Mar;10(1):35-44. doi: 10.1007/s40572-022-00387-z. Epub 2022 Nov 22. Curr Environ Health Rep. 2023. PMID: 36414885 Review.
Cited by
-
Changes in methylation-based aging in women who do and do not develop breast cancer.J Natl Cancer Inst. 2023 Nov 8;115(11):1329-1336. doi: 10.1093/jnci/djad117. J Natl Cancer Inst. 2023. PMID: 37467056 Free PMC article.
-
Accounting for differences between Infinium MethylationEPIC v2 and v1 in DNA methylation-based tools.bioRxiv [Preprint]. 2025 Jun 12:2024.07.02.600461. doi: 10.1101/2024.07.02.600461. bioRxiv. 2025. Update in: Life Sci Alliance. 2025 Jul 8;8(9):e202403155. doi: 10.26508/lsa.202403155. PMID: 39005299 Free PMC article. Updated. Preprint.
-
Associations between blood leukocyte DNA methylation and sustained attention in mid-to-late childhood.Epigenomics. 2023 Oct;15(19):965-981. doi: 10.2217/epi-2023-0169. Epub 2023 Nov 9. Epigenomics. 2023. PMID: 37942546 Free PMC article.
-
Circulating Leukocyte Subsets Before and After a Breast Cancer Diagnosis and Therapy.JAMA Netw Open. 2024 Feb 5;7(2):e2356113. doi: 10.1001/jamanetworkopen.2023.56113. JAMA Netw Open. 2024. PMID: 38358741 Free PMC article.
-
Epigenome-wide association studies of prenatal maternal mental health and infant epigenetic profiles: a systematic review.Transl Psychiatry. 2023 Dec 7;13(1):377. doi: 10.1038/s41398-023-02620-1. Transl Psychiatry. 2023. PMID: 38062042 Free PMC article.
References
-
- Mill J, Heijmans BT. From promises to practical strategies in epigenetic epidemiology. Nat Rev Genet Nat Rev Genet. 2013;14:585–594. - PubMed
-
- Godfrey KM, Lillycrop KA, Burdge GC, Gluckman PD, Hanson MA. Epigenetic mechanisms and the mismatch concept of the developmental origins of health and disease. Pediatr Res. 2007;61:5–10. - PubMed
-
- Hjorth S, Bromley R, Ystrom E, Lupattelli A, Spigset O, Nordeng H. Use and validity of child neurodevelopment outcome measures in studies on prenatal exposure to psychotropic and analgesic medications—a systematic review. PLoS ONE. 2019;14(7):e0219778. doi: 10.1371/journal.pone.0219778. - DOI - PMC - PubMed
MeSH terms
Substances
LinkOut - more resources
Full Text Sources
