Microbial Tracking-2, a metagenomics analysis of bacteria and fungi onboard the International Space Station
- PMID: 35765106
- PMCID: PMC9241228
- DOI: 10.1186/s40168-022-01293-0
Microbial Tracking-2, a metagenomics analysis of bacteria and fungi onboard the International Space Station
Abstract
Background: The International Space Station (ISS) is a unique and complex built environment with the ISS surface microbiome originating from crew and cargo or from life support recirculation in an almost entirely closed system. The Microbial Tracking 1 (MT-1) project was the first ISS environmental surface study to report on the metagenome profiles without using whole-genome amplification. The study surveyed the microbial communities from eight surfaces over a 14-month period. The Microbial Tracking 2 (MT-2) project aimed to continue the work of MT-1, sampling an additional four flights from the same locations, over another 14 months.
Methods: Eight surfaces across the ISS were sampled with sterile wipes and processed upon return to Earth. DNA extracted from the processed samples (and controls) were treated with propidium monoazide (PMA) to detect intact/viable cells or left untreated and to detect the total DNA population (free DNA/compromised cells/intact cells/viable cells). DNA extracted from PMA-treated and untreated samples were analyzed using shotgun metagenomics. Samples were cultured for bacteria and fungi to supplement the above results.
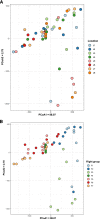
Results: Staphylococcus sp. and Malassezia sp. were the most represented bacterial and fungal species, respectively, on the ISS. Overall, the ISS surface microbiome was dominated by organisms associated with the human skin. Multi-dimensional scaling and differential abundance analysis showed significant temporal changes in the microbial population but no spatial differences. The ISS antimicrobial resistance gene profiles were however more stable over time, with no differences over the 5-year span of the MT-1 and MT-2 studies. Twenty-nine antimicrobial resistance genes were detected across all samples, with macrolide/lincosamide/streptogramin resistance being the most widespread. Metagenomic assembled genomes were reconstructed from the dataset, resulting in 82 MAGs. Functional assessment of the collective MAGs showed a propensity for amino acid utilization over carbohydrate metabolism. Co-occurrence analyses showed strong associations between bacterial and fungal genera. Culture analysis showed the microbial load to be on average 3.0 × 10⁵ cfu/m2 CONCLUSIONS: Utilizing various metagenomics analyses and culture methods, we provided a comprehensive analysis of the ISS surface microbiome, showing microbial burden, bacterial and fungal species prevalence, changes in the microbiome, and resistome over time and space, as well as the functional capabilities and microbial interactions of this unique built microbiome. Data from this study may help to inform policies for future space missions to ensure an ISS surface microbiome that promotes astronaut health and spacecraft integrity. Video Abstract.
Keywords: Built environment; International Space Station; Metagenomics; Microbial monitoring; Microbial tracking; Microbiome.
© 2022. The Author(s).
Conflict of interest statement
The authors declare that they have no competing interests.
Figures


Similar articles
-
Succession and persistence of microbial communities and antimicrobial resistance genes associated with International Space Station environmental surfaces.Microbiome. 2018 Nov 13;6(1):204. doi: 10.1186/s40168-018-0585-2. Microbiome. 2018. PMID: 30424821 Free PMC article.
-
Machine learning algorithm to characterize antimicrobial resistance associated with the International Space Station surface microbiome.Microbiome. 2022 Aug 24;10(1):134. doi: 10.1186/s40168-022-01332-w. Microbiome. 2022. PMID: 35999570 Free PMC article.
-
Characterization of the total and viable bacterial and fungal communities associated with the International Space Station surfaces.Microbiome. 2019 Apr 8;7(1):50. doi: 10.1186/s40168-019-0666-x. Microbiome. 2019. PMID: 30955503 Free PMC article.
-
An Introduction to Whole-Metagenome Shotgun Sequencing Studies.Methods Mol Biol. 2021;2243:107-122. doi: 10.1007/978-1-0716-1103-6_6. Methods Mol Biol. 2021. PMID: 33606255 Review.
-
What Is Metagenomics Teaching Us, and What Is Missed?Annu Rev Microbiol. 2020 Sep 8;74:117-135. doi: 10.1146/annurev-micro-012520-072314. Epub 2020 Jun 30. Annu Rev Microbiol. 2020. PMID: 32603623 Review.
Cited by
-
The Development of a 3D Printer-Inspired, Microgravity-Compatible Sample Preparation Device for Future Use Inside the International Space Station.Micromachines (Basel). 2023 Apr 26;14(5):937. doi: 10.3390/mi14050937. Micromachines (Basel). 2023. PMID: 37241562 Free PMC article.
-
Remove, Refine, Reduce: Cell Death in Biological Systems.Int J Mol Sci. 2023 Apr 10;24(8):7028. doi: 10.3390/ijms24087028. Int J Mol Sci. 2023. PMID: 37108191 Free PMC article.
-
Microbiome in a ground-based analog cabin of China Space Station during a 50-day human occupation.ISME Commun. 2024 Jan 24;4(1):ycae013. doi: 10.1093/ismeco/ycae013. eCollection 2024 Jan. ISME Commun. 2024. PMID: 38495633 Free PMC article.
-
Genomic description of Microbacterium mcarthurae sp. nov., a bacterium collected from the International Space Station that exhibits unique antimicrobial-resistant and virulent phenotype.mSystems. 2025 Jun 17;10(6):e0053725. doi: 10.1128/msystems.00537-25. Epub 2025 May 20. mSystems. 2025. PMID: 40391897 Free PMC article.
-
The International Space Station has a unique and extreme microbial and chemical environment driven by use patterns.Cell. 2025 Apr 3;188(7):2022-2041.e23. doi: 10.1016/j.cell.2025.01.039. Epub 2025 Feb 27. Cell. 2025. PMID: 40020666
References
-
- Sharma A, Richardson M, Cralle L, Stamper CE, Maestre JP, Stearns-Yoder KA, et al. Longitudinal homogenization of the microbiome between both occupants and the built environment in a cohort of United States Air Force Cadets. Microbiome. 2019;7(1):70. doi: 10.1186/s40168-019-0686-6. - DOI - PMC - PubMed
Publication types
MeSH terms
LinkOut - more resources
Full Text Sources

