. 2022 Sep;11(17):e2200568.
doi: 10.1002/adhm.202200568. Epub 2022 Jul 12.

Multiplexed Ultrasound Imaging Using Spectral Analysis on Gas Vesicles

Affiliations

Multiplexed Ultrasound Imaging Using Spectral Analysis on Gas Vesicles

Sangnam Kim et al. Adv Healthc Mater. 2022 Sep.

Abstract

Current advances in ultrasound imaging techniques combined with the next generation contrast agents such as gas vesicles (GV) revolutionize the visualization of biological tissues with spatiotemporal precision. In optics, fluorescent proteins enable understanding of molecular and cellular functions in biological systems due to their multiplexed imaging capability. Here, a panel of GVs is investigated using mid-band fit (MBF) spectral imaging to realize multiplexed ultrasound imaging to uniquely visualize locations of different types of stationary GVs. The MBF spectral imaging technique demonstrates that stationary clustered GVs are efficiently localized and distinguished from unclustered GVs in agarose gel phantom and 3D vessel structures are visualized in ex vivo mouse liver specimens. Mouse macrophages serve as carriers of clustered and unclustered GVs and multiplexing beacons to report cells' spatial locations by emitting distinct spectral signals. 2D MBF spectral images are reconstructed, and pixels in these images are classified depending on MBF values by comparing predetermined filters that predict the existence of cells with clustered and unclustered GVs. This pseudo-coloring scheme clearly distinguishes the locations of two classes of cells like pseudo-color images in fluorescence microscopy.

Keywords: Serratia sp. ATCC 39006; clustered gas vesicles; high frequency ultrasound; mid-band fit spectral imaging; multiplexed ultrasound imaging; pseudo-coloring; ultrasound contrast agents.


Conflict of interest statement

The authors declare no conflict of interest.

Figures

Figure 1
Figure 1
a) An ultrasonic transducer detects different types of scatterers such as clustered GVs, unclustered GVs, and tissue scatterers. b) Frequency spectrum of detected ultrasound echo can be used to define MBF values. Green region indicates ultrasonic transducer's bandwidth. c) Different MBF values can be categorized by their value to define pseudo‐colors for multiplexed imaging. d) Clustered GVs (red, SerratiaGV) and unclustered GVs (blue, AnaGV) are isolated from Serratia sp. ATCC 39006 (Serratia) and Anabaena flos‐aquae (Ana), respectively. SerratiaGVs and AnaGVs emit distinct spectrum under ultrasound excitation by providing basis for multiplexed spectral imaging of stationary GVs. e) Clustered SerratiaGVs and unclustered AnaGVs present distinct MBF signals. Serratia produced SerratiaGV in their cytoplasm and TEM images show isolated and clustered SerratiaGV in red box. Ana produced AnaGV and TEM images show isolated AnaGVs in yellow box. Scale bars: 1 mm.
Figure 2
Figure 2
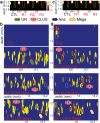
Clustered GVs from Serratia and spectral analysis. a) Phase contrast images (PCI) of clustered GVs (CLUS) and unclustered GVs (UN) from Serratia and GVs from Anabaena flos‐aquae (Ana) and Bacillus megaterium (Mega) show different morphologies. CLUS is large and a flake shape. Salt and pepper patterns indicate unclustered GVs including UN, AnaGV, and MegaGV in nanometer scale. Scale bars: 10 µm. b) TEM images of CLUS, AnaGVs, and MegaGVs show detailed structure of GVs. CLUS forms a large cluster (dashed line) that cannot be dissolved by external flows or centrifugation. Scale bars: 100 µm. c) B‐mode, d) MBF spectral images, and f) slope of control (CTL), UN, CLUS, AnaGV, and MegaGVs scanned by 130 MHz ultrasound. GVs are mixed with 1% agarose gel at the final OD500 of 10. e) Zoom‐in MBF spectral images of black box regions in (d) indicate that CLUS signal is distinct from MBF signals from other GVs. g) Zoom‐in images show the slope of black box regions in (f). Histograms of MBF and slope show distinct values of CLUS (Figures S3, Supporting Information). MBF spectral images of CTL, UN, CLUS, AnaGV, and MegaGVs and the histograms of MBF signals scanned by 50 MHz ultrasound are presented in Figures S6 and S7, Supporting Information.
Figure 3
Figure 3
MBF spectral images of sparsely distributed GVs. MBF spectral images of CTL, UN, CLUS, AnaGV, and MegaGV at OD500 of a) 0.022 and e) 0.088 and zoom‐in images at OD500 of c) 0.022 and g) 0.088 show the location of detected GVs by 130 MHz ultrasound. By using 800 pixels with the highest MBF values in (c,g), the mean and standard deviation of MBF signals from UN, CLUS, AnaGV, and MegaGV were calculated for OD500 of b) 0.022 and f) 0.088. Histograms of MBF pixel values of UN, CLUS, AnaGV, and MegaGV at OD500 of d) 0.022 and h) 0.088 present clear distinction between CLUS and other unclustered GVs. j) The mean and standard deviation of MBF pixel values from CLUS, UN, AnaGV, and MegaGV were measured at OD500 of 0.022, 0.044, and 0.088 (n = 4). CMS values at OD500 of 0.022, 0.044, and 0.088 were first calculated using the mean of CLUS MBF – 2 × standard deviation of CLUS MBF. General CMS values for OD500 of 0.022, 0.044, and 0.088 were defined by taking the mean of CMS at OD500 of 0.022, 0.044, and 0.088. IMS was defined by taking the mean of IMS of UN, AnaGV, and MegaGV similar to CMS. k) MBF images were converted into two‐color multiplexed images to differentiate locations of CLUS and unclustered GVs including UN, AnaGV, and MegaGV. CMS and IMS values defined were used to assign pseudo‐colors to each pixel in MBF 2D images. Pixels with MBF signals over CMS were assigned red color and pixels with MBF signals between CMS and IMS were assigned yellow. Red pixels indicate locations of CLUS and yellow pixels indicate the locations of unlcustered GVs (UN, AnaGV, and MegaGV).
Figure 4
Figure 4
Multiplexed MBF spectral images of mixed GVs We also tested this multiplexed. a,c) CTL is at the first region. CTL is 1% agarose gel phantom without GVs. MBF spectral images show overall distribution of mixed GVs. Regions R1, R2, and R3 were 1% gel phantoms mixed with CLUS at OD500 of 0.022 and UN at OD500 of 0.022, CLUS at OD500 of 0.022 and AnaGV at OD500 of 0.022, and CLUS at OD500 of 0.022 and MegaGV at OD500 of 0.022 (a). Regions R1, R2, and R3 were 1% gel phantoms mixed with CLUS at OD500 of 0.044 and UN at OD500 of 0.044, CLUS at OD500 of 0.044 and AnaGV at OD500 of 0.044, and CLUS at OD500 of 0.044 and MegaGV at OD500 of 0.044 (c). b,d) Multiplexed images of yellow boxes at CTL, R1, R2, and R3. Multiplexed images were reconstructed with pseudo‐color approach. We used predetermined CMS and IMS in Figure 3k. Red pixels indicate the locations of CLUS and yellow pixels indicate the locations of unclustered GVs.
Figure 5
Figure 5
Mouse liver vessel visualization using AnaGV and CLUS. a) B‐mode, b) MBF spectral image, and c) filtered MBF (fMBF) spectral images using pseudo‐color scheme visualize the location of a vessel injected with AnaGVs. Images in (a,b,c) are the 23rd section which is 110 µm away from the front surface (Figure S9c, Supporting Information). d) B‐mode, e) MBF spectral image, and f) filtered MBF (fMBF) spectral images using pseudo‐color scheme visualize the location of a vessel injected with CLUS. Images in (d,e,f) are the 38th section which is 185 µm away from the front surface (Figure S9c, Supporting Information). Red arrows indicate the same vessel containing AnaGV and CLUS.
Figure 6
Figure 6
Multiplexing with micrometer level resolution. a) MBF spectral images of RAW cells (CTL) and RAW cells with UN (UNRAW), CLUS (CLUSRAW), AnaGV (AnaRAW), and MegaGV (MegaRAW). Means and standard deviations of MBF signal from CLUSRAW are distinct from UNRAW, AnaRAW, and MegaRAW, which shows distinct pixel counts in c) the histogram. b) Zoom‐in MBF spectral images of UNRAW, CLUSRAW, AnaRAW, and MegaRAW indicate the distribution of RAW cells with different GVs. d) Basal levels (CTL) of MBF signal of 1% agarose gel phantom, 0.5 million, 0.2 million, and 50 000 RAW cells without GVs imaged by 130 and 50 MHz ultrasound were measured. IMSLong was calculated by mean of CTL MBF + 3 × standard deviation of MBF of CTL to reconstruct multiplexed images. Error bars indicate ± one standard deviation. (n = 12). e) PCI images and f,g) confocal images of UNRAW, CLUSRAW, AnaRAW, and MegaRAW indicate the distribution of GVs in cytoplasm of RAW cells. Bright dots in PCI and GFP in confocal images indicate GVs. CLUS shows stronger and larger signals than other GVs, which confirms the clustered and larger GV size in RAW cells. h) TEM confirms clustering of CLUS in RAW cells (yellow arrows). TEM images of UN, AnaGV, and MegaGV in Figure S11, Supporting Information, show unclustered GV pattern in RAW cells. Scale bars indicate 2 µm. k) CMS for multiplexed imaging was defined by taking the mean of MBF signal from 0.5 million, 0.2 million, and 50 000 CLUSRAW using 2000, 800, and 200 pixels (solid circle, solid square, and solid triangle) by considering the number of cells within the imaging slice. Similarly, IMSshort was defined by the mean of MBF signals (arrow heads and red dashed lines) from m) UNRAW, p) AnaRAW, and s) MegaRAW. Error bars indicate ± one standard deviation. (n = 4 or 6). t) MBF images were converted into two‐color multiplexed images to differentiate locations of CLUSRAW versus UNRAW, AnaRAW, and MegaRAW. We used CMS and IMS values in Figure 7. MBF spectral images of CTL, UNRAW, CLUSRAW, AnaRAW, and MegaRAW and the histogram of MBF signals scanned by 50 MHz ultrasound are presented in Figure S12, Supporting Information. MBF spectral images of CTL, UNRAW, CLUSRAW, AnaRAW, and MegaRAW and the histogram of MBF signals scanned by 50 MHz ultrasound are presented in Figure S12, Supporting Information.
Figure 7
Figure 7
Multiplexed MBF spectral images of mixed RAW cells. a) An MBF spectral image of a mixture of CLUSRAW and UNRAW (CLUS + UNRAW) at R1, CLUSRAW and AnaRAW (CLUS + AnaRAW) at R2, and CLUSRAW and MegaRAW (CLUS + MegaRAW) at R3, and CTL was obtained. b–e) Zoom‐in MBF images of yellow box regions in (a) are at the first column. After CMS and IMSshort were applied to MBF images, multiplexed images at the second column show the locations of CLUSRAW, UNRAW, AnaRAW, and MegaRAW. CMS and IMSshort are defined in Figure 6. e–g) Histograms compare the number of pixels of MBF signals from CTL and CLUS + UNRAW, CLUS + AnaRAW, and CLUS + MegaRAW. Red vertical lines indicate CMS value. Blue solid and dashed lines indicate IMSshort and IMSLong values. Multiplexed images obtained with CMS and IMSLong are in Figure S13, Supporting Information. Red pixels indicate the locations of CLUSRAW and yellow pixels indicate the locations of UNRAW, AnaRAW, and MegaRAW. MBF spectral images of CTL, CLUS + UNRAW, CLUS + AnaRAW, and CLUS + MegaRAW scanned by 50 MHz ultrasound are presented in Figure S14, Supporting Information.

Similar articles

Cited by

References

    1. a) Lizzi F. L., Astor M., Feleppa E. J., Shao M., Kalisz A., Ultrasound Med. Biol. 1997, 23, 1371; - PubMed
    2. b) Han A., Abuhabsah R., Blue J. P. Jr., Sarwate S., O'Brien W. D. Jr., J. Acoust. Soc. Am. 2011, 130, 4139; - PMC - PubMed
    3. c) Xu G., Fowlkes J. B., Tao C., Liu X., Wang X., Ultrasound Med. Biol. 2015, 41, 1473. - PMC - PubMed
    1. a) Fuentes V. L., Moran C. M., Schober K., McEwan J. D., Brown H., Sutherland G. R., McDicken W. N., Am. J. Vet. Res. 1997, 58, 1055; - PubMed
    2. b) Pawlicki A. D., O'Brien W. D. Jr., Ultrason. Imaging 2013, 35, 162; - PMC - PubMed
    3. c) Boozari B., Potthoff A., Mederacke I., Hahn A., Reising A., Rifai K., Wedemeyer H., Bahr M., Kubicka S., Manns M., Gebel M., J. Ultrasound Med. 2010, 29, 1581; - PubMed
    4. d) Padilla F., Jenson F., Laugier P., Ultrasonics 2006, 44, e57; - PubMed
    5. e) Lizzi F. L., Ostromogilsky M., Feleppa E. J., Rorke M. C., Yaremko M. M., IEEE Trans. Ultrason. Ferroelectr. Freq. Control 1987, 34, 319. - PubMed
    1. Lizzi F. L., Greenebaum M., Feleppa E. J., Elbaum M., Coleman D. J., J. Acoust. Soc. Am. 1983, 73, 1366. - PubMed
    1. a) Muleki‐Seya P., Han A., Andre M. P., Erdman J. W. Jr., O'Brien W. D. Jr., Ultrason. Imaging 2018, 40, 84; - PMC - PubMed
    2. b) Insana M. F., Wagner R. F., Brown D. G., Hall T. J., J. Acoust. Soc. Am. 1990, 87, 179. - PMC - PubMed
    1. Chalfie M., Tu Y., Euskirchen G., Ward W. W., Prasher D. C., Science 1994, 263, 802. - PubMed

Publication types