

Gut dysbacteriosis attenuates resistance to Mycobacterium bovis infection by decreasing cyclooxygenase 2 to inhibit endoplasmic reticulum stress
- PMID: 35766265
- PMCID: PMC9307115
- DOI: 10.1080/22221751.2022.2096486
Gut dysbacteriosis attenuates resistance to Mycobacterium bovis infection by decreasing cyclooxygenase 2 to inhibit endoplasmic reticulum stress
Abstract
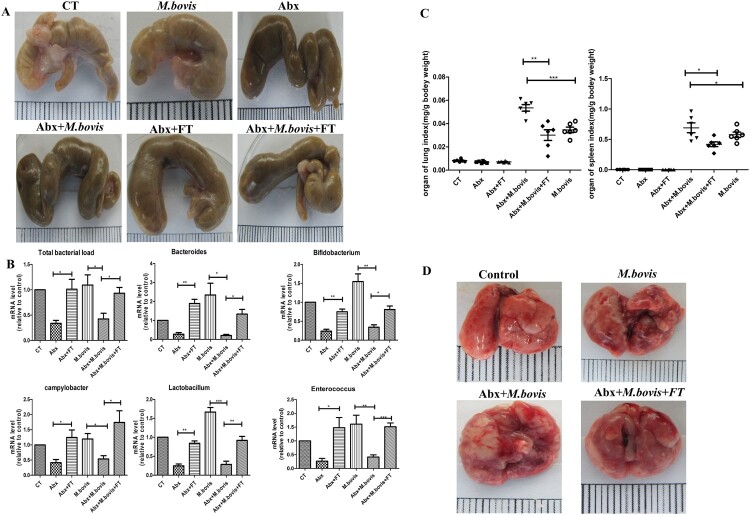
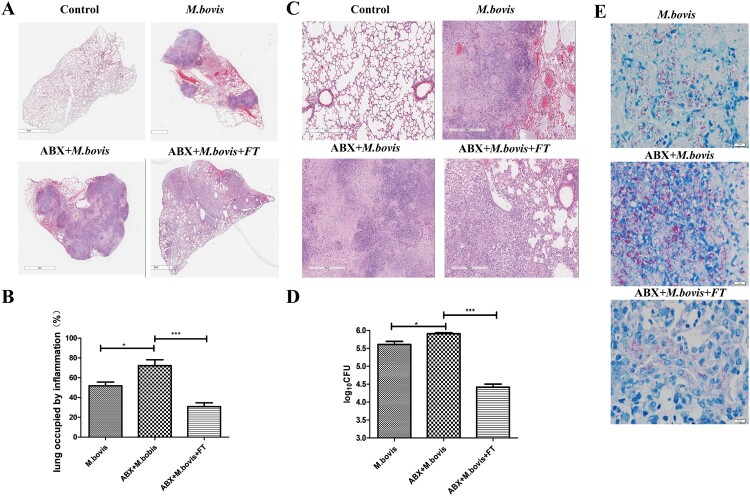
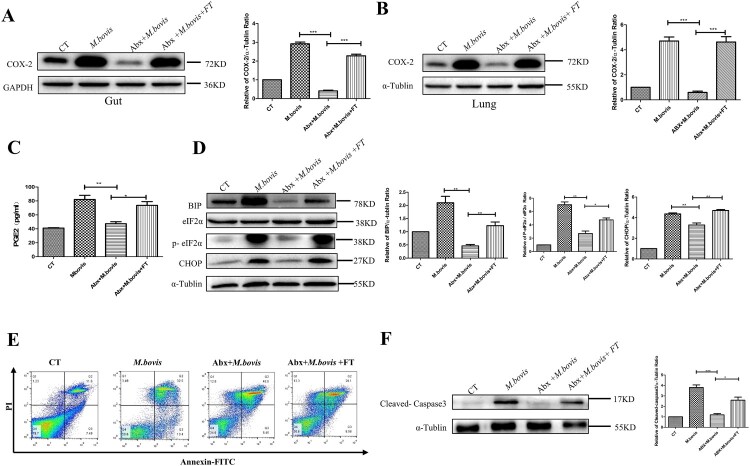
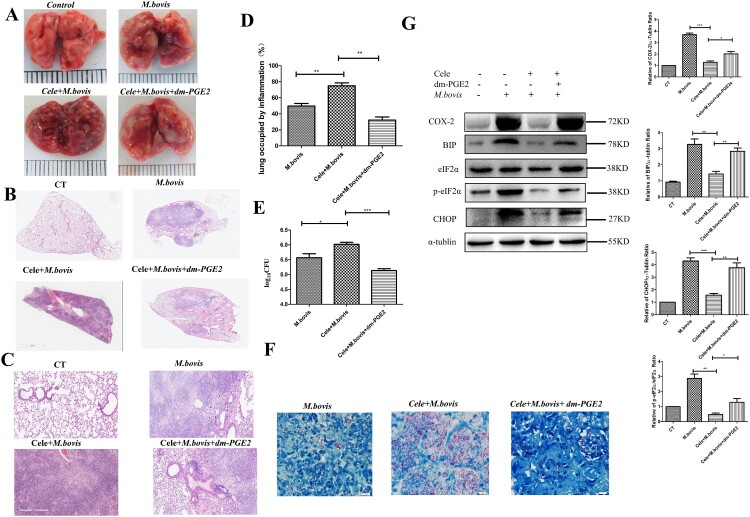
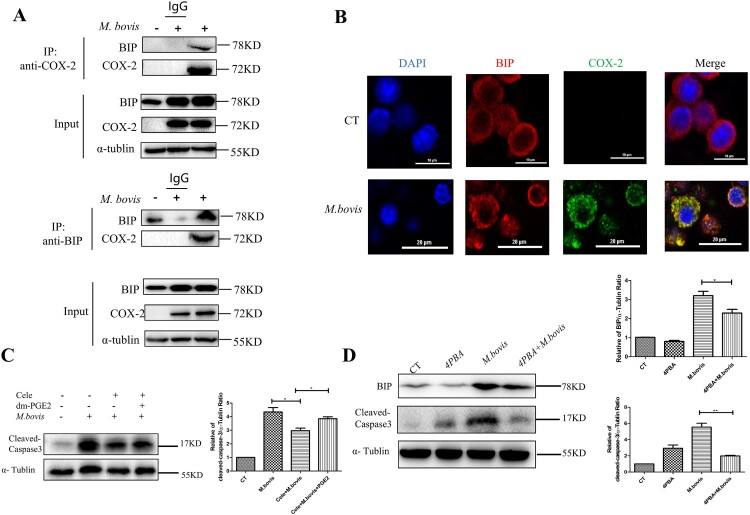
The role of gut microbiota has been described as an important influencer of the immune system. Gut-lung axis is critical in the prevention of mycobacterium infection, but the specific mechanism, by which dysbiosis affects tuberculosis, has not been reported. In this study, we attempted to provide more information on how the gut-lung axis contributes to Mycobacterium bovis (M. bovis) infection. Mice are pre-treated with broad-spectrum antibiotics cocktail (Abx) to induce gut dysbiosis. Interestingly, dysbiosis of microbes showed a significant increase in the bacterial burden in the lungs and inhibited the level of COX-2. After faecal transplantation, cyclooxygenase 2 (COX-2) expression was restored and the inflammatory lesion in the lungs was reduced. Further research found that the deficiency of COX-2 inhibited endoplasmic reticulum stress (ER stress). This mechanism was completed by COX-2 interaction with BIP. Moreover, we found a positive feedback mechanism by which blocking ER stress could reduce COX-2 levels by the NF-κB pathway. Taken together, we reveal for the first time gut dysbacteriosis exacerbates M. bovis disease by limiting the COX-2/ER stress pathway. The finding strengthens the foundation of gut microbiota-targeted therapy for tuberculosis treatment.
Keywords: Gut dysbacteriosis; Mycobacterium bovis; apoptosis; cyclooxygenase 2; endoplasmic reticulum stress; faecal transplant.
Conflict of interest statement
No potential conflict of interest was reported by the author(s).
Figures
Similar articles
-
Mycobacterium bovis Induces Endoplasmic Reticulum Stress Mediated-Apoptosis by Activating IRF3 in a Murine Macrophage Cell Line.Front Cell Infect Microbiol. 2016 Dec 12;6:182. doi: 10.3389/fcimb.2016.00182. eCollection 2016. Front Cell Infect Microbiol. 2016. PMID: 28018864 Free PMC article.
-
Koumiss promotes Mycobacterium bovis infection by disturbing intestinal flora and inhibiting endoplasmic reticulum stress.FASEB J. 2021 Sep;35(9):e21777. doi: 10.1096/fj.202002485RR. FASEB J. 2021. PMID: 34403519
-
LCN2 regulates the gut microbiota and metabolic profile in mice infected with Mycobacterium bovis.mSystems. 2024 Aug 20;9(8):e0050124. doi: 10.1128/msystems.00501-24. Epub 2024 Jul 25. mSystems. 2024. PMID: 39051782 Free PMC article.
-
Mycobacterium tuberculosis, antimicrobials, immunity, and lung-gut microbiota crosstalk: current updates and emerging advances.Ann N Y Acad Sci. 2020 May;1467(1):21-47. doi: 10.1111/nyas.14300. Epub 2020 Jan 28. Ann N Y Acad Sci. 2020. PMID: 31989644 Review.
-
The STING pathway: An uncharacterized angle beneath the gut-retina axis.Exp Eye Res. 2022 Apr;217:108970. doi: 10.1016/j.exer.2022.108970. Epub 2022 Feb 1. Exp Eye Res. 2022. PMID: 35114214 Review.
Cited by
-
The Causal Impact of the Gut Microbiota on Respiratory Tuberculosis Susceptibility.Infect Dis Ther. 2023 Nov;12(11):2535-2544. doi: 10.1007/s40121-023-00880-4. Epub 2023 Oct 10. Infect Dis Ther. 2023. PMID: 37815754 Free PMC article.
-
Comprehensive analysis of endoplasmic reticulum stress-associated genes signature of ulcerative colitis.Front Immunol. 2023 May 23;14:1158648. doi: 10.3389/fimmu.2023.1158648. eCollection 2023. Front Immunol. 2023. PMID: 37287987 Free PMC article.
-
Decreasing of Trimethylamine N-Oxide by Cecal Microbiota and Choline-Trimethylamine Lyase are Associated with Sishen Pill on Diarrhea with Kidney-Yang Deficiency Syndrome.J Inflamm Res. 2024 Oct 13;17:7275-7294. doi: 10.2147/JIR.S470254. eCollection 2024. J Inflamm Res. 2024. PMID: 39429849 Free PMC article.
-
Dysfunction of cecal microbiota and CutC activity in mice mediating diarrhea with kidney-yang deficiency syndrome.Front Microbiol. 2024 Mar 4;15:1354823. doi: 10.3389/fmicb.2024.1354823. eCollection 2024. Front Microbiol. 2024. PMID: 38500584 Free PMC article.
-
Antibodies Targeting the Cell Wall Induce Protection against Virulent Mycobacterium bovis Infection.Microbiol Spectr. 2023 Feb 27;11(2):e0343122. doi: 10.1128/spectrum.03431-22. Online ahead of print. Microbiol Spectr. 2023. PMID: 36847491 Free PMC article.
References
-
- Bennett RM. The political economy of bovine tuberculosis in Great Britain. Rev Sci Technique (International Office of Epizootics). 2017 Apr;36(1):105–114. - PubMed
-
- Budden KF, Gellatly SL, Wood DL, et al. . Emerging pathogenic links between microbiota and the gut-lung axis. Nat Rev Microbiol. 2017 Jan;15(1):55–63. - PubMed
MeSH terms
Substances
LinkOut - more resources
Full Text Sources
Other Literature Sources
Medical
Research Materials