Meta-Analysis
. 2022 Aug 31;10(4):e0001322.
doi: 10.1128/spectrum.00013-22. Epub 2022 Jun 29.

Meta-Analysis of Altered Gut Microbiota Reveals Microbial and Metabolic Biomarkers for Colorectal Cancer

Affiliations
Meta-Analysis

Meta-Analysis of Altered Gut Microbiota Reveals Microbial and Metabolic Biomarkers for Colorectal Cancer

Nagavardhini Avuthu et al. Microbiol Spectr. .

Abstract

Colorectal cancer (CRC) is the second leading cause of cancer mortality worldwide. The dysbiotic gut microbiota and its metabolite secretions play a significant role in CRC development and progression. In this study, we identified microbial and metabolic biomarkers applicable to CRC using a meta-analysis of metagenomic datasets from diverse geographical regions. We used LEfSe, random forest (RF), and co-occurrence network methods to identify microbial biomarkers. Geographic dataset-specific markers were identified and evaluated using area under the ROC curve (AUC) scores and random effect size. Co-occurrence networks analysis showed a reduction in the overall microbial associations and the presence of oral pathogenic microbial clusters in CRC networks. Analysis of predicted metabolites from CRC datasets showed the enrichment of amino acids, cadaverine, and creatine in CRC, which were positively correlated with CRC-associated microbes (Peptostreptococcus stomatis, Gemella morbillorum, Bacteroides fragilis, Parvimonas spp., Fusobacterium nucleatum, Solobacterium moorei, and Clostridium symbiosum), and negatively correlated with control-associated microbes. Conversely, butyrate, nicotinamide, choline, tryptophan, and 2-hydroxybutanoic acid showed positive correlations with control-associated microbes (P < 0.05). Overall, our study identified a set of global CRC biomarkers that are reproducible across geographic regions. We also reported significant differential metabolites and microbe-metabolite interactions associated with CRC. This study provided significant insights for further investigations leading to the development of noninvasive CRC diagnostic tools and therapeutic interventions. IMPORTANCE Several studies showed associations between gut dysbiosis and CRC. Yet, the results are not conclusive due to cohort-specific associations that are influenced by genomic, dietary, and environmental stimuli and associated reproducibility issues with various analysis approaches. Emerging evidence suggests the role of microbial metabolites in modulating host inflammation and DNA damage in CRC. However, the experimental validations have been hindered by cost, resources, and cumbersome technical expertise required for metabolomic investigations. In this study, we performed a meta-analysis of CRC microbiota data from diverse geographical regions using multiple methods to achieve reproducible results. We used a computational approach to predict the metabolomic profiles using existing CRC metagenomic datasets. We identified a reliable set of CRC-specific biomarkers from this analysis, including microbial and metabolite markers. In addition, we revealed significant microbe-metabolite associations through correlation analysis and microbial gene families associated with dysregulated metabolic pathways in CRC, which are essential in understanding the vastly sporadic nature of CRC development and progression.

Keywords: biomarkers; colorectal cancer; gut dysbiosis; meta-analysis; microbial metabolites; microbiome.


Conflict of interest statement

The authors declare no conflict of interest.

Figures

FIG 1
FIG 1
Stacked bar plot shows the mean relative proportions of the top 20 species-level taxa of gut microbial communities in CRC and healthy controls.
FIG 2
FIG 2
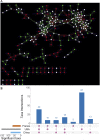
Co-occurrence networks and DyNet dataset-specific markers. (A) DyNet visualization of synchronized CRC and healthy control co-occurrence networks of microbial species from the China dataset. Red nodes and red edges are present only in the CRC network, green nodes and green edges are present only in the control network, and white nodes are present in both. (B) An Upset plot visualization of DyNet dataset-specific markers intersections across France, USA, and China datasets. Each bar represents the number of dataset markers in that category and orange dots below the bar indicates their conservation across the datasets. For instance, the 1st bar shows 40 Dynet dataset-specific markers that are common in all three datasets.
FIG 3
FIG 3
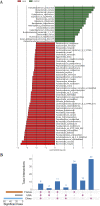
LEfSe analysis. (A) Histograms of differential species in Chinese dataset. CRC enriched species are indicated with a negative LDA score (red), and species enriched in healthy controls are indicated with a positive LDA score (green). Only species with an LDA score >2 at P < 0.05 are shown. (B) An Upset plot visualization of LEfSe dataset-specific markers intersections across the three datasets (France, USA, and China). Each bar represents the number of differential species in that category and orange dots below the bar indicate their conservation across the datasets. For instance, the 1st bar shows eight LEfSe identified differential species that are common in all three datasets.
FIG 4
FIG 4
RF identified microbial markers of CRC in USA, French, and Chinese datasets. (A) In the RF cross-validations, the prediction performance of each species was scored based on internal RF rankings. Rankings of the RF-identified species markers with a rank below 20 in at least one dataset are shown in the figure. (B) An Upset plot visualization of RF dataset-specific markers intersections across the three datasets. Each bar represents the number of dataset-specific markers in that category and the orange dots below the bar indicate their conservation across the datasets. For instance, 1st bar shows the 15 RF dataset-specific markers that are common in all three datasets.
FIG 5
FIG 5
Prediction performance of the RF classifiers. Row indicates the RF classifier trained on the dataset-specific or common method-specific CRC markers; column indicates the classifier applying to the dataset of the corresponding column. In each three by three matrix of AUC values, diagonal values represent the AUC values of cross-validation obtained by using the trained row RF classifier on the column dataset, and off-diagonal values represent the AUC values of cross-cohort validation obtained by applying the trained row RF classifier on corresponding column dataset, (A) RF classifier was built from each dataset-specific markers (row). (B) RF classifier was built from the common markers present in at least two datasets from the USA, France, and China (common method-specific markers). ‘Average AUC score’ row represents the column average of the corresponding three-by-three AUC score matrix. Notation: e.g., DY_USA_sp_USA means classifier trained on the USA data based on the USA-specific markers identified by DyNet method, common_DY_USA means classifier trained on the USA data based on the common markers identified by DyNet method those are present in at least in two datasets DY, DyNet; LF, LEfSe; RF, random forest; and sp, specific.
FIG 6
FIG 6
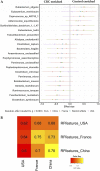
(A) Meta-analysis of selected RF CRC biomarkers markers using MetaPhlAn2 profiles from USA, China, and France geographic regions. The colored lines represent the 95% confidence interval for each dataset and random effect model estimate. (B) Cross-validations of a minimum set of RF CRC biomarkers on USA, France, and China datasets. The AUC values on each cell of the heatmap were obtained by the RF classifier (built from selected RF features) trained on the dataset row and applying the classifier on the dataset column.
FIG 7
FIG 7
Heat maps of the strain-level genomic diversity of F. nucleatum across three geographic regions: USA, China, and France. The significant differential gene families (P < 0.05) were identified using Fisher's exact test on presence and absence gene family profiles.
FIG 8
FIG 8
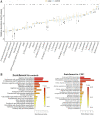
Analysis of MelonnPan predicted metabolites from the USA, China, and France datasets. (A) The relative abundance of significantly different (P < 0.05) metabolites between CRC and healthy control groups. Blue indicates the control samples and red indicates the CRC samples from all three datasets. Enrichment of pathways based on predicted metabolites in (B) healthy controls and (C) CRC samples.
FIG 9
FIG 9
Correlation analysis between 21 CRC microbial markers and 28 metabolites that were significantly different between CRC and healthy gut communities, 14 were enriched in CRC cases and 14 were enriched in healthy controls. Red indicates the positive correlation and blue indicates the negative correlation. *, P ≤ 0.05; **, P ≤ 0.01; ***, P ≤ 0.001.

Similar articles

Cited by

References

    1. Sung H, Ferlay J, Siegel RL, Laversanne M, Soerjomataram I, Jemal A, Bray F. 2021. Global cancer statistics 2020: GLOBOCAN estimates of incidence and mortality worldwide for 36 cancers in 185 countries. CA A Cancer J Clin 71:209–249. doi:10.3322/caac.21660. - DOI - PubMed
    1. Mokarram P, Albokashy M, Zarghooni M, Moosavi MA, Sepehri Z, Chen QM, Hudecki A, Sargazi A, Alizadeh J, Moghadam AR, Hashemi M, Movassagh H, Klonisch T, Owji AA, Łos MJ, Ghavami S. 2017. New frontiers in the treatment of colorectal cancer: autophagy and the unfolded protein response as promising targets. Autophagy 13:781–819. doi:10.1080/15548627.2017.1290751. - DOI - PMC - PubMed
    1. Karahalios A, English DR, Simpson JA. 2015. Weight change and risk of colorectal cancer: a systematic review and meta-analysis. Am J Epidemiol 181:832–845. doi:10.1093/aje/kwu357. - DOI - PubMed
    1. Wu XC, Chen VW, Steele B, Ruiz B, Fulton J, Liu L, Carozza SE, Greenlee R. 2001. Subsite-specific incidence rate and stage of disease in colorectal cancer by race, gender, and age group in the United States, 1992–1997. Cancer 92:2547–2554. doi:10.1002/1097-0142(20011115)92:10<2547::AID-CNCR1606>3.0.CO;2-K. - DOI - PubMed
    1. Boyle T, Keegel T, Bull F, Heyworth J, Fritschi L. 2012. Physical activity and risks of proximal and distal colon cancers: a systematic review and meta-analysis. J Natl Cancer Inst 104:1548–1561. doi:10.1093/jnci/djs354. - DOI - PubMed

Publication types