Stepping up to the Canadian opioid crisis: a longitudinal analysis of the correlation between socioeconomic status and population rates of opioid-related mortality, hospitalization and emergency department visits (2000-2017)
- PMID: 35766912
- PMCID: PMC9388055
- DOI: 10.24095/hpcdp.42.6.01
Stepping up to the Canadian opioid crisis: a longitudinal analysis of the correlation between socioeconomic status and population rates of opioid-related mortality, hospitalization and emergency department visits (2000-2017)
Abstract
Introduction: High levels of income inequality and increased opioid-related harm across Canada bring into question the role of socioeconomic status (SES) in the opioid epidemic. Only a few studies have examined this association, and most of those have analyzed this issue on a provincial level. This study examined the association between opioid-related health outcomes and SES, and investigated rate ratios over time.
Methods: Administrative databases were used to identify opioid-related mortality, hospitalization and emergency department visits between 2000 and 2017. Patient's postal code was linked to the quintile of median household income at the forward sortation area level. Crude rates and age- and sex-adjusted rates in each quintile were calculated, as well as the adjusted rate ratio of average annual rates between the lowest and highest quintiles. The significance of the time trend of rate ratios for all outcomes was examined using linear regression.
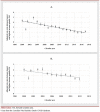
Results: A stepped gradient of opioid-related outcomes across all income quintiles emerged from these data. For mortality, hospitalization and emergency department visits, the average annual rate ratio between lowest quintile and highest quintile was 3.8, 4.3 and 4.9, respectively. These ratios were generally stable and consistent over the study period, albeit the opioid-related mortality SES gap decreased gradually (p < 0.01).
Conclusion: Area income quintile was found to be highly associated with opioid outcomes. Psychosocial factors (stress, unemployment, housing insecurity) that are typically concentrated in low SES areas may play a significant role in the opioid epidemic. Health policies should address these factors in order to provide effective solutions.
Introduction: La présence de grandes inégalités de revenu et l’augmentation des méfaits liés aux opioïdes dans l’ensemble du Canada invitent à se poser la question du rôle du statut socioéconomique (SSE) dans la crise des opioïdes. Seules quelques études ont analysé cette association, et la plupart d’entre elles s’y sont intéressées à l’échelle provinciale. Cette étude porte sur le lien entre les résultats en matière de santé liés aux opioïdes et le SSE et elle mesure les changements au fil du temps des ratios entre divers taux.
Méthodologie: L’équipe de recherche s’est servie de bases de données administratives pour répertorier les décès, les hospitalisations et les visites à l’urgence liés aux opioïdes entre 2000 et 2017. Le code postal des patients a été apparié au quintile du revenu médian des ménages selon la région de tri d’acheminement. L’équipe a calculé les taux bruts et les taux ajustés en fonction de l’âge et du sexe pour chaque quintile, ainsi que le ratio ajusté des taux annuels moyens entre le quintile le plus bas et le quintile le plus élevé. Une régression linéaire a permis d’évaluer la signification statistique de l’évolution des ratios pour tous les résultats.
Résultats: Les données ont révélé un gradient en escalier sur l’ensemble des quintiles de revenu pour les résultats relatifs aux opioïdes. Le ratio des taux annuels moyens entre le quintile le plus bas et le quintile le plus élevé a été de 3,8 pour les décès, de 4,3 pour les hospitalisations et de 4,9 pour les visites à l’urgence. Ces ratios sont demeurés généralement stables et constants tout au long de la période visée par l’étude, et ce, même si l’écart en matière de décès liés aux opioïdes entre les différents SSE a diminué graduellement (p < 0,01).
Conclusion: On observe une corrélation étroite entre le quintile de revenu d’une zone et les résultats relatifs aux opioïdes associés. Il est probable que certains facteurs psychosociaux (stress, chômage, précarité de logement), généralement davantage présents dans les zones à faible SSE, jouent un rôle considérable dans la crise des opioïdes. Les politiques en matière de santé devraient tenir compte de ces facteurs, de façon à proposer des solutions efficaces.
Keywords: analgesics; emergency service; hospital; hospitalization; income; mortality; opiate addiction; opioid; social class; time.
Plain language summary
Socioeconomic status (SES) may be an important factor in determining opioid outcomes. Only a few research studies to date have investigated this relationship. We used administrative databases to examine the associations between SES (measured by area’s income quintile) and opioid mortality, hospitalization and emergency department (ED) visits. We found evidence of a socioeconomic gradient in all opioid-related outcomes. The rate ratio between lowest income and highest income quintiles was approximately 4 for mortality and hospitalizations and approximately 5 for ED visits. The rate ratio between lowest income and highest income quintiles was generally stable and consistent over time. However, the mortality rate ratio showed a decreasing trend.
Conflict of interest statement
The authors declare no conflicts of interest.
Figures


References
-
- Teunis T, Janssen SJ, Ring D, Joint J, et al. An epidemic of the use, misuse and overdose of opioids and deaths due to overdose, in the United States and Canada. Bone Joint J. 2017:856–64. - PubMed
-
- Public Health Agency of Canada. Ottawa(ON): Opioid-and stimulant-related harms in Canada [Internet] Available from: https://health-infobase.canada.ca/substance-related-harms/opioids-stimul...
MeSH terms
Substances
LinkOut - more resources
Full Text Sources
Miscellaneous

