. 2022 Aug 1;221(8):e202103048.
doi: 10.1083/jcb.202103048. Epub 2022 Jun 29.

Cvm1 is a component of multiple vacuolar contact sites required for sphingolipid homeostasis

Affiliations

Cvm1 is a component of multiple vacuolar contact sites required for sphingolipid homeostasis

Daniel D Bisinski et al. J Cell Biol. .

Abstract

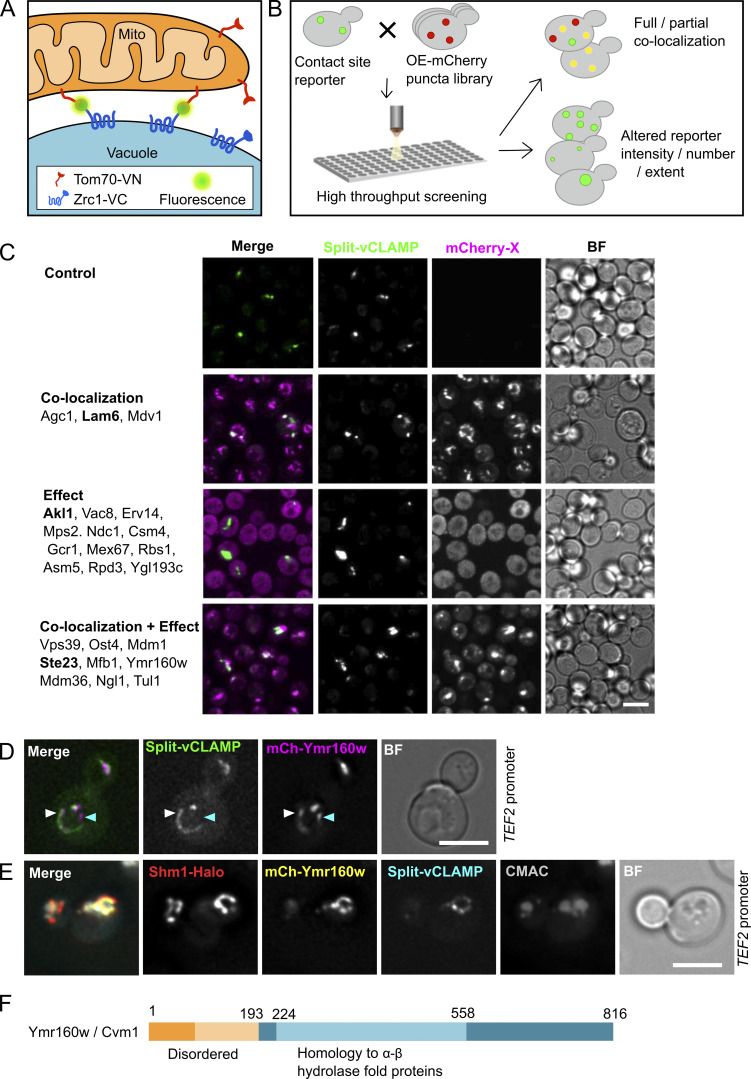
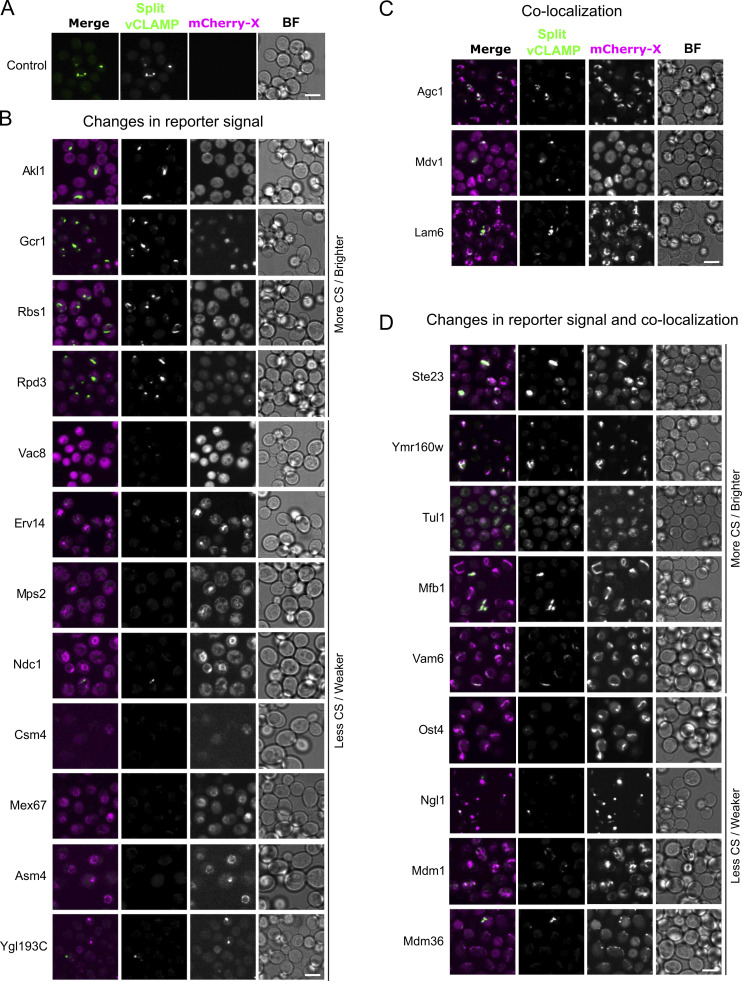
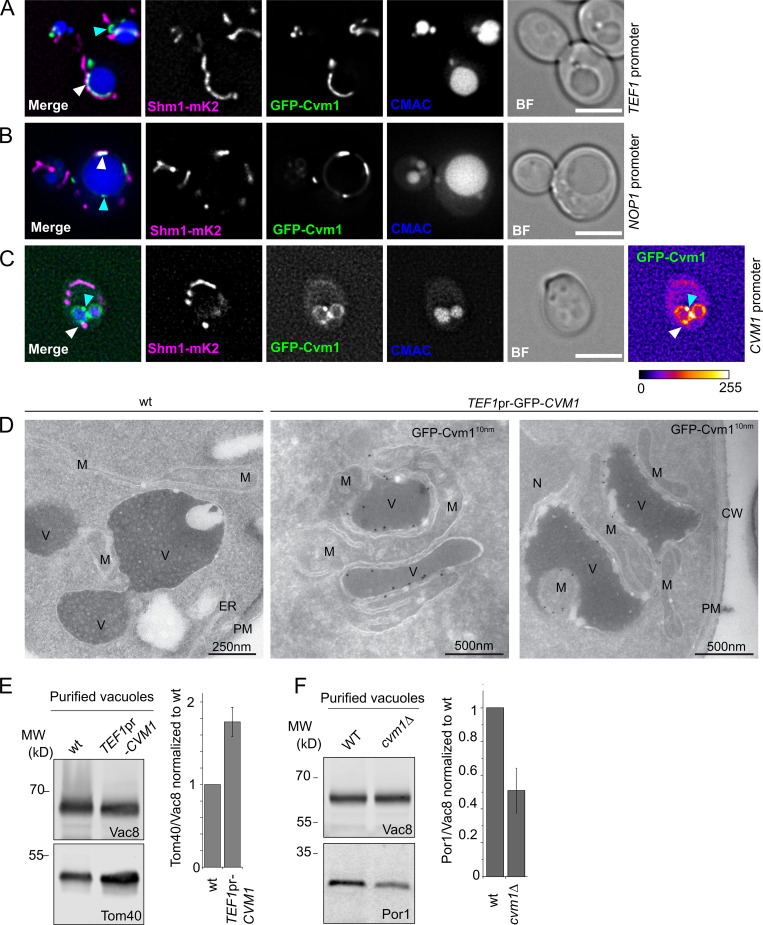
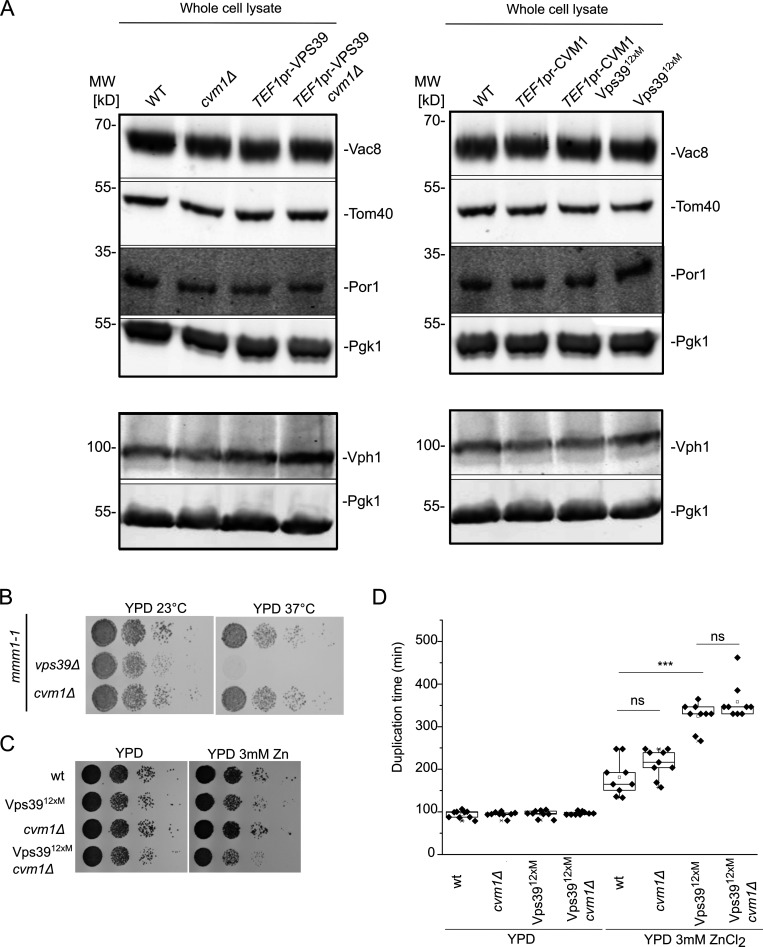
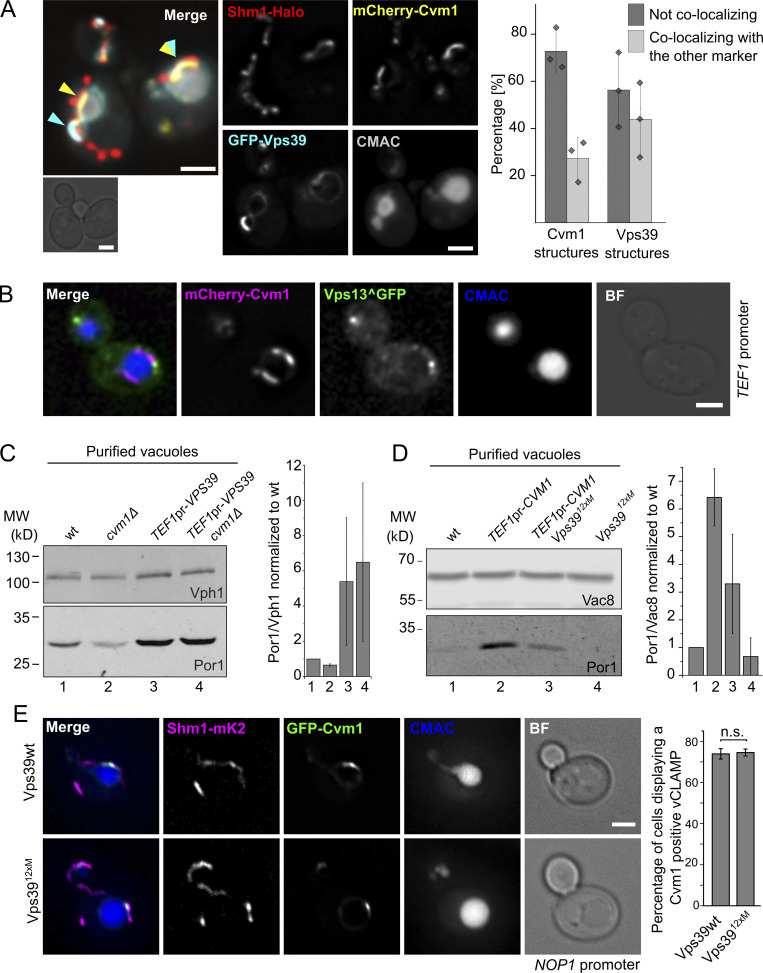
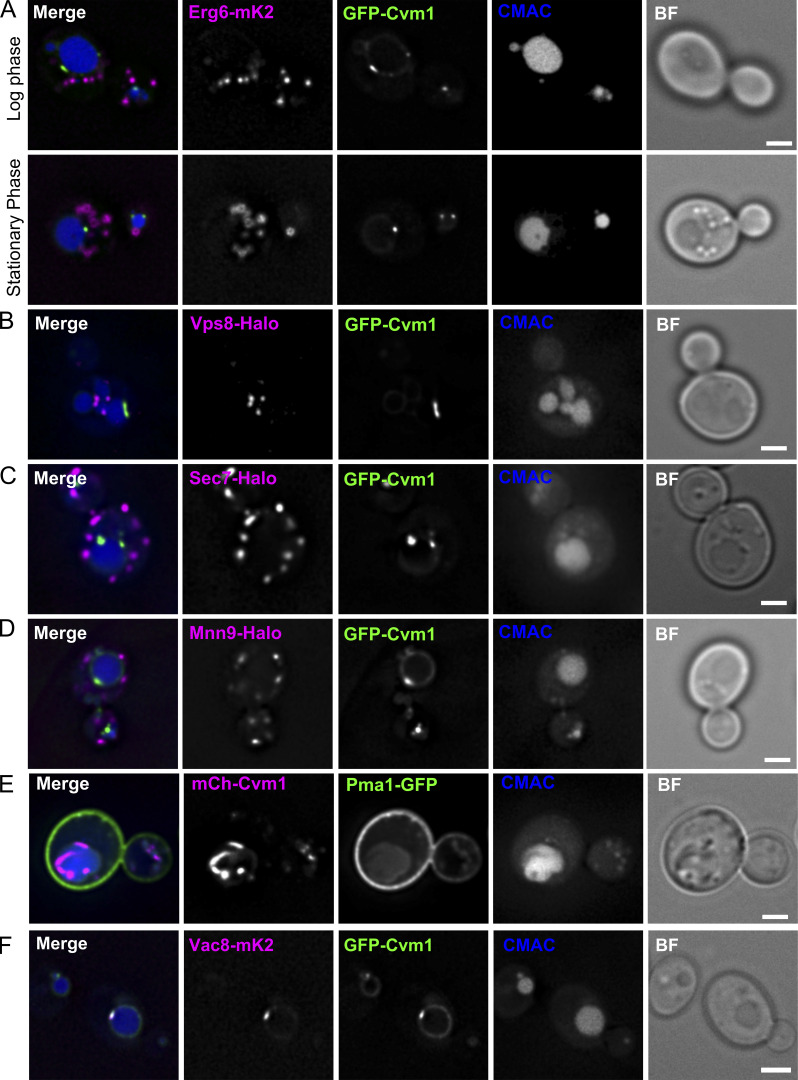
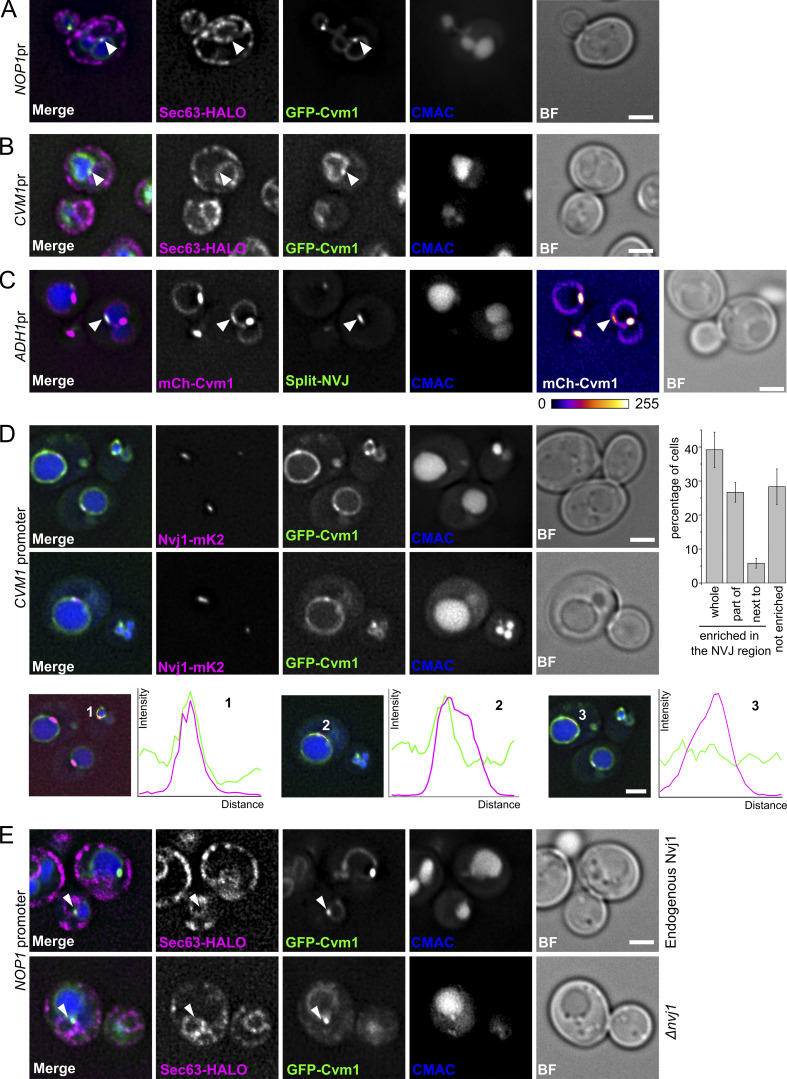
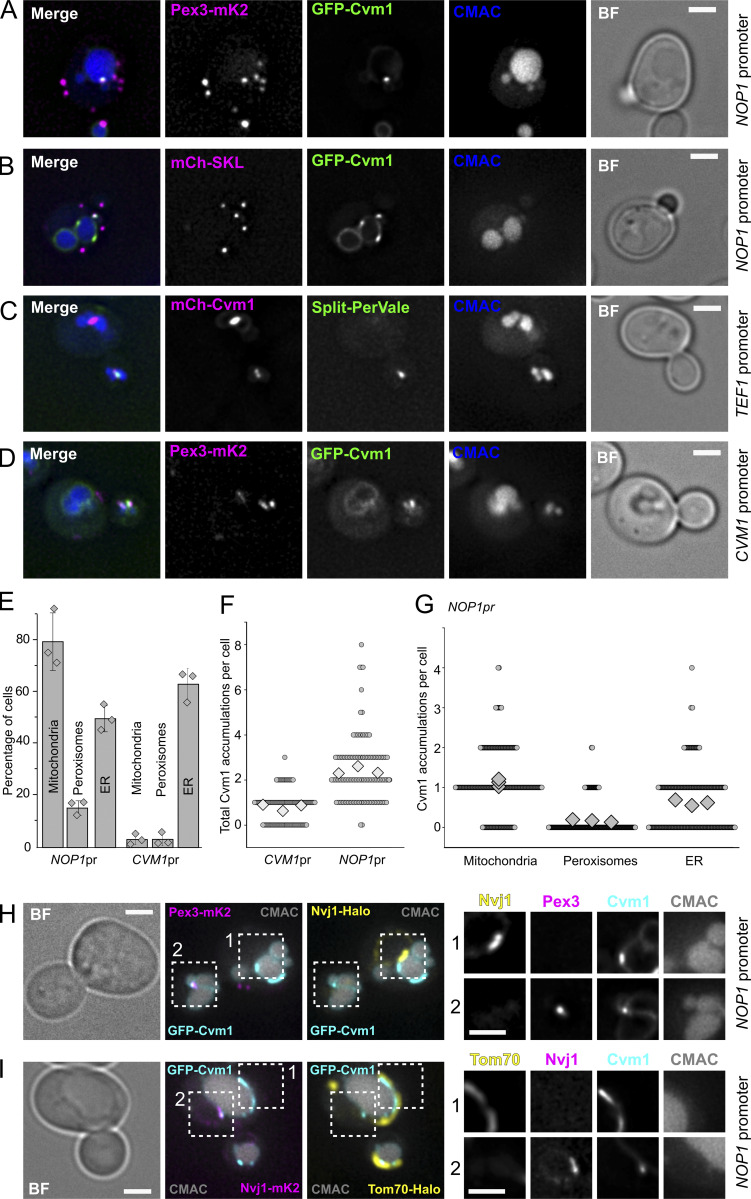
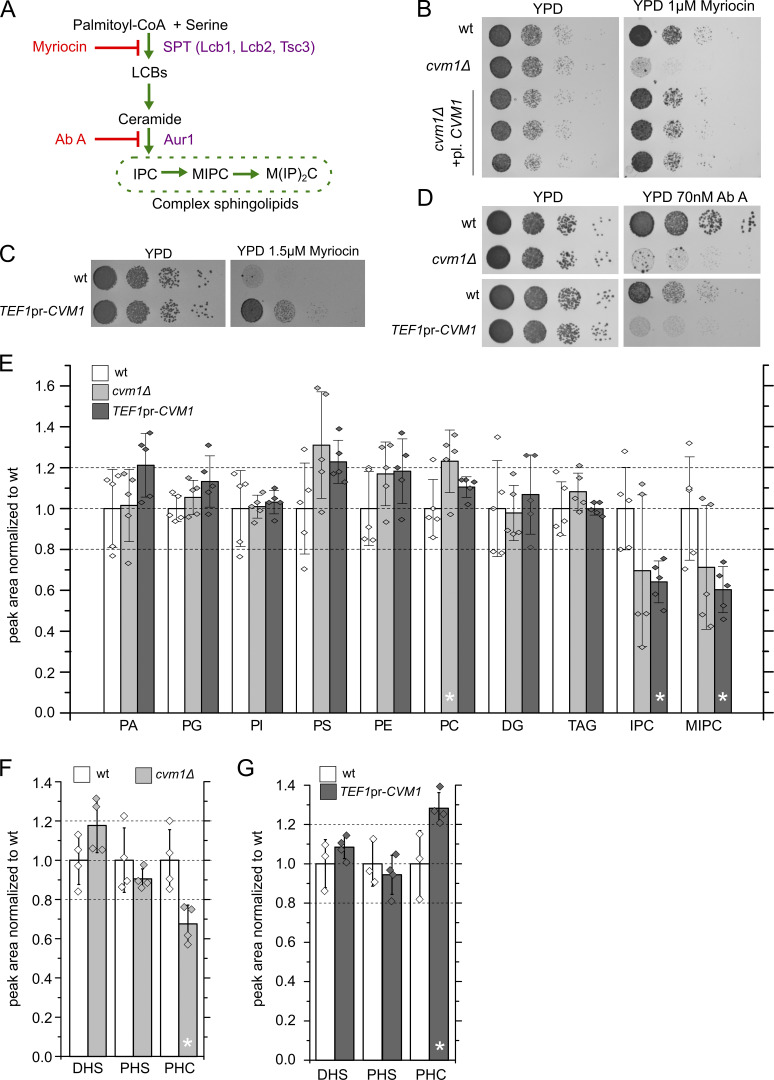
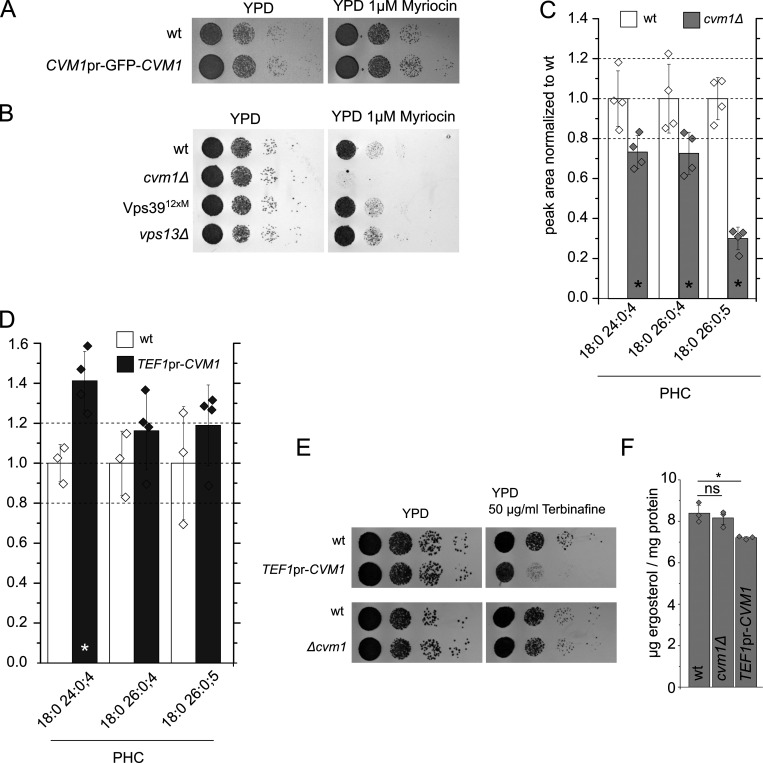
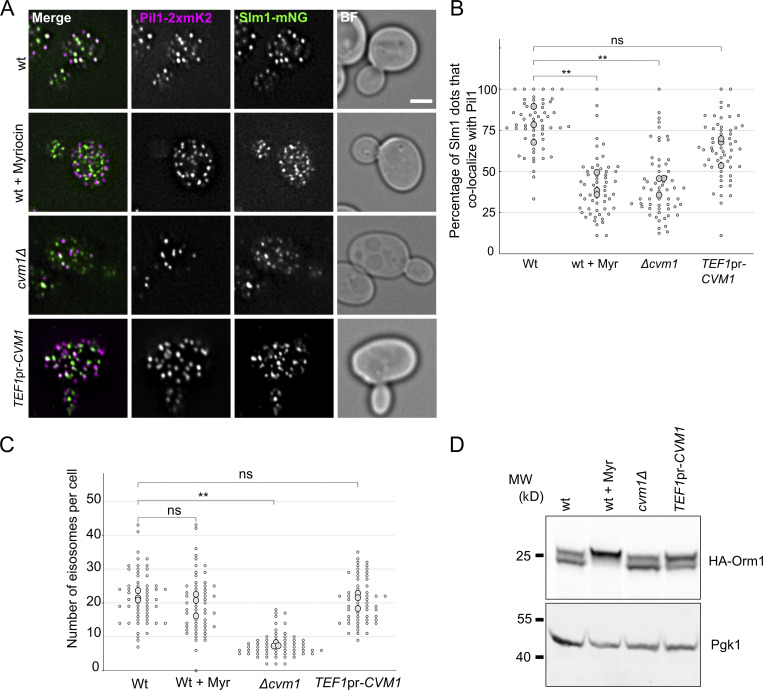
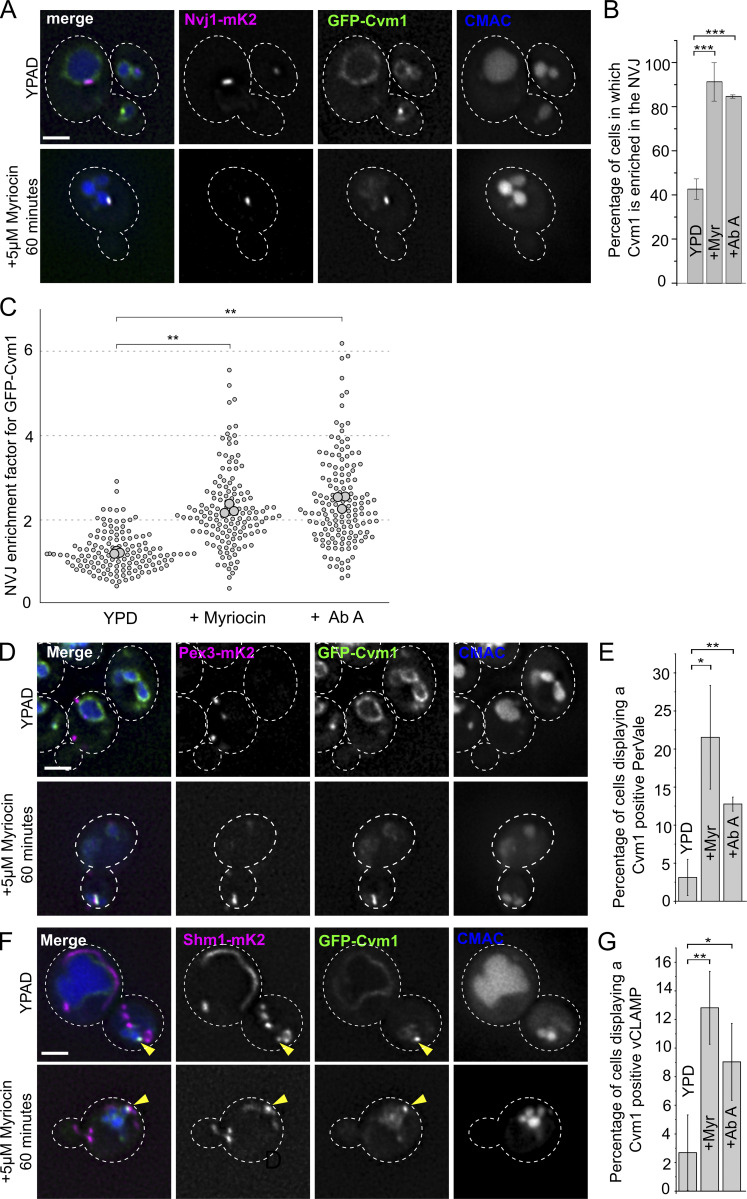
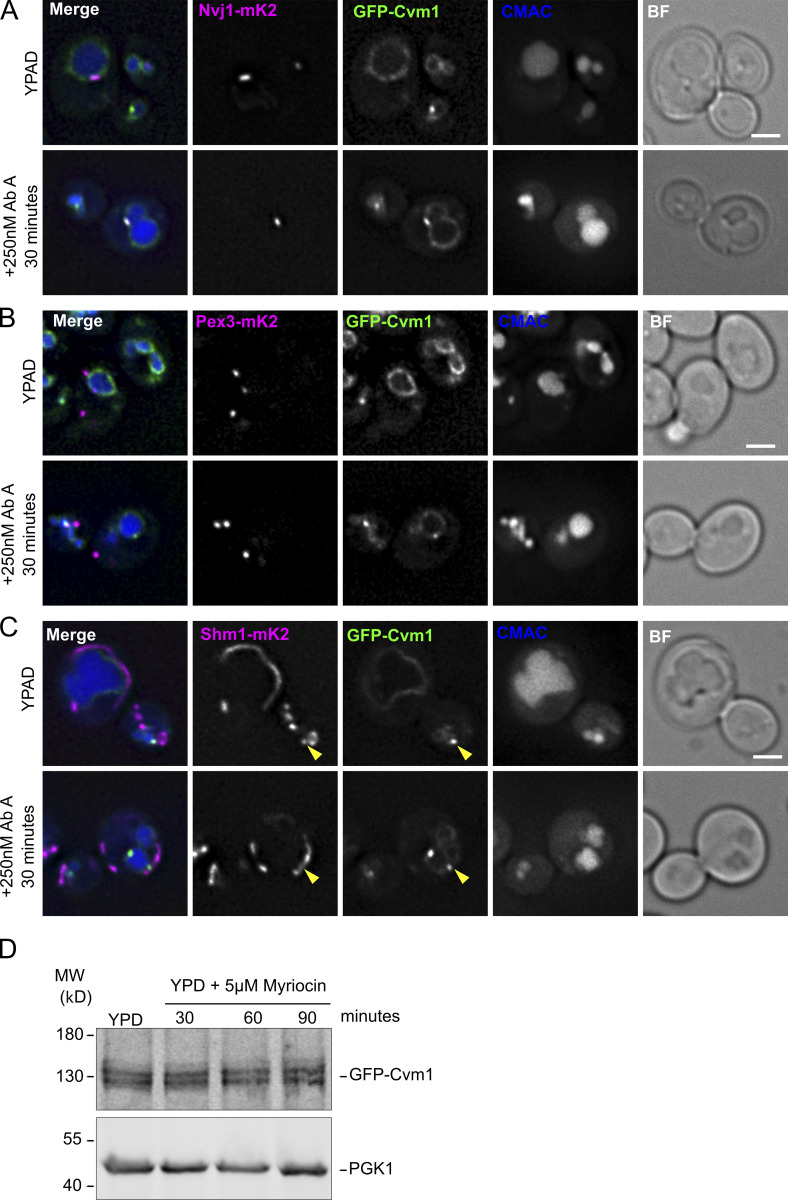
Membrane contact sites are specialized platforms formed between most organelles that enable them to exchange metabolites and influence the dynamics of each other. The yeast vacuole is a degradative organelle equivalent to the lysosome in higher eukaryotes with important roles in ion homeostasis and metabolism. Using a high-content microscopy screen, we identified Ymr160w (Cvm1, for contact of the vacuole membrane 1) as a novel component of three different contact sites of the vacuole: with the nuclear endoplasmic reticulum, the mitochondria, and the peroxisomes. At the vacuole-mitochondria contact site, Cvm1 acts as a tether independently of previously known tethers. We show that changes in Cvm1 levels affect sphingolipid homeostasis, altering the levels of multiple sphingolipid classes and the response of sphingolipid-sensing signaling pathways. Furthermore, the contact sites formed by Cvm1 are induced upon a decrease in sphingolipid levels. Altogether, our work identifies a novel protein that forms multiple contact sites and supports a role of lysosomal contacts in sphingolipid homeostasis.


Figures

Figure 1.
Figure 1.
A high-content screen to uncover components and regulators of the vCLAMP contact site. (A) Schematic representation of the split-vCLAMP reporter strain. The strain contains the VC fragment of the split-Venus fused to the vacuolar transporter Zrc1 and the VN fragment fused to the outer mitochondrial transmembrane protein Tom70. The two fragments of the Venus protein can come into contact only when the two membranes are in very close apposition, as in a contact site. Reconstitution of the Venus protein emits a fluorescent signal, reporting on the contact site localization. (B) Schematic representation of the high-content microscopy screen. Yeast strains carrying the split-vCLAMP reporter were mated with a collection of strains each expressing one protein tagged with an mCherry fluorophore and under the strong TEF2 promoter. Haploid cells carrying the reporter and an overexpressed protein tagged with mCherry were analyzed by automated fluorescence microscopy and manually inspected for colocalization or changes in the abundance or morphology of the contact site. (C) Representative fluorescence microscopy images of the different categories of hits identified in the screen. All hits for each category are listed on the left. Images for each category correlate to the protein in bold. Scale bar represents 5 µm. (D) Representative fluorescence microscopy image of the colocalization between mCherry-Cvm1 expressed under the control of the TEF2 promoter and the split-vCLAMP reporter fluorescence, explained in A. Scale bar represents 5 µm. (E) The colocalization of Cvm1 with the split-vCLAMP signal occurs in the proximity of the vacuole and the mitochondrial network. Fluorescence microscopy analysis of mCherry-Cvm1 under the control of the TEF2 promoter, the split-vCLAMP reporter signal, Shm1-Halo stained with JF646 as a mitochondrial marker, and CMAC as vacuolar marker. Scale bar represents 5 µm. BF = Brightfield. (F) Diagram of the Cvm1 protein depicting the region predicted as homologous to α-β hydrolase fold proteins and the region predicted as intrinsically disordered.
Figure S1.
Figure S1.
Representative fluorescence microscopy images for each hit of the high-content screen. Related to Fig. 1. (A–D) Split-vCLAMP signal in the absence of overexpressed mCherry-tagged proteins (A). Hits were characterized based on colocalization with split-vCLAMP reporter (B), colocalization and effect (C), and effect only (D). Scale bars represent 5 µm. CS = contact site; BF = Brightfield.
Figure 2.
Figure 2.
Cvm1 is a vCLAMP-resident protein and acts as a tether of the contact site. (A and B) Fluorescence microscopy analysis of the localization of GFP-Cvm1 under the control of the TEF1 promoter (A) or NOP1 promoter (B), Shm1-mKate2 as a mitochondrial marker, and CMAC staining as a vacuolar marker. The GFP-Cvm1 signal is observed as accumulations in the regions where the mitochondrial network is apposed to the vacuole (white arrowheads). Additionally, some accumulations are observed which are away from the mitochondria, but always localize to the vacuolar rim (cyan arrowheads). Scale bar represents 5 µm. BF = Brightfield. (C) Fluorescence microscopy analysis of the localization of GFP-Cvm1 under the control of the endogenous CVM1 promoter in the endogenous chromosomal locus, Shm1-mKate2 as a mitochondrial marker, and CMAC staining as a vacuolar marker. The GFP-Cvm1 image is also shown with a fire look-up table (depicted below the image) to allow easier identification of accumulations. The GFP-Cvm1 signal is more homogeneous under the endogenous promoter than when Cvm1 is overexpressed. Strong accumulations can be observed, which occur away from the mitochondrial network (cyan arrowhead). Additionally, in regions of apposition of the mitochondrial network and the vacuole, some milder accumulations can be observed (white arrowhead). Scale bar represents 5 µm. (D) Ultrathin cryosections obtained from WT and overexpressed GFP-Cvm1 (TEF1 promoter) were immunogold-labeled for GFP. The presence of GFP-Cvm1 was detected at the interfaces between the vacuole (V) and the mitochondria (M), which were also extended in this strain. CW = cell wall; PM = plasma membrane. (E and F) Analysis of mitochondrial copurification in vacuole preparations. Vacuoles were purified from a WT and a deletion of CVM1 (E) and overexpression of CVM1 (F) under the control of the TEF1 promoter. Copurification of mitochondria was assessed from the levels of Por1 or Tom40 (mitochondrial markers) and Vac8 (vacuolar marker) in the purified vacuole fraction by Western blot. The bar graphs show mean ± SD of the ratio of Por1 or Tom40 to Vac8 in the vacuole fraction normalized to the ratio for the WT sample in each experiment (E, n = 3; F, n = 4). Source data are available for this figure: SourceData F2.
Figure S2.
Figure S2.
Cvm1 is not redundant with ERMES or the Vps39-mediated vCLAMP. Related to Figs. 2 and 3. (A) Analysis of the levels in whole-cell lysate of the marker proteins used to assess copurification of mitochondria with vacuoles in Fig. 2, E and F, and in Fig. 3, C and D. Pgk1 is used as a loading control. The levels of the marker proteins are not significantly affected by the different genotypes used. (B) Analysis of the genetic interaction of Cvm1 with the ERMES complex. Cells carrying the mmm1-1 temperature-sensitive allele, plus the indicated deletions or genomic modifications, were spotted as serial dilutions in YPD plates and grown at 23 or 37°C. (C) Analysis of the genetic interaction of Cvm1 with the Vps3912xM vCLAMP-impaired allele. Cells of the indicated genotypes were spotted as serial dilutions in YPD plates with or without 3 mM ZnCl2 and grown at 30°C. (D) Analysis of the genetic interaction of Cvm1 with the Vps3912xM vCLAMP-impaired allele. Cells of the indicated genotypes were diluted to OD600 = 0.1 in 96-well plates in YPD or YPD+ 3 mM ZnCl2 at 30°C. Absorbance at 600 nm was recorded using a plate reader during ∼16 h, and duplication times were calculated from the exponential phase of the growth curve. ***, P < 0.001. Source data are available for this figure: SourceData FS2.
Figure 3.
Figure 3.
Relationship of Cvm1 with other vCLAMP components. (A) Vps39 and Cvm1 stain mostly distinct areas of the vCLAMP contact site. Representative images and quantification of a fluorescence microscopy analysis of the localization of mCherry-Cvm1 and GFP-Vps39, both under the control of the TEF1 promoter, Shm1-Halo stained with JF646 as a mitochondrial marker, and CMAC staining as a vacuolar marker. Both the signal of Vps39 and Cvm1 accumulate in the vacuole–mitochondria interface, but they mostly exclude each other (cyan and yellow arrowheads). However, some regions show double labeling (overlapping cyan and yellow arrowheads). All scale bars represent 2 µm. The bar graph shows the percentage of Vps39 or Cvm1 structures that colocalize or not with the other marker; bars are mean from three independent experiments, shown as individual dots. Error bars represent SD. (B) Cvm1 and Vps13 do not colocalize. Fluorescence microscopy analysis of the localization of mCherry-Cvm1 under the control of the TEF1 promoter, Vps13 internally tagged with GFP, and CMAC staining as a vacuolar marker. No colocalization was observed between the signals of Vps13 and Cvm1. Scale bar represents 2 µm. BF = Brightfield. (C) Analysis of the dependence of Vps39 on Cvm1 to generate extended vCLAMPs. The mitochondrial copurification in vacuole preparations was analyzed. Vacuoles were purified from the indicated strains, and the copurification of mitochondria was assessed from the levels of Por1 (mitochondrial marker) and Vph1 (vacuolar marker) in the purified vacuole fraction by Western blot. The bar graph shows mean ± SD of the ratio of Por1/Vph1 in the vacuole fraction normalized to the ratio for the WT sample in each experiment (n = 2). (D) Analysis of the dependence of Cvm1 on Vps39 to generate extended vCLAMPs. The mitochondrial copurification in vacuole preparations was analyzed. Vacuoles were purified from the indicated strains, and the copurification of mitochondria was assessed from the levels of Por1 (mitochondrial marker) and Vac8 (vacuolar marker) in the purified vacuole fraction by Western blot. The bar graph shows mean ± SD of the ratio of Por1/Vac8 in the vacuole fraction normalized to the ratio for the WT sample in each experiment (n = 4). (E) Cvm1-mediated vCLAMPs are still formed when Vps39 vCLAMPs are impaired. Fluorescence microscopy analysis of a strain expressing GFP-Cvm1 under the control of the NOP1 promoter, Shm1-mKate2 as a mitochondrial marker, and labeled with CMAC as a vacuole lumen marker. Cvm1 forms accumulations in the interface between the vacuole and the mitochondria in the presence of both the WT Vps39 allele and the Vps3912xM allele, which is impaired for vCLAMP formation. Scale bar represents 2 µm. The bar graph displays mean ± SD of the percentage of cells showing Cvm1-positive vCLAMPs in both strains. Source data are available for this figure: SourceData F3.
Figure S3.
Figure S3.
Cvm1 does not co-localize with markers of the lipid droplets, endosomes, the Golgi complex, the trans-Golgi network, or the plasma membrane. Related to Fig. 4. (A–D) Fluorescence microscopy analysis of the localization of GFP-Cvm1 under the control of the NOP1 promoter with markers of different organelles. Erg6-mKate2 was used as a marker for lipid droplets, Vps8-Halo as a marker of late endosomes, Sec7-Halo as a marker of the trans-Golgi network/early endosomes, and Mnn9-Halo as a marker of the early Golgi complex. All strains containing a Halo-tagged protein were labeled with the JF646 ligand. Lipid droplets were imaged in logarithmic and stationary phase, because their morphology differs in these two growth phases. No significant colocalization was observed between GFP-Cvm1 and any of the markers. Scale bars represent 2 µm. BF = Brightfield. (E) Fluorescence microscopy analysis of the localization of mCherry-Cvm1 under the control of the TEF1 promoter and Pma1-GFP as a marker of the plasma membrane. No significant colocalization was observed between the two signals. Scale bar represents 2 µm. (F) Colocalization of Cvm1 with Vac8. Fluorescence microscopy images of a strain expressing GFP-Cvm1 under the control of the NOP1 promoter and Vac8-mKate2. Both proteins localize along the vacuole membrane. Some regions of enrichment of Cvm1 are also enriched in Vac8 compared with the rest of the vacuole membrane. Scale bar represents 2 µm.
Figure 4.
Figure 4.
Cvm1 localizes at the NVJ. (A and B) Fluorescence microscopy analysis of the localization of GFP-Cvm1 under the control of the NOP1 promoter (A) or the endogenous CVM1 promoter (B), Sec63-Halo stained with JF646 as a marker of the ER, and CMAC staining as a vacuolar marker. GFP-Cvm1 signal can be observed along the vacuole membrane, and accumulations of Cvm1 are observed in regions where the vacuole is closely apposed to the ER. Scale bar represents 2 µm. BF = Brightfield. (C) Fluorescence microscopy analysis of a split-NVJ reporter strain with mCherry-Cvm1 expressed under the control of the ADH1 promoter and CMAC as vacuolar staining. The split-NVJ reporter contains the VC fragment fused to the vacuolar protein Zrc1 and the VN fragment fused to the ER protein Sec63. Strong accumulations of Cvm1 do not colocalize with the reporter, but weaker accumulations of Cvm1 can be observed in regions positive for the reporter. mCherry-Cvm1 signal is shown with a Fire look-up table to make the enrichments of Cvm1 easier to observe. A bar showing the correspondence between intensity levels and color is shown below. Scale bar represents 2 µm. (D) Colocalization of Cvm1 with the NVJ marker Nvj1. Fluorescence microscopy images of a strain expressing GFP-Cvm1 under the control of the endogenous CVM1 promoter and Nvj1-mKate2 as a marker of the NVJ contact site. (1–3) Cvm1 localizes along the vacuole membrane. Some cells show enrichment of Cvm1 with the NVJ (1), whereas others show enrichment in a portion of the contact (2) or no enrichment (3), as shown by the line profiles along the vacuole membrane. The bar graph to the right shows the frequency of observation of the different phenotypes. Scale bars represent 2 µm. (E) Enrichment of Cvm1 in the vacuole–ER interface does not depend on Nvj1. Fluorescence microscopy analysis of the localization of GFP-Cvm1 under the control of the NOP1 promoter, Sec63-Halo stained with the JF646 ligand as a marker of the ER, and CMAC staining as a vacuolar marker. The experiment was performed in a strain containing the endogenous Nvj1 or a deletion of the gene. Accumulations of Cvm1 in regions of colocalization with the ER can still be observed in the absence of Nvj1.
Figure 5.
Figure 5.
Cvm1 localizes at the peroxisome–vacuole contact site. (A and B) Fluorescence microscopy analysis of the localization of GFP-Cvm1 under the control of the NOP1 promoter, Pex3-mKate2, or mCherry-SKL as peroxisomal markers, and CMAC staining as a vacuolar marker. Accumulations of GFP-Cvm1 signal can be observed on peroxisomes that are apposed to the vacuole. No signal of GFP-Cvm1 was observed on peroxisomes away from the vacuole. Additionally, GFP-Cvm1 signal can be observed on other areas of the vacuole. Scale bar represents 2 µm. BF = Brightfield. (C) Fluorescence microscopy analysis of a split-PerVale reporter strain with mCherry-Cvm1 expressed under the control of the TEF1 promoter and CMAC as a vacuolar staining. The split-PerVale reporter contains the VC fragment fused to the vacuolar protein Zrc1 and the VN fragment fused to the peroxisomal protein Pex25. Accumulations of Cvm1 sometimes colocalize with the signal of the split-PerVale reporter. Scale bar represents 2 µm. (D) Fluorescence microscopy analysis of the localization of GFP-Cvm1 under the control of the endogenous promoter, Pex3-mKate2 as a peroxisomal marker, and CMAC staining as a vacuolar marker. GFP-Cvm1 signal can be observed on the vacuolar membrane. Rarely, accumulations are observed next to peroxisomes that are apposed to the vacuole (see quantification in E). Scale bar represents 2 µm. (E) Quantification of the percentage of cells in which accumulations of Cvm1 are observed next to mitochondria, peroxisomes, or the nuclear ER, when Cvm1 is expressed under the control of either the NOP1 promoter or the endogenous CVM1 promoter. Bars represent average ± SD of three independent experiments, shown as individual dots. For each experiment, ≥50 cells were counted per condition. (F) Plot showing the number of accumulations of Cvm1 on the vacuole membrane per cell (circles), when Cvm1 is expressed under the control of the CVM1 promoter or the NOP1 promoter. The average for each of three independent experiments is shown as a diamond; ≥40 cells were counted per experiment and condition. (G) Plot showing the number of Cvm1 accumulations per cell (circles) in proximity of either mitochondria, peroxisomes, or the nuclear ER, when Cvm1 is expressed under the control of the NOP1 promoter. The average for each of three independent experiment is shown as a diamond; ≥70 cells were counted per experiment and condition. (H) Fluorescence microscopy analysis of a GFP-Cvm1 under the control of the NOP1 promoter with Pex3-mKate2 as a peroxisomal marker, Nvj1-Halo labeled with JF646, and CMAC as a vacuolar staining. 9 ± 8% of the structures containing GFP-Cvm1 and Pex3-mKate2 were found in the proximity of Nvj1-Halo (n = 3 independent experiments). Scale bars represent 2 µm. (I) Fluorescence microscopy analysis of a GFP-Cvm1 under the control of the NOP1 promoter with Nvj1-mKate2, Tom70-Halo labeled with JF646 as a mitochondrial marker, and CMAC as a vacuolar staining. 10 ± 4% of the structures containing GFP-Cvm1 and Tom70-Halo were found in the proximity of Nvj1-mKate2 (n = 3 independent experiments). Scale bars represent 2 µm.
Figure 6.
Figure 6.
Cvm1 plays a role in sphingolipid homeostasis. (A) Diagram of the S. cerevisiae sphingolipid biosynthesis pathway, the enzymes involved, and the steps inhibited by the drugs myriocin and AbA. LCB, long-chain base. (B) Cells lacking Cvm1 are hypersensitive to myriocin. A WT strain, a strain carrying a CVM1 deletion, or three different clones carrying a CVM1 deletion transformed with a plasmid carrying CVM1 were spotted as seriated dilutions on YPD medium with or without 1 μM myriocin. (C) Cells with overexpressed CVM1 under the control of the TEF1 promoter are hyperresistant to myriocin. WT and CVM1 overexpression strains were spotted as seriated dilutions on YPD medium with or without 1.5 µM myriocin. (D) Cells lacking or overexpressing Cvm1 are hypersensitive to AbA. A WT strain, a CVM1 deletion strain, and a strain overexpressing CVM1 From the TEF1 promoter were spotted as seriated dilutions on YPD medium with or without 70 nM AbA. (E) MS-based lipidomics of whole-cell lysates of WT, Δcvm1, and CVM1 overexpression strains. Samples were normalized according to protein levels and an internal standard. For each lipid class, a ratio to the WT strain is shown. Five independent purifications were measured; bar graphs represent average ± SD, and the values for the independent samples are shown as diamonds. Samples that deviate significantly from the WT (P < 0.05) are marked with an asterisk. PA, phosphatidic acid; PG, phosphatidylglycerol; PI, phosphatidylinositol; PS, phosphatidylserine; PE, phosphatidylethanolamine; PC, phosphatidylcholine; DG, diacylglycerol; TAG, triacylglycerol. (F and G) Targeted multiple-reaction monitoring MS lipid measurements of dihidrosphingosine (DHS), phytosphingosine (PHS), and ceramides (PHC) in whole-cell lysates of WT, Δcvm1 (F), and CVM1 (G) overexpression strains. Bars represent mean ± SD from four independent samples which are also shown as diamonds. Samples that deviate significantly from the WT (P < 0.05) are marked with an asterisk.
Figure S4.
Figure S4.
Extended lipid analyses of strains lacking or overexpressing Cvm1. Related to Fig. 6. (A) Cvm1 tagged in its N-terminus is functional as assessed by the myriocin sensitivity phenotype. WT and GFP tagged Cvm1 strains were spotted as seriated dilutions on YPD plates or YPD plates containing 1 μM myriocin. (B) Strains carrying the Vps3912xM vCLAMP-impaired mutant or a deletion of VPS13Δ growth normally on myriocin. WT, CVM1 deletion, VPS13 deletion, and VPS3912xM strains were spotted as seriated dilutions on YPD medium with or without 1 µM myriocin. (C and D) Targeted MS-based lipid measurement of different phytoceramide species from whole-cell lysates of WT, Δcvm1, and strains overexpressing CVM1, related to Fig. 6, F and G. The ratios of the peak areas normalized to the WT are shown for the different measured phytoceramide species; bars represent mean ± SD for four independent samples. Samples that differ significantly from the WT (P < 0.05) are marked with an asterisk. (E) Cells with overexpressed CVM1 under the control of the TEF1 promoter are hypersensitive to terbinafine. WT, CVM1 overexpression, and CVM1 deletion strains were spotted as seriated dilutions on YPD medium with or without 50 µg/ml terbinafine. (F) Cells with overexpressed CVM1 under the control of the TEF1 promoter show decreased ergosterol levels. Ergosterol levels (µg ergosterol/mg protein) of WT, Δcvm1, and CVM1 overexpression strains were measured using the Amplex Red Cholesterol-Assay-Kit (Invitrogen). Bars represent mean ± SD for three independent measurements. *, P < 0.05.
Figure 7.
Figure 7.
Cvm1 levels affect sphingolipid-sensing pathways. (A) Colocalization of Slm1 with Pil1. Colocalization of Slm1-mNeonGreen with Pil1-2xmKate2 was analyzed in WT, cvm1Δ, and TEF1pr-CVM1 strains. As a control, the WT strain was incubated with 5 μM myriocin for 45 min. Scale bar represents 2μm. BF = Brightfield. (B) Plot showing the quantification of the experiment shown in A. For each image, a manual threshold was applied for each channel, and the percentage of Slm1 structures that colocalized with Pil1 structures was determined for each cell. Each dot represents one cell, and the bigger dots represent the mean for each independent experiment. 20 cells were quantified for each condition and experiment, and the experiment was performed three times. (C) Plot showing the quantification of eisosomes per cell from the experiment shown in A. The number of eisosomes per cell assessed as Pil1-2xmKate2–positive structures was determined. Each dot represents one cell, and the bigger dots represent the mean for each independent experiment. 20 cells were quantified for each condition and experiment, and the experiment was performed three times. (D) Analysis of the phosphorylation-dependent upshift of Orm1. Whole-cell lysates from the indicated strains were used to analyze the upshift of HA-tagged Orm1 by Western blot. As a control, the WT strain was grown for 1 h in YPD + 5 µM myriocin. Pgk1 is used as a loading control. **, P < 0.01. Source data are available for this figure: SourceData F7.
Figure 8.
Figure 8.
Cvm1-mediated contacts are induced by a decrease in complex sphingolipid levels. (A) Cvm1 accumulates at the NVJ upon depletion of sphingolipids. Fluorescence microscopy analysis of the localization of GFP-Cvm1 under the control of the endogenous promoter, Nvj1-mKate2 as a NVJ marker, and CMAC staining as a vacuolar marker. Cells were grown in rich media (YPAD) and incubated with 5 μM myriocin for 60 min where indicated. Under normal growth conditions, Cvm1 accumulates at the NVJ in some cells. After incubation with myriocin, the accumulations of Cvm1 at the NVJ become more pronounced and happen in a higher number of cells. Scale bar represents 2 μm. Dotted lines mark cell outlines. (B) Quantification of the effect of myriocin and AbA on the localization of GFP-Cvm1 to the NVJ; representative images are shown in A and Fig. S5 A. Cells were grown in YPD and incubated with 5 μM myriocin for 60 min or 250 nM AbA for 30 min before imaging. The percentage of cells in which Cvm1 was enriched at the NVJ was quantified for each growth condition. The bars represent the mean ± SD for three independent measurements. (C) Quantification of enrichment of GFP-Cvm1 at the NVJ upon treatment with myriocin and AbA. For each cell, an NVJ enrichment factor was calculated as the mean intensity value of GFP-Cvm1 along a line profile within the NVJ, divided by the mean intensity value in a line profile along the rest of the vacuolar membrane. Each dot represents one cell, and the bigger circles represent the mean for each of three independent experiments. For each experiment and condition, at least 40 cells were analyzed. (D) Cvm1 accumulates more frequently at PerVale upon decreasing sphingolipid levels. Fluorescence microscopy analysis of the localization of GFP-Cvm1 under the control of the endogenous promoter, Pex3-mKate2 as a peroxisomal marker, and CMAC staining as a vacuolar marker. Cells were grown in YPAD and incubated with 5 μM myriocin for 60 min where indicated. Scale bar represents 2 μm. (E) Quantification of the effect of myriocin and AbA on the distribution of GFP-Cvm1. Cells were grown in YPAD and incubated with 5 μM myriocin for 60 min or 250 nM AbA for 30 min before imaging (related to D and Fig. S5 B). A Cvm1-positive PerVale was considered as an accumulation of GFP-Cvm1 fluorescence in the place where a peroxisome (labeled with Pex3-mKate2) was apposed to the vacuole (labeled with CMAC). A percentage was determined for each experiment, and the bars represent the mean of the three experiments; 50 cells were quantified per condition and experiment. (F) Cvm1 accumulations at the vCLAMP are more frequent upon decreasing sphingolipid levels. Fluorescence microscopy analysis of the localization of GFP-Cvm1 under the control of the endogenous promoter, Shm1-mKate2 as a mitochondrial marker, and CMAC staining as a vacuolar marker. Cells were grown in YPD and incubated with 5 μM myriocin for 60 min where indicated. Scale bar represents 2 μm. (G) Quantification of effect of myriocin and AbA on the distribution of GFP-Cvm1. Cells were grown in YPD and incubated with 5 μM myriocin for 60 min or 250 nM AbA for 30 min before imaging (related to F and Fig. S5 C). A Cvm1-positive vCLAMP was considered as an accumulation of GFP-Cvm1 fluorescence in the place where the mitochondria (labeled with Shm1-mKate2) was apposed to the vacuole (labeled with CMAC). A percentage was determined for each experiment, and the bars represent the mean of the three experiments; error bars represent SD; 50 cells were quantified per condition and experiment. *, P < 0.05; **, P < 0.01; ***, P < 0.001.
Figure S5.
Figure S5.
Cvm1-mediated contacts are induced by a decrease in complex sphingolipids, but protein levels of Cvm1 are not altered. Related to Fig. 8. (A) Cvm1 accumulates at the NVJ upon depletion of sphingolipids. Fluorescence microscopy analysis of the localization of GFP-Cvm1 under the control of the endogenous promoter, Nvj1-mKate2 as a NVJ marker, and CMAC staining as a vacuolar marker. Cells were grown in rich media (YPAD) and incubated with 250 nM AbA for 30 min where indicated. Under normal growth conditions, Cvm1 is accumulated in the NVJ in some cells and not in others. After incubation with AbA, the accumulations of Cvm1 at the NVJ become more pronounced and happen in more cells. Scale bar represents 2 μm. BF = Brightfield. (B) Cvm1 accumulations at the PerVale are more frequent upon decreasing sphingolipid levels. Fluorescence microscopy analysis of the localization of GFP-Cvm1 under the control of the endogenous promoter, Pex3-mKate2 as a peroxisomal marker, and CMAC staining as a vacuolar marker. Cells were grown in YPAD and incubated with 5 μM AbA for 60 min where indicated. Scale bar represents 2 μm. (C) Cvm1 accumulations at the vCLAMP are more frequent upon decreasing sphingolipid levels. Fluorescence microscopy analysis of the localization of GFP-Cvm1 under the control of the endogenous promoter, Shm1-mKate2 as a mitochondrial marker, and CMAC staining as a vacuolar marker. Cells were grown in YPD and incubated with 5 μM AbA for 60 min where indicated. The yellow arrowheads indicate accumulations of Cvm1 on the vacuole membrane that co-localize with the mitochondrial network. Scale bar represents 2 μm. (D) Cvm1 protein levels are not affected by myriocin treatment. Whole-cell lysates of a strain containing GFP-Cvm1 under the control of its endogenous promoter were normalized by total protein amount and analyzed by SDS-PAGE and Western blot. The levels of GFP-Cvm1 do not change significantly throughout the treatment with the drug. Pgk1 was used as a loading control. Source data are available for this figure: SourceData FS5.

References

    1. Balderhaar, H.J., and Ungermann C.. 2013. CORVET and HOPS tethering complexes: Coordinators of endosome and lysosome fusion. J. Cell Sci. 126:1307–1316. 10.1242/jcs.107805 - DOI - PubMed
    1. Barbosa, A.D., Sembongi H., Su W.M., Abreu S., Reggiori F., Carman G.M., and Siniossoglou S.. 2015. Lipid partitioning at the nuclear envelope controls membrane biogenesis. Mol. Biol. Cell. 26:3641–3657. 10.1091/mbc.E15-03-0173 - DOI - PMC - PubMed
    1. Bean, B.D.M., Dziurdzik S.K., Kolehmainen K.L., Fowler C.M.S., Kwong W.K., Grad L.I., Davey M., Schluter C., and Conibear E.. 2018. Competitive organelle-specific adaptors recruit Vps13 to membrane contact sites. J. Cell Biol. 217:3593–3607. 10.1083/jcb.201804111 - DOI - PMC - PubMed
    1. Berchtold, D., Piccolis M., Chiaruttini N., Riezman I., Riezman H., Roux A., Walther T.C., and Loewith R.. 2012. Plasma membrane stress induces relocalization of Slm proteins and activation of TORC2 to promote sphingolipid synthesis. Nat. Cell Biol. 14:542–547. 10.1038/ncb2480 - DOI - PubMed
    1. Binda, M., Péli-Gulli M.P., Bonfils G., Panchaud N., Urban J., Sturgill T.W., Loewith R., and De Virgilio C.. 2009. The Vam6 GEF controls TORC1 by activating the EGO complex. Mol. Cell. 35:563–573. 10.1016/j.molcel.2009.06.033 - DOI - PubMed

Publication types

MeSH terms

Substances

LinkOut - more resources