

Prescribing costs of hypoglycaemic agents and associations with metabolic control in Wales; a national analysis of primary care data
- PMID: 35766972
- PMCID: PMC9545615
- DOI: 10.1111/dme.14908
Prescribing costs of hypoglycaemic agents and associations with metabolic control in Wales; a national analysis of primary care data
Abstract
Aims: There has been a dramatic increase in hypoglycaemic agent expenditure. We assessed the variability in prescribing costs at the practice level and the relationship between expenditure and the proportion of patients achieving target glycaemic control.
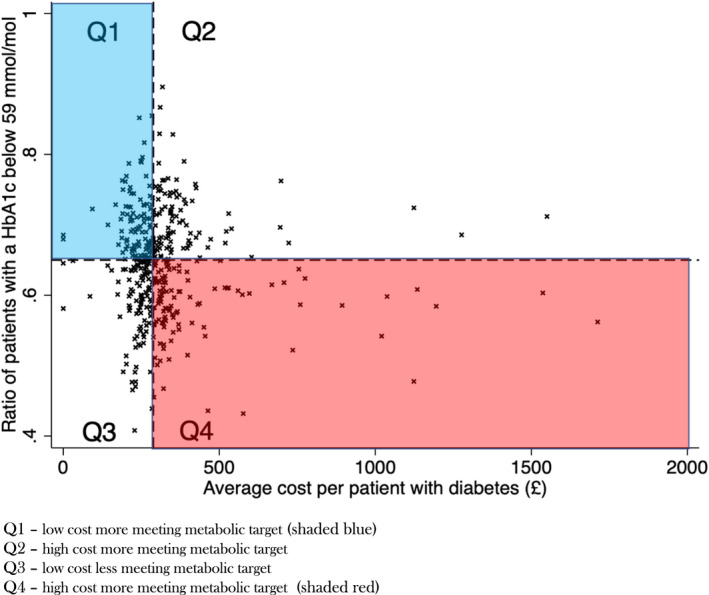
Methods: We utilized national prescribing data from 406 general practices in Wales. This was compared against glycaemic control (percentage of patients achieving a HbA1c level < 59 mmol/mol in the preceding 12 months). Analyses were adjusted for the number of patients with diabetes in each general practice and the Welsh Index of Multiple Deprivation.
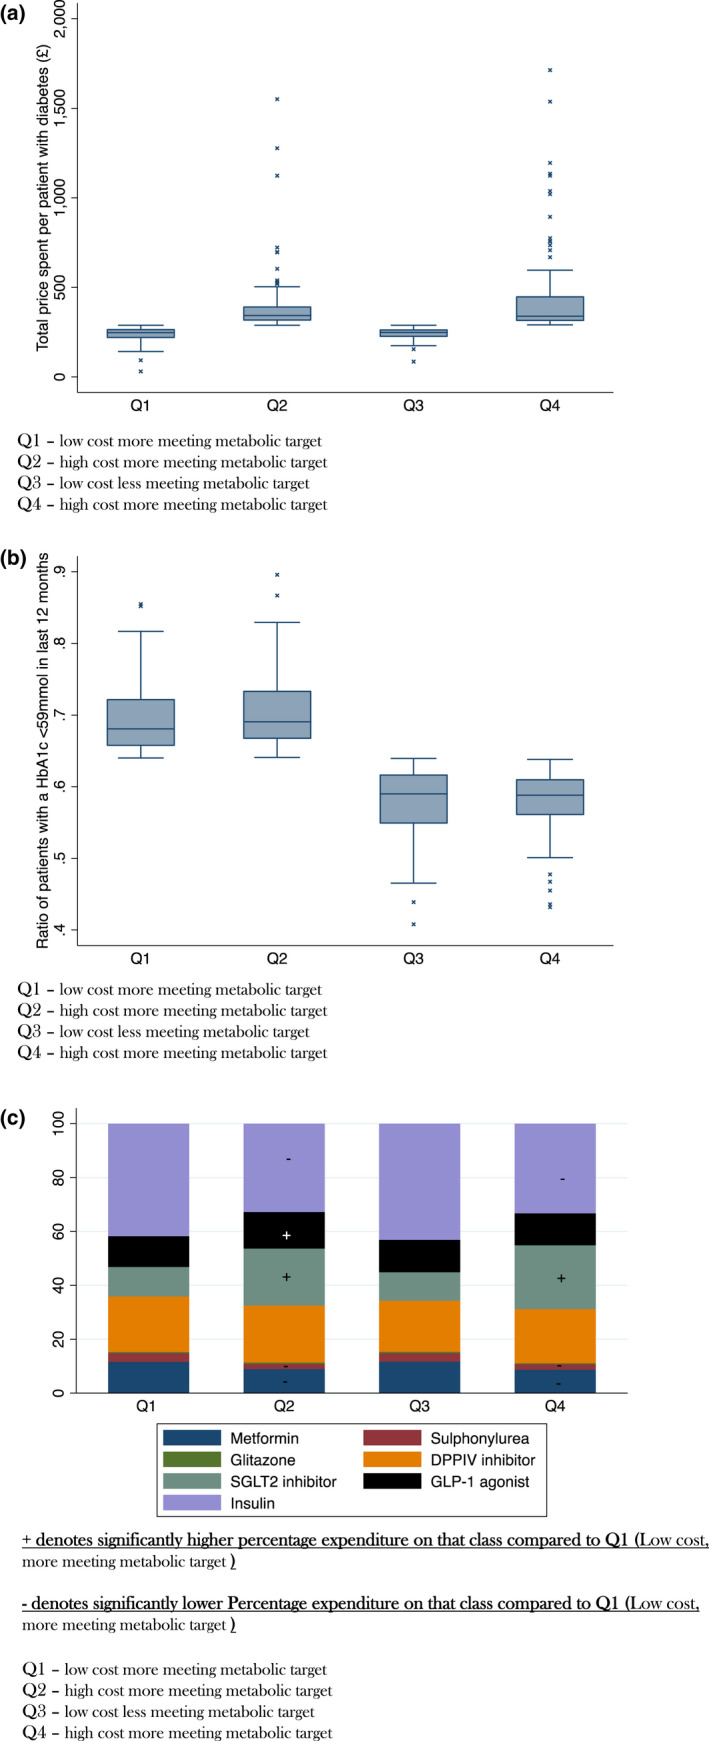
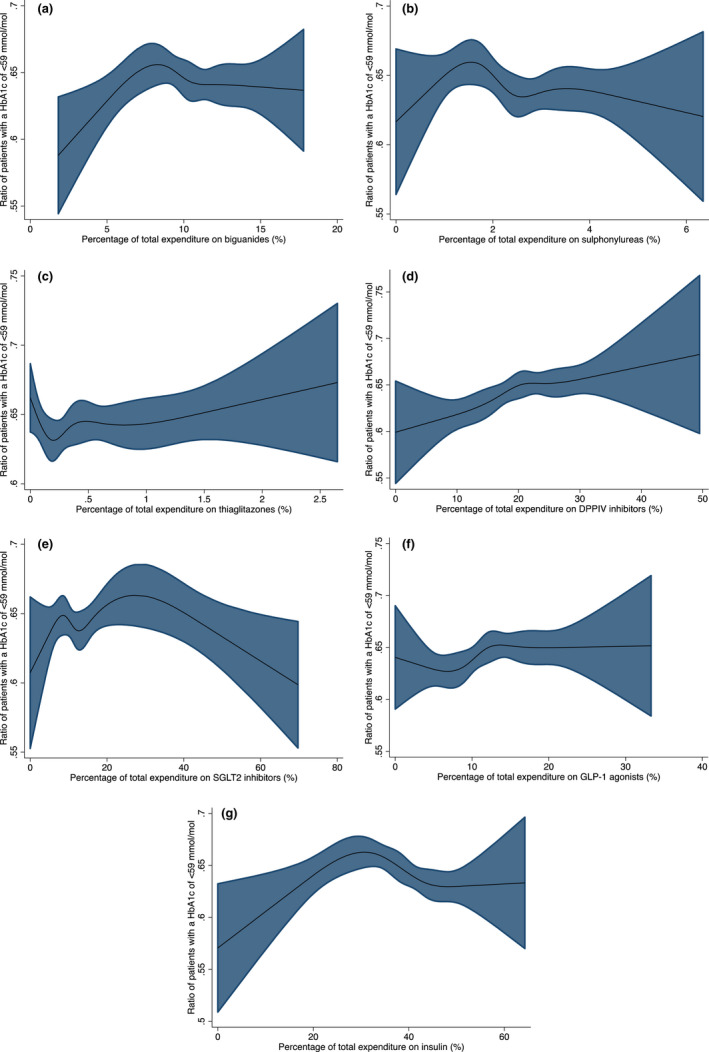
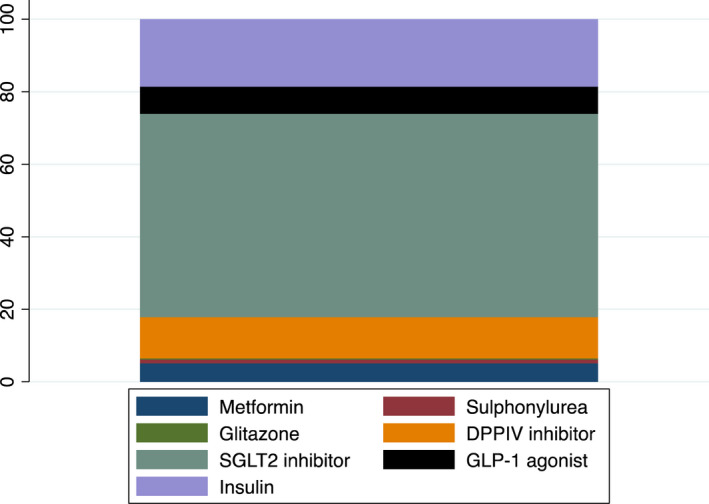
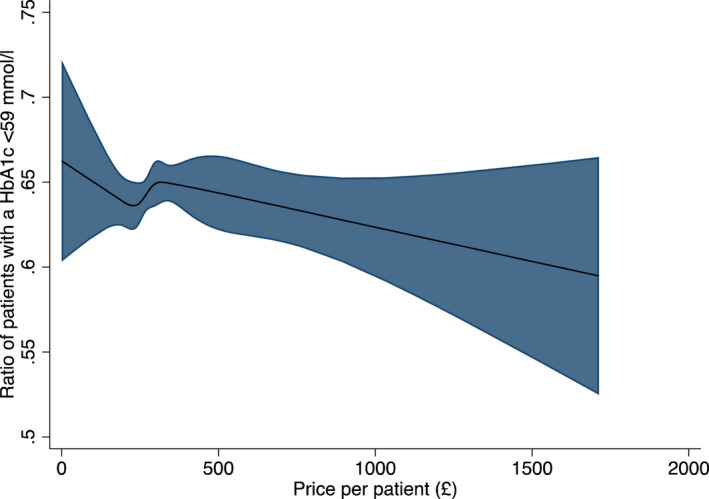
Results: There was considerable heterogeneity in hypoglycaemic agent spend per patient with diabetes, Median = £289 (IQR 247-343) range £31.1-£1713. Higher total expenditure was not associated with improved glycaemic control B(std) = -0.01 (95%CI -0.01, 0.002) p = 0.13. High-spend practices spent more on SGLT2 inhibitors (16 vs. 9% p < 0.001) and GLP-1 agonists (13 vs. 11% p < 0.001) and less on insulin (34 vs. 42% p < 0.001), biguanides (9 vs. 11% p = 0.001) and sulphonylureas (2 vs. 3% p < 0.001) than low spend practices. There were no differences in the pattern of drug prescribing between high spend practices with better glycaemic control (mean 68% of patients HbA1c <59 mmol/mol) and those with less good metabolic control (mean 58% of patients HbA1c <59 mmol/mol).
Conclusions: Spend on hypoglycaemic agents is highly variable between practices and increased expenditure per patient is not associated with better glycaemic control. Whilst newer, more expensive agents have additional benefits, in individuals where these advantages are more marginal widespread use of these agents has important cost implications.
Keywords: HbA1c; Hypoglycaemic agents; cost; primary care.
© 2022 The Authors. Diabetic Medicine published by John Wiley & Sons Ltd on behalf of Diabetes UK.
Figures
References
-
- Zheng Y, Ley SH, Hu FB. Global aetiology and epidemiology of type 2 diabetes mellitus and its complications. Nat Rev Endocrinol. 2018;14(2):88‐98. - PubMed
-
- Stedman M, Lunt M, Livingston M, et al. The costs of drug prescriptions for diabetes in the NHS. The Lancet. 2019;393(10168):226‐227. - PubMed
-
- Type 2 diabetes in adults: management, NICE guideline NG28. Published December 2015, last updated April 2017.
MeSH terms
Substances
LinkOut - more resources
Full Text Sources
Medical
Research Materials
