. 2022 Jul 13;22(13):5357-5364.
doi: 10.1021/acs.nanolett.2c01338. Epub 2022 Jun 29.

Quantification of Protein Glycosylation Using Nanopores

Affiliations

Quantification of Protein Glycosylation Using Nanopores

Roderick Corstiaan Abraham Versloot et al. Nano Lett. .

Abstract

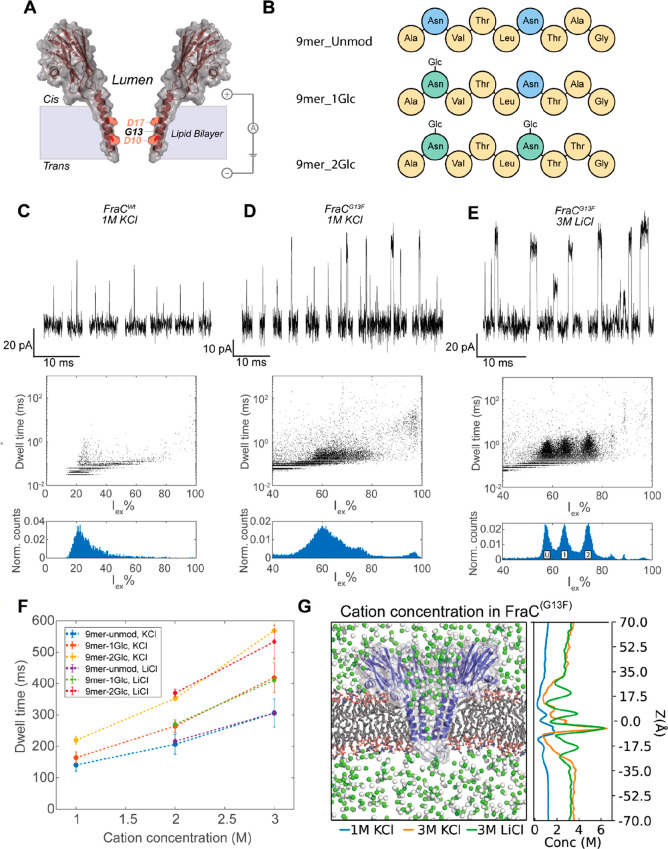
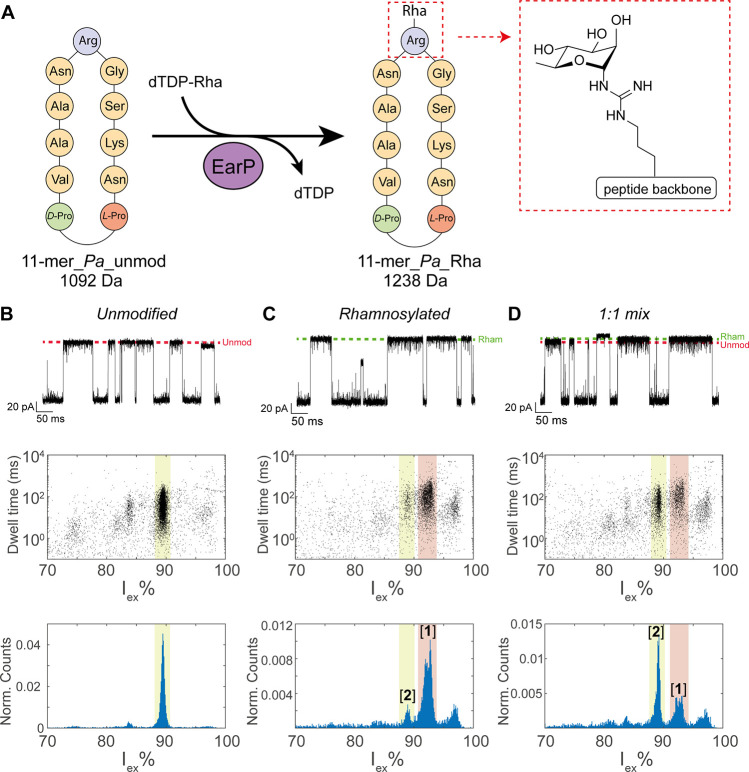
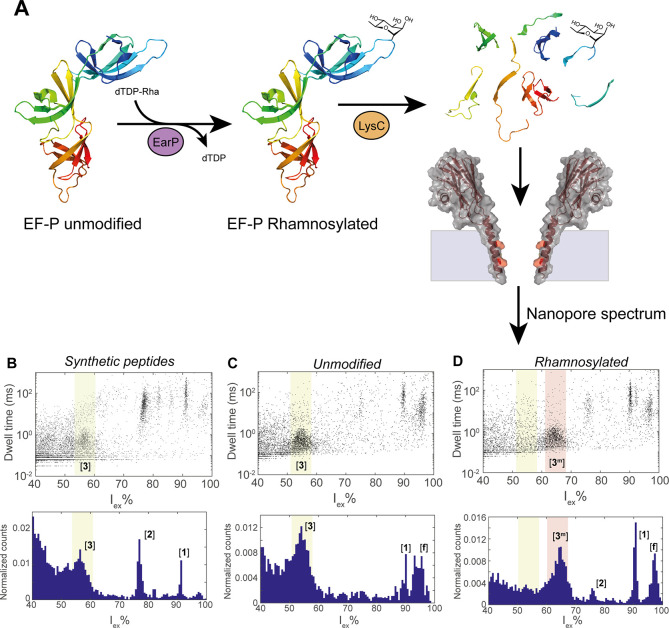
Although nanopores can be used for single-molecule sequencing of nucleic acids using low-cost portable devices, the characterization of proteins and their modifications has yet to be established. Here, we show that hydrophilic or glycosylated peptides translocate too quickly across FraC nanopores to be recognized. However, high ionic strengths (i.e., 3 M LiCl) and low pH (i.e., pH 3) together with using a nanopore with a phenylalanine at its constriction allows the recognition of hydrophilic peptides, and to distinguish between mono- and diglycosylated peptides. Using these conditions, we devise a nanopore method to detect, characterize, and quantify post-translational modifications in generic proteins, which is one of the pressing challenges in proteomic analysis.

Keywords: nanopore spectrometry; protein glycosylation; proteomics; rhamnosylation; single molecule.


Conflict of interest statement

The authors declare the following competing financial interest(s): G.M. is a founder, director, and shareholder of Portal Biotech Limited, a company engaged in the development of nanopore technologies. This work was not supported by Portal Biotech Limited.

Figures

Figure 1
Figure 1
Detection of glycopeptides in FraC nanopores. (A) Schematic representation of a FraC monomer. The lumen-facing residues in the constriction of the pore are indicated. (B) Schematic representation of the composition of the peptides used. (C–E) Representative events (top), dwell time versus excluded current (middle) and excluded current histogram (bottom) of an equimolar mixture of 9mer_unmod, 9mer_1Glc, and 9mer_2Glc measured in (C) FraCWt in 1 M KCl and 10 μM peptide mixture, (D) FraCG13F in 1 M KCl and 2.5 μM peptide mixture, (E) FraCG13F in 3 M LiCl and 5 μM peptide mixture. The location of peaks in the histogram belonging to 9mer_unmod (U), 9mer_1Glc (1), and 9mer_2Glc (2) are indicated. Data were recorded at 50 kHz sampling frequency, with a 10 kHz Bessel filter at pH 3.8. (F) Dwell time of the glycopeptides in buffers with varying salt concentrations. (G) The left panel shows a cut through of a MD simulation of a FraCG13F nanopore (blue) in a lipid bilayer (gray) in the presence of 3 M concentration of potassium (green) and chloride (white) ions at pH 3.8. The right panel shows the cation concentration along the z-axis averaged over 20 ns of MD simulation trajectory under a −50 mV potential.
Figure 2
Figure 2
Nanopore detection of rhamnosylation in cyclic peptides. (A) Schematic representation of the cyclic peptides before and after the rhamnosylation reaction. (B–D) Characteristic events (top), dwell time versus excluded current (middle), and excluded current histogram (bottom) of (B) 2.5 μM 11-mer_Pa_unmod, (C) 2.5 μM 11-mer_Pa_Rha, and (D) their 1:1 mixture in a final concentration of 2.5 μM. The dotted lines indicate the approximate ionic current levels of the unmodified (red) and rhamnosylated (green) peptide. The locations of event cluster [1] and cluster [2] are highlighted in red and yellow, respectively. Measurements in 3 M LiCl and 50 mM citric acid buffered to pH 3.8 under an applied voltage of −50 mV. Data were recorded at 50 kHz sampling frequency, with a 10 kHz Bessel filter.
Figure 3
Figure 3
Detection of rhamnosylation in EF-P. (A) Schematic representation of the rhamnosylation and subsequent LysC digestion of EF-P. (B) Event characteristics after the addition of a mixture of synthetic peptides ([1], [2], [3], and [4]). (C) Event characteristics after addition of Lys-C digested unmodified EF-P. (C) Event characteristics after addition of Lys-C digested rhamnosylated EF-P. The location of the event clusters [f], [1], [2], [3], and [3m] are indicated in the Iex% histogram, and the event clusters belonging to peptide [3] and [3m] are highlighted in yellow and red, respectively. Measurements in 3 M LiCl, buffered to pH 3.8, at −50 mV applied voltage. Data were recorded with a 50 kHz sampling frequency and a 10 kHz Bessel filter.

References

    1. Khoury G. A.; Baliban R. C.; Floudas C. A. Proteome-Wide Post-Translational Modification Statistics: Frequency Analysis and Curation of the Swiss-Prot Database. Sci. Rep. 2011, 1 (1), 90.10.1038/srep00090. - DOI - PMC - PubMed
    1. Zhang L.; Luo S.; Zhang B. The Use of Lectin Microarray for Assessing Glycosylation of Therapeutic Proteins. MAbs 2016, 8 (3), 524–535. 10.1080/19420862.2016.1149662. - DOI - PMC - PubMed
    1. Roth Z.; Yehezkel G.; Khalaila I. Identification and Quantification of Protein Glycosylation. Int. J. Carbohydr. Chem. 2012, 2012, 1–10. 10.1155/2012/640923. - DOI
    1. West M. B.; Partyka K.; Feasley C. L.; Maupin K. A.; Goppallawa I.; West C. M.; Haab B. B.; Hanigan M. H. Detection of Distinct Glycosylation Patterns on Human γ-Glutamyl Transpeptidase 1 Using Antibody-Lectin Sandwich Array (ALSA) Technology. BMC Biotechnol. 2014, 14 (1), 101.10.1186/s12896-014-0101-0. - DOI - PMC - PubMed
    1. Zaro B. W.; Yang Y.-Y.; Hang H. C.; Pratt M. R. Chemical Reporters for Fluorescent Detection and Identification of O-GlcNAc-Modified Proteins Reveal Glycosylation of the Ubiquitin Ligase NEDD4–1. Proc. Natl. Acad. Sci. U. S. A. 2011, 108 (20), 8146–8151. 10.1073/pnas.1102458108. - DOI - PMC - PubMed

Publication types