The hyaluronan-related genes HAS2, HYAL1-4, PH20 and HYALP1 are associated with prognosis, cell viability and spheroid formation capacity in ovarian cancer
- PMID: 35767191
- PMCID: PMC9587083
- DOI: 10.1007/s00432-022-04127-6
The hyaluronan-related genes HAS2, HYAL1-4, PH20 and HYALP1 are associated with prognosis, cell viability and spheroid formation capacity in ovarian cancer
Abstract
Purpose: Hyaluronan modulates tumour progression, including cell adhesion, cohesion, proliferation and invasion, and the cancer stem cell phenotype. In ovarian cancer, high levels of stromal hyaluronan are associated with poor prognosis. In this work, hyaluronan synthases (HAS1-3) and hyaluronidases (HYAL1-4, PH-20, HYALP1) were examined with regard to different levels of gene expression and its influence on ovarian cancer patients' survival. The impact of a siRNA depletion of HAS2 was investigated in vitro.
Methods: Using the Kaplan-Meier Plotter tool, we investigated the influence of hyaluronic synthases and hyaluronidases on the survival of a collective of 1435 ovarian cancer patients. Differences in gene expression between normal (n = 46) and cancerous (n = 744) ovarian tissue were examined using the TNMplot database. Following an evaluation of hyaluronan-related gene expression in the ATCC ovarian cancer panel, we studied SKOV3 and SW 626 ovarian cancer cells subjected to HAS2 siRNA or control siRNA treatment in terms of HAS1-3, HYAL2 and HYAL3 mRNA expression. We investigated the ability to form spheroids using the Hanging Drop method and the response to chemotherapy at different concentrations using the MTT Assay. By STRING analysis, interactions within the enzymes of the hyaluronic acid system and with binding partners were visualized.
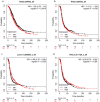
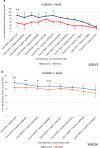
Results: HAS1, HYAL1 and HYAL4 mRNA expression is significantly upregulated, whereas HAS2, HYAL2 and HYAL3 mRNA expression is significantly downregulated in ovarian cancer tissue compared to controls. HAS2 improves cell viability, the capability to form tumour spheroids and has a negative prognostic value regarding overall survival. Lower HAS2 expression and high expression of HYAL2 and HYAL3 favours the survival of ovarian cancer patients. HAS2 knockdown cells and control cells showed a moderate response to combinatorial in vitro chemotherapy with taxol and cisplatin.
Conclusion: In conclusion, our study shows that the hyaluronic acid system has a relevant influence on the survival of ovarian cancer patients and could therefore be considered as a possible prognostic factor.
Keywords: Gene expression; HAS2; Hyaluronan synthases; Hyaluronidases; Ovarian cancer; Survival analysis.
© 2022. The Author(s).
Conflict of interest statement
The authors have no relevant financial or non-financial interests to disclose.
Figures


Similar articles
-
Expression of hyaluronan synthases (HAS1-3) and hyaluronidases (HYAL1-2) in serous ovarian carcinomas: inverse correlation between HYAL1 and hyaluronan content.BMC Cancer. 2009 May 12;9:143. doi: 10.1186/1471-2407-9-143. BMC Cancer. 2009. PMID: 19435493 Free PMC article.
-
Hyaluronan synthase and hyaluronidase expression in serous ovarian carcinoma is related to anatomic site and chemotherapy exposure.Int J Mol Sci. 2012 Oct 10;13(10):12925-38. doi: 10.3390/ijms131012925. Int J Mol Sci. 2012. PMID: 23202930 Free PMC article.
-
Hyaluronan synthases (HAS1-3) and hyaluronidases (HYAL1-2) in the accumulation of hyaluronan in endometrioid endometrial carcinoma.BMC Cancer. 2010 Sep 27;10:512. doi: 10.1186/1471-2407-10-512. BMC Cancer. 2010. PMID: 20875124 Free PMC article.
-
Biology of hyaluronan: Insights from genetic disorders of hyaluronan metabolism.World J Biol Chem. 2015 Aug 26;6(3):110-20. doi: 10.4331/wjbc.v6.i3.110. World J Biol Chem. 2015. PMID: 26322170 Free PMC article. Review.
-
Genetic Deficiencies of Hyaluronan Degradation.Cells. 2024 Jul 16;13(14):1203. doi: 10.3390/cells13141203. Cells. 2024. PMID: 39056785 Free PMC article. Review.
Cited by
-
Role of Hyaluronic Acid in Selected Malignant Neoplasms in Women.Biomedicines. 2023 Jan 21;11(2):304. doi: 10.3390/biomedicines11020304. Biomedicines. 2023. PMID: 36830841 Free PMC article. Review.
-
Twenty-five years of WWOX insight in cancer: a treasure trove of knowledge.Funct Integr Genomics. 2025 May 6;25(1):100. doi: 10.1007/s10142-025-01601-5. Funct Integr Genomics. 2025. PMID: 40327201 Free PMC article. Review.
-
Exploring the Potentials of Hyaluronic Acid-coated Polymeric Nanoparticles in Enhanced Cancer Treatment by Precision Drug Delivery, Tackling Drug Resistance, and Reshaping the Tumour Micro Environment.Curr Med Chem. 2025;32(20):3960-3999. doi: 10.2174/0109298673302510240328050115. Curr Med Chem. 2025. PMID: 38571347 Review.
-
Targeting BET Proteins Decreases Hyaluronidase-1 in Pancreatic Cancer.Cells. 2023 May 27;12(11):1490. doi: 10.3390/cells12111490. Cells. 2023. PMID: 37296612 Free PMC article.
-
Effects of Hyaluronan on Breast Cancer Aggressiveness.Cancers (Basel). 2023 Jul 27;15(15):3813. doi: 10.3390/cancers15153813. Cancers (Basel). 2023. PMID: 37568628 Free PMC article. Review.
References
-
- Abate A, Dimartino V, Spina P, Costa PL, Lombardo C, Santini A, Del Piano M, Alimonti P (2001) Hymecromone in the treatment of motor disorders of the bile ducts: a multicenter, double-blind, placebo-controlled clinical study. Drugs Exp Clin Res 27(5–6):223–231 - PubMed
-
- Anttila MA et al (2000) High levels of stromal hyaluronan predict poor disease outcome in epithelial ovarian Cancer. Cancer Res 60(1):150–155 - PubMed
-
- Bartha Á, Győrffy B (2021) TNMplot.com: a web tool for the comparison of gene expression in normal, tumor and metastatic tissues. Int J Mol Sci 22(5):2622. 10.3390/ijms22052622 - PMC - PubMed
-
- Bourguignon LYW et al (2001) Hyaluronan promotes CD44v3-Vav2 interaction with Grb2-p185HER2 and induces Rac1 and Ras signaling during ovarian tumor cell migration and growth. J Biol Chem 276(52):48679–48692. 10.1074/jbc.M106759200 - PubMed
MeSH terms
Substances
Grants and funding
LinkOut - more resources
Full Text Sources
Medical

