. 2022 Sep 1;128(17):3254-3264.
doi: 10.1002/cncr.34333. Epub 2022 Jun 29.

Prognostic attributes of immune signatures in soft tissue sarcomas show differential dependencies on tumor mutational burden

Affiliations

Prognostic attributes of immune signatures in soft tissue sarcomas show differential dependencies on tumor mutational burden

Shailaja K S Raj et al. Cancer. .

Abstract

Background: Cellular and intrinsic markers of sarcoma immunogenicity are poorly understood. To gain insight into whether tumor-immune interactions correlate with clinical aggressiveness, the authors examined the prognostic significance of immune gene signatures in combination with tumor mutational burden (TMB) and cancer-testis antigen (CTA) expression.

Methods: RNA sequencing and clinical data of 259 soft tissue sarcomas from The Cancer Genome Atlas project were used to investigate associations between published immune gene signatures and patient overall survival (OS) in the contexts of TMB, as computed from whole-exome sequencing data, and CTA gene expression. Multivariate Cox proportional hazards regression models and log-rank tests were used to assess survival associations.

Results: Immune signature scores that reflected in part the intratumoral abundance of cytotoxic T cells showed significant positive associations with OS. However, the prognostic power of the T-cell signatures was highly dependent on TMB-high status, consistent with protective effects of tumor-infiltrating T cells in tumors with elevated antigenicity. In TMB-low tumors, a signature of infiltrating plasma B cells was significantly and positively associated with OS, independent of T-cell signature status. Although tumor subtypes based on differential expression patterns of CTA genes showed different survival associations within leiomyosarcoma and myxofibrosarcoma histologies, neither CTA nor histologic subtype interacted with the T-cell-survival association.

Conclusions: Signatures of T-cell and plasma B-cell infiltrates were associated with a survival benefit in soft tissue sarcomas. TMB, but not CTA expression, influenced the prognostic power of T-cell-associated, but not plasma B-cell-associated, survival.

Lay summary: Clinical data and RNA analysis of 259 soft tissue sarcomas from The Cancer Genome Atlas project were used to investigate associations between five published gene immune cell expression signatures and survival in the context of tumor mutations. Activated T cells had a significant positive association with patient survival. Although high tumor mutation burden was associated with good survival, the prognostic power of T-cell signatures was highly dependent on tumor mutational status, consistent with protective effects of tumor-infiltrating T cells in tumors with high levels of antigens. In low tumor mutation-bearing tumors, plasma B cells were positively associated with survival.

Keywords: burden; immune; mutational; prognosis; signatures; tumor.


Conflict of interest statement

The authors made no disclosures.

Figures

FIGURE 1
FIGURE 1
Correlative and prognostic attributes of T‐cell signatures in soft tissue sarcomas. (A) Reported T‐cell–related gene expression signatures and the genes that comprise them. (B) Correlation matrix heatmap based on Spearman analysis of expression signature scores in The Cancer Genome Atlas data set. Scores were computed for each tumor (n = 259) from the geometric mean of the signature gene expression values. (C) Plot of T‐cell signature results from multivariate Cox regression models. Shown for each signature are hazard ratios (HRs) plotted against Wald test‐negative log p values (−LogP). CD8 + T indicates CD8‐positive T‐cells; CYT, cells with immune cytolytic activity; T/NK, T‐cells/natural killer cells; T‐eff, effector T cells; Th1, type 1 T‐helper cells.
FIGURE 2
FIGURE 2
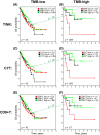
T‐cell signature tertiles are prognostic in tumor mutational burden (TMB)‐high tumors but not in TMB‐low tumors. T‐cell signature scores were used to partition patients from The Cancer Genome Atlas cohort into signature tertiles for Kaplan–Meier analyses. Results for the T‐cell/natural killer cell (T/NK), cells with immune cytolytic activity (CYT), and CD8‐positive T‐cell (CD8 + T) signatures are shown. Overall survival (OS) rates are compared among patients classified in the full cohort with low (red), intermediate (int; black), and high (green) signature tertiles in the context of (A,C,E) TMB‐low tumors and (B,D,F) TMB‐high tumors. Log‐rank p values are shown for each plot (black) and for comparisons of signature‐high tertiles between TMB‐low and TMB‐high strata (green).
FIGURE 3
FIGURE 3
Analysis of T‐cell signature scores, sarcoma histology, and survival associations. (A) Heatmap of The Cancer Genome Atlas (TCGA) cohort tumor expression profiles (columns) and T‐cell/natural killer cell (T/NK) signature genes (rows) with cases stratified (from left to right) by T/NK score. Annotations for TCGA histologic type, overall survival (OS) outcome, and mutation rate status are indicated in the top three rows. (B) Comparison of T/NK signature score distributions among histologic types and tumor mutational burden (TMB) status groups. Statistical comparisons were made between individual histologic groups and the whole cohort (All; n = 259 cases). TMB‐low was compared with TMB‐high (two asterisks indicate p < .01; three asterisks, p < .001). (C) Kaplan–Meier analysis of patient OS by histologic type. (D) Kaplan–Meier analysis of patient OS by TMB status (low vs. high). Log‐rank test p values are shown. Des indicates desmoid tumor; DL, dedifferentiated liposarcoma; LMS, leiomyosarcoma; MPNST, malignant peripheral nerve sheath tumor; Myx, myxofibrosarcoma; NA, not available; Syn, synovial sarcoma; UPS, undifferentiated pleomorphic sarcoma.
FIGURE 4
FIGURE 4
Prognostic significance of a B‐cell signature in the The Cancer Genome Atlas (TCGA) sarcoma database (SARC). (A) Genes comprising the previously described B‐cell/plasma cell (B/P) signature are shown. (B) Heatmap of the TCGA cohort tumor expression profiles (columns) and B/P signature genes (rows) with cases stratified (from left to right) by B/P signature score. Annotations for TCGA histologic type, overall survival outcome, mutation rate status, and T‐cell/natural killer cell (T/NK) score are indicated in the top four rows. Survival rates of patients in the TCGA cohort stratified into B/P score low, intermediate (int), and high tertile groups were analyzed by Kaplan–Meier analysis in (C) cases with low TMB, (D) cases with high TMB, (E) cases with low TMB and low T/NK tertile scores, and (F) cases with high TMB and high‐to‐intermediate T/NK tertile scores. Log‐rank test p values are shown. Des indicates desmoid tumor; DL, dedifferentiated liposarcoma; LMS, leiomyosarcoma; MPNST, malignant peripheral nerve sheath tumor; Myx, myxofibrosarcoma; NA, not available; Syn, synovial sarcoma; UPS, undifferentiated pleomorphic sarcoma.
FIGURE 5
FIGURE 5
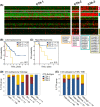
Analysis of cancer–testis antigen (CTA) molecular subtypes as a function of histologic type, T‐cell/natural killer cell (T/NK) tertile, and tumor mutational burden (TMB) status. (A) CTA gene expression profiles in The Cancer Genome Atlas (TCGA) cohort were used to identify sarcoma CTA molecular subtypes (CTA‐1, CTA‐2, and CTA‐3) by k‐means clustering. Genes that contributed most to subtype differentiation are indicated in colored boxes. Kaplan–Meier plots and log‐rank p values comparing overall survival rates among TCGA CTA subtypes are shown for (B) leiomyosarcoma and (C) myxofibrosarcoma histologies, in which significant differences were observed. Relative proportions of cases representing the three CTA subtypes are shown by (D) histologic type and (E) T/NK or TMB strata. Des indicates desmoid tumor; DL, dedifferentiated liposarcoma; LMS, leiomyosarcoma; MPNST, malignant peripheral nerve sheath tumor; Myx, myxofibrosarcoma; OS, overall survival; Syn, synovial sarcoma; UPS, undifferentiated pleomorphic sarcoma.

References

    1. Judson I, Verweij J, Gelderblom H, et al. Doxorubicin alone versus intensified doxorubicin plus ifosfamide for first‐line treatment of advanced or metastatic soft‐tissue sarcoma: a randomised controlled phase 3 trial. Lancet Oncol. 2014;15(4):415‐423. - PubMed
    1. Ryan CW, Merimsky O, Agulnik M, et al. PICASSO III: a phase III, placebo‐controlled study of doxorubicin with or without palifosfamide in patients with metastatic soft tissue sarcoma. J Clin Oncol. 2016;34:3898‐3905. - PubMed
    1. Tap WD, Jones RL, Van Tine BA, et al. Olaratumab and doxorubicin versus doxorubicin alone for treatment of soft‐tissue sarcoma: an open‐label phase 1b and randomised phase 2 trial. Lancet. 2016;388:488‐497. - PMC - PubMed
    1. Tsung K, Norton JA. Lessons from Coley's Toxin. Surg Oncol. 2006;15:25‐28. - PubMed
    1. Maki RG, Jungbluth AA, Gnjatic S, Schwartz GK, D’Adamo DR, Keohan ML, Wagner MJ, Scheu K, Chiu R, Ritter E, Kachel J, Lowy I, Old LJ, Ritter G A pilot study of anti‐CTLA4 antibody ipilimumab in patients with synovial sarcoma. Sarcoma 2013;2013:168145, 1, 8. - PMC - PubMed

Publication types

Substances