. 2022 Sep 15;33(11):br18.
doi: 10.1091/mbc.E22-05-0150. Epub 2022 Jun 29.

Intracellular connections between basal bodies promote the coordinated behavior of motile cilia

Affiliations

Intracellular connections between basal bodies promote the coordinated behavior of motile cilia

Adam W J Soh et al. Mol Biol Cell. .

Abstract

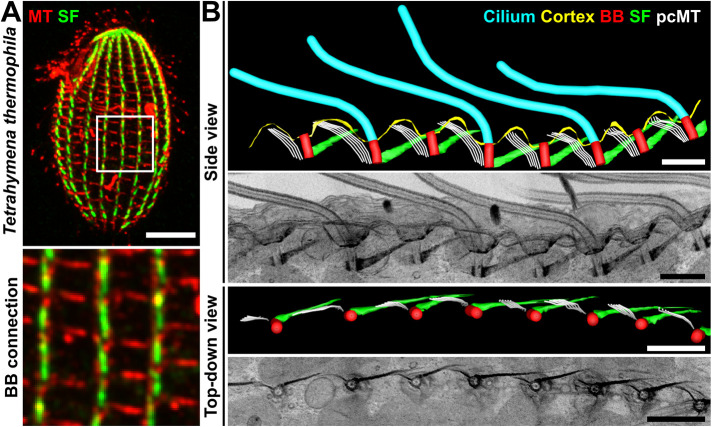
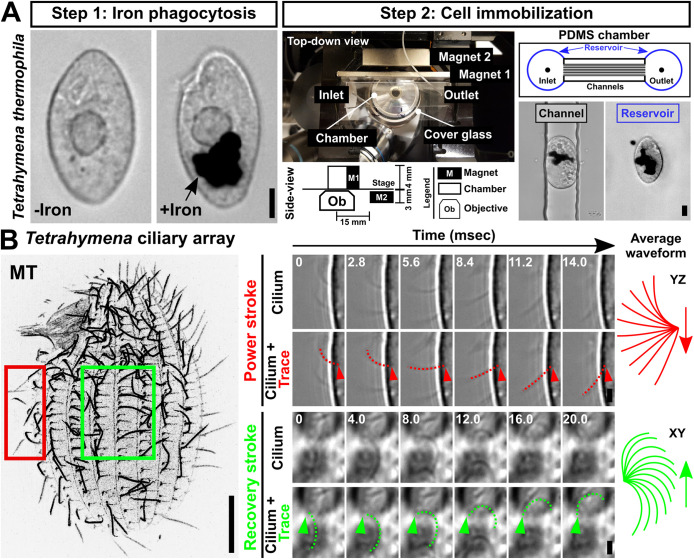
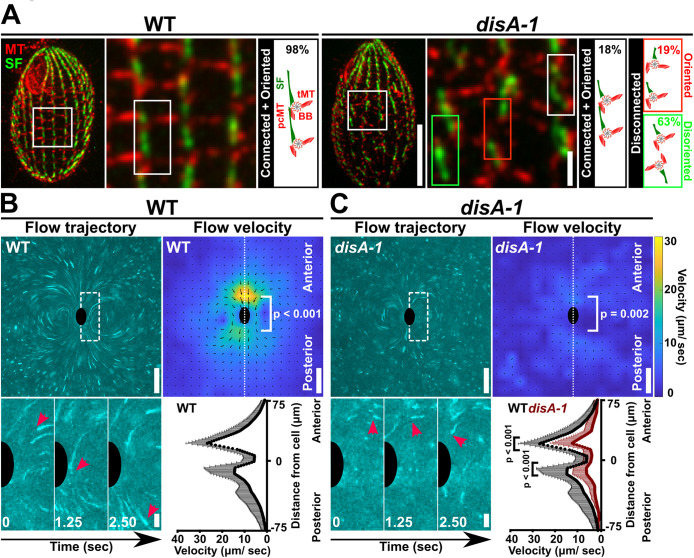
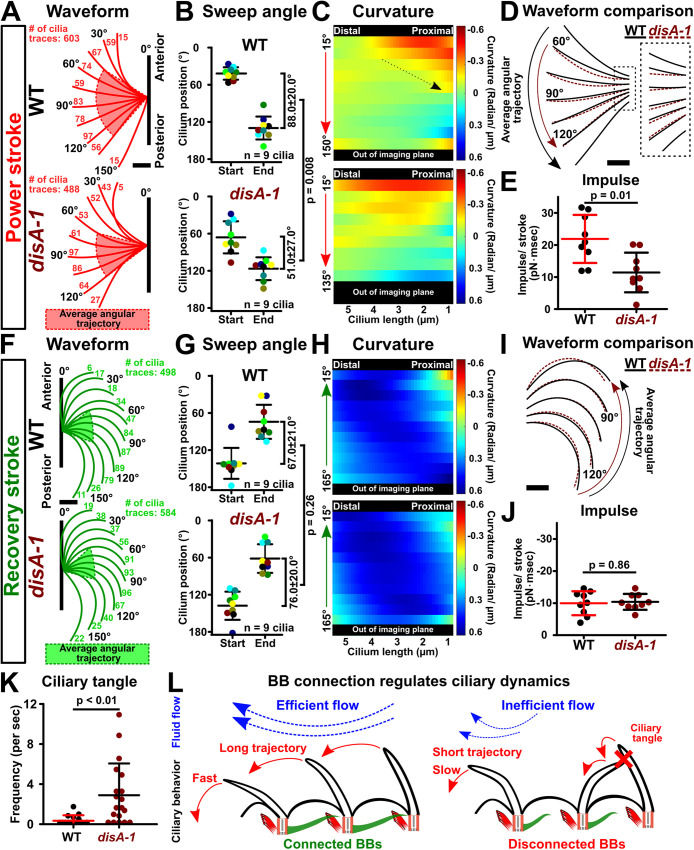
Hydrodynamic flow produced by multiciliated cells is critical for fluid circulation and cell motility. Hundreds of cilia beat with metachronal synchrony for fluid flow. Cilia-driven fluid flow produces extracellular hydrodynamic forces that cause neighboring cilia to beat in a synchronized manner. However, hydrodynamic coupling between neighboring cilia is not the sole mechanism that drives cilia synchrony. Cilia are nucleated by basal bodies (BBs) that link to each other and to the cell's cortex via BB-associated appendages. The intracellular BB and cortical network is hypothesized to synchronize ciliary beating by transmitting cilia coordination cues. The extent of intracellular ciliary connections and the nature of these stimuli remain unclear. Moreover, how BB connections influence the dynamics of individual cilia has not been established. We show by focused ion beam scanning electron microscopy imaging that cilia are coupled both longitudinally and laterally in the ciliate Tetrahymena thermophila by the underlying BB and cortical cytoskeletal network. To visualize the behavior of individual cilia in live, immobilized Tetrahymena cells, we developed Delivered Iron Particle Ubiety Live Light (DIPULL) microscopy. Quantitative and computer analyses of ciliary dynamics reveal that BB connections control ciliary waveform and coordinate ciliary beating. Loss of BB connections reduces cilia-dependent fluid flow forces.


Figures

FIGURE 1:
FIGURE 1:
Cilia are intracellularly coupled by BBs. (A) Immunofluorescent image depicting a Tetrahymena cell. Bottom panel: Inset (white box) illustrating top-down views of the BB network. Microtubule (MT), red; SF, green. Scale bar, 10 µm. Inset width, 11.0 µm. (B) FIB-SEM (two-dimensional projection) and model images showing the intracellularly coupled ciliary array of a Tetrahymena cell. Cilia, cyan; cortex, yellow; BB, red; SF, green; Postciliary microtubule (pcMT), white. Scale bars, 1 µm.
FIGURE 2:
FIGURE 2:
Tetrahymena live cell immobilization technique. (A) DIPULL microscopy setup. Step 1: Tetrahymena cells are fed iron particles. Cell images pre- and post–iron engulfment. Step 2: Cells are introduced into a microfluidic chamber and immobilized via a constant external magnetic field. To track intracellular dynamics, imaging was performed on cells that were trapped within channels (black outline). The visualization of extracellular dynamics was performed on cells that are trapped within the chamber reservoir (blue outline). Scale bars, 10 µm. (B) Visualization of ciliary dynamics via DIPULL-immobilized live Tetrahymena cells. Left panel: Tetrahymena ciliary array. Bar, 10 µm. Right panel: Time-lapse images of power and recovery strokes. Time intervals (ms) are indicated. Dotted lines mark manual cilia traces. Average power stroke, red; average recovery stroke, green. Scale bars, 2 µm.
FIGURE 3:
FIGURE 3:
BB connections and orientation are required for cilia-dependent fluid flow. (A) Fluorescent images depicting the cortical organization of WT and disA-1 cells at 25°C. Most disA-1 cells display BB disconnection (82%). Disconnected disA-1 bodies are either oriented (19% of total) or disoriented (63% of total). Microtubule (MT), red; SF, green. Scale bars, 10 and 2 µm. (B) BB connections are required for normal fluid flow movements and velocity at 25°C. Fluid flow is assessed by tracking fluorescent beads in media. Fluid flow trajectories are depicted as time-projected images over 2.5 s (100 frames). Inset (white box with dashed line) illustrates the movement of a fluorescent bead (red arrowheads) relative to the cell (black half oval). Fluid flow velocity is represented as heatmaps. Cooler colors indicate slower fluid flow, while warmer colors indicate faster fluid flow. The predicted cell position is marked by a black oval. (C) disA-1 disrupts fluid flow velocity at 25°C. Inset (white box with dashed line) illustrates the movement of a fluorescent bead (red arrowheads) relative to the cell (black half oval). WT (black line): n = 9 cells. disA-1 (brown line): n = 13 cells. Mann–Whitney test. Mean ± SD. Scale bars, 50 µm (full field of view) and 10 µm (inset).
FIGURE 4:
FIGURE 4:
Loss of BB connections does not inhibit ciliary beat frequency. (A) Schematic image depicting ciliary beat frequency quantification using kymograph analysis. The X-axis represents time (total duration: 105 ms). The Y-axis represents distance. Scale bar, 2 µm. (B) Kymographs of WT and disA-1 cilia. disA-1 cilia display variable ciliary trajectories between ciliary beat cycles (red arrowheads). Scale bar, 2 µm. (C) Quantification of WT and disA-1 ciliary beat frequency of individual cilia. Three cilia per cell were sampled. disA-1 cilia exhibit ciliary beat frequencies comparable to those of WT cilia. WT: n = 28 cells (84 cilia). disA-1: n = 38 cells (72 oriented cilia; 41 disoriented cilia). Mann–Whitney test. Mean ± SD. (D) Duration of power and recovery strokes of WT and disA-1 cilia. WT: n = 11 cells (25 cilia). disA-1: n = 13 cells (32 cilia). Mann–Whitney test. F test for variance comparison. Mean ± SD. (E) Schematic illustrating comparable average durations of ciliary beat cycle for WT and disA-1 cilia. disA-1 cilia beat at a ciliary beat frequency comparable to that of WT cilia with a longer power stroke duration and a shorter recovery stroke duration.
FIGURE 5:
FIGURE 5:
BB connections support ciliary waveform and coordination. (A) Tetrahymena power stroke waveform. Top panel: Average WT power stroke waveform. Bottom panel: Average disA-1 power stroke waveform. Red highlight indicates the average angular trajectory (n = 9 cilia). Cilium position is defined by the angle from the cilium distal end (4.5 µm up from the cilium base) relative to the cell’s AP axis. Angles are categorized into 15° bins. Each angular bin contains at least 1% of all ciliary traces per condition. The number of cilia traces for each bin is indicated. (B) Angular trajectories of WT and disA-1 cilia during the power stroke. disA-1 cilia undergo shorter trajectories than WT cilia. Each cilium in the analysis is color coded. (C) Curvature heatmaps of WT and disA-1 cilia through the power stroke (blue: the cilium bends toward the cell anterior pole; red: the cilium bends away from the cell anterior pole; green: straight cilium). The Y-axis marks the cilium position through the power stroke. Dotted arrow indicates the change in WT cilium curvature at the start to middle of the power stroke. WT power stroke: n = 603 cilia traces (nine cilia, six ciliary beat cycles each, nine cells). disA-1 power stroke: n = 488 cilia traces (nine cilia, six ciliary beat cycles each, nine cells). (D) Superimposed WT (black lines) and disA-1 (brown dashed lines) average power stroke waveform. Curvature differences are depicted only for stages of the power stroke that fall within the average angular trajectories of WT and disA-1 cilia. (E) Ciliary power stroke impulses were estimated using RFT. WT cilia exert greater impulse (area under the force-time curve) than disA-1 cilia along the AP axis per power stroke (n = 9 cilia). (F) Tetrahymena recovery stroke waveform. Top panel: Average WT recovery stroke waveform. Bottom panel: Average disA-1 recovery stroke waveform. Green highlight indicates the average angular trajectory (n = 9 cilia). Cilium position is defined by the angle from the cilium distal end (4.5 µm up from the cilium base) relative to the cilium’s power stroke axis. Angles are categorized into 15° bins. Each angular bin is at least 1% of all ciliary traces per condition. The number of cilia traces for each bin is indicated. (G) Angular trajectories of WT and disA-1 cilia. Each cilium in the analysis is color coded. disA-1 cilia undergo trajectories comparable to those of WT cilia during the recovery stroke. (H) Curvature heatmaps of WT and disA-1 cilia through the recovery stroke (blue: the cilium bends toward the cell anterior pole; red: the cilium bends away from the cell anterior pole; green: straight cilium). The Y-axis marks the cilium position through the recovery stroke. WT recovery stroke: n = 498 cilia traces (nine cilia, six ciliary beat cycles each, nine cells). disA-1 recovery stroke: n = 584 cilia traces (nine cilia, six ciliary beat cycles each, nine cells). (I) Superimposed WT (black lines) and disA-1 (brown dashed lines) average recovery stroke waveform. Curvature differences are depicted only for stages of the recovery stroke that fall within the average angular trajectories of WT and disA-1 cilia. (J) Ciliary recovery stroke impulses were estimated using RFT. WT and disA-1 cilia exert comparable impulses (area under the force-time curve) along the AP axis per recovery stroke (n = 9 cilia). (K) Frequency of ciliary tangles. WT: n = 11 cells (14 cilia pairs); disA-1: n = 13 cells (19 cilia pairs). (L) Schematic illustrates the model that BB connections promote fast and long power stroke trajectories for coordinated ciliary beating and effective fluid flow propulsion. Scale bars, 1 µm.

References

    1. Allen RD (1967). Fine structure, reconstruction and possible functions of components of the cortex of Tetrahymena pyriformis. J Protozool 14, 553–565. - PubMed
    1. Aufderheide KJ (1986). Identification of the basal bodies and kinetodesmal fibers in living cells of Paramecium tetraurelia Sonneborn, 1975 and Paramecium sonneborni Aufderheide, Daggett & Nerad, 1983. J Protozool 33, 77–80. - PubMed
    1. Baena V, Conrad R, Friday P, Fitzgerald E, Kim T, Bernbaum J, Berensmann H, Harned A, Nagashima K, Narayan K (2021). FIB-SEM as a volume electron microscopy approach to study cellular architectures in SARS-CoV-2 and other viral infections: a practical primer for a virologist. Viruses 13, 611. - PMC - PubMed
    1. Bascom CS Jr, Wu S-Z, Nelson K, Oakey J, Bezanilla M (2016). Long-term growth of moss in microfluidic devices enables subcellular studies in development. Plant Physiol 172, 28–37. - PMC - PubMed
    1. Bayly PV, Lewis BL, Ranz EC, Okamoto RJ, Pless RB, Dutcher SK (2011). Propulsive forces on the flagellum during locomotion of Chlamydomonas reinhardtii. Biophys J 100, 2716–2725. - PMC - PubMed

Publication types

LinkOut - more resources