. 2022 Jul 12;94(27):9540-9547.
doi: 10.1021/acs.analchem.1c04382. Epub 2022 Jun 29.

Internal Standard Triggered-Parallel Reaction Monitoring Mass Spectrometry Enables Multiplexed Quantification of Candidate Biomarkers in Plasma

Affiliations

Internal Standard Triggered-Parallel Reaction Monitoring Mass Spectrometry Enables Multiplexed Quantification of Candidate Biomarkers in Plasma

Jacob J Kennedy et al. Anal Chem. .

Abstract

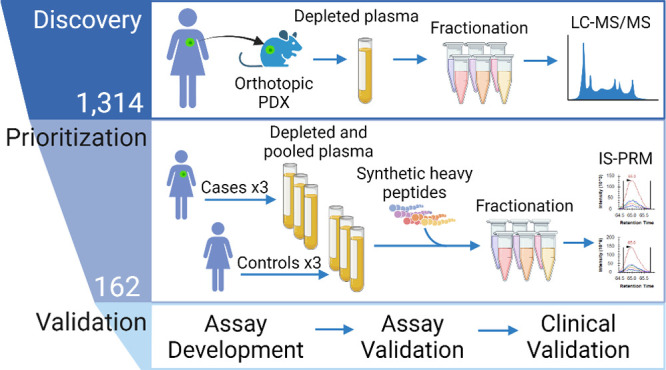
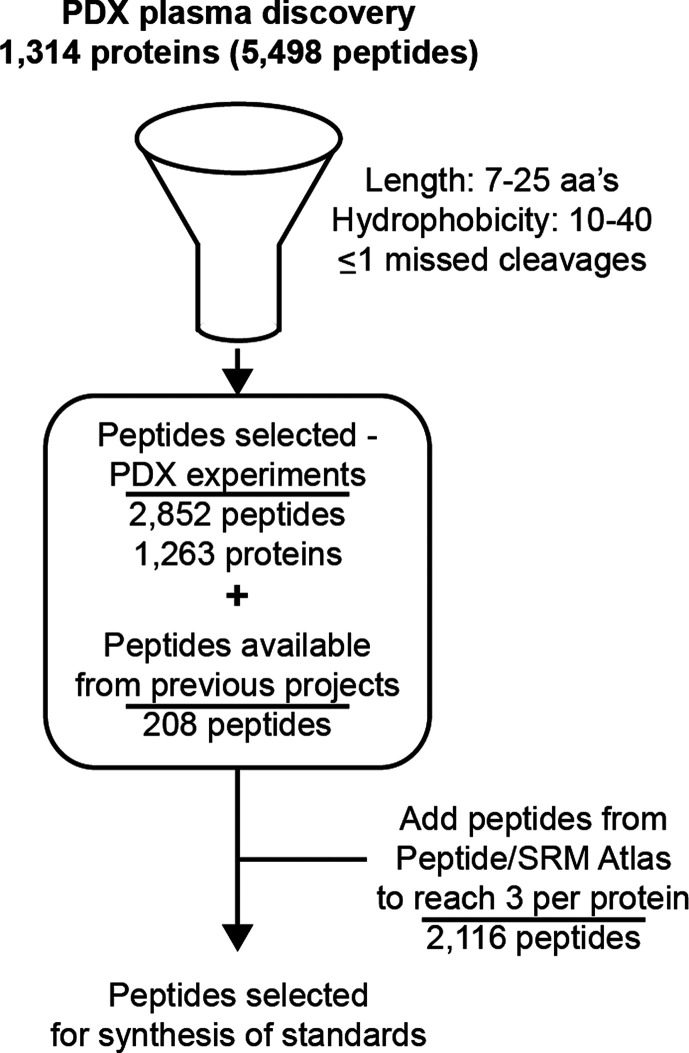
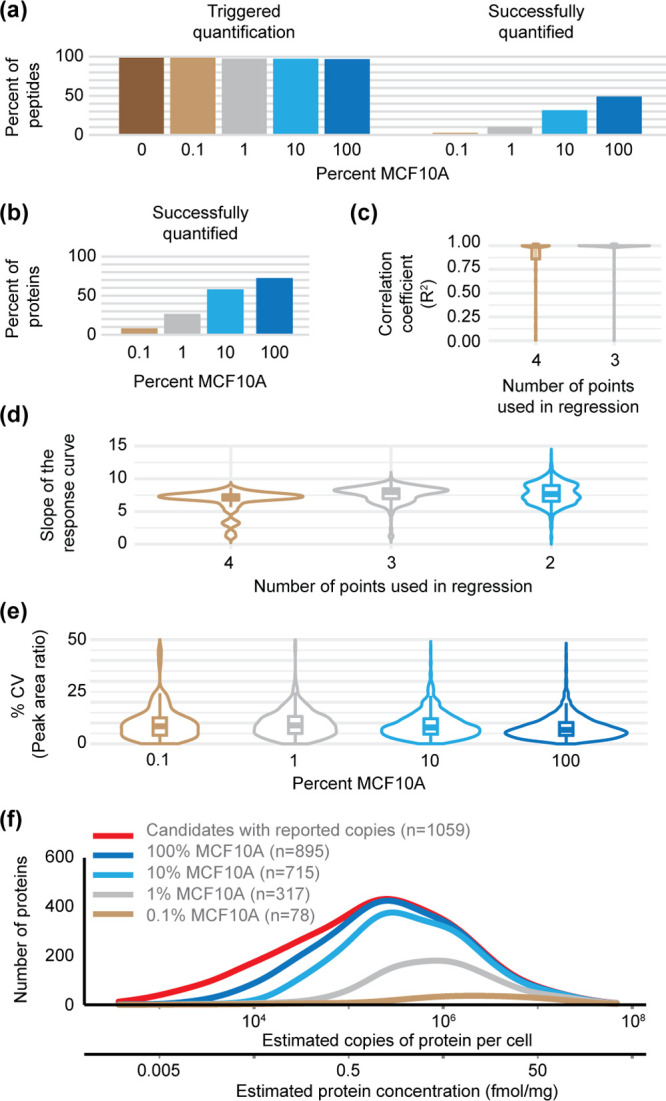
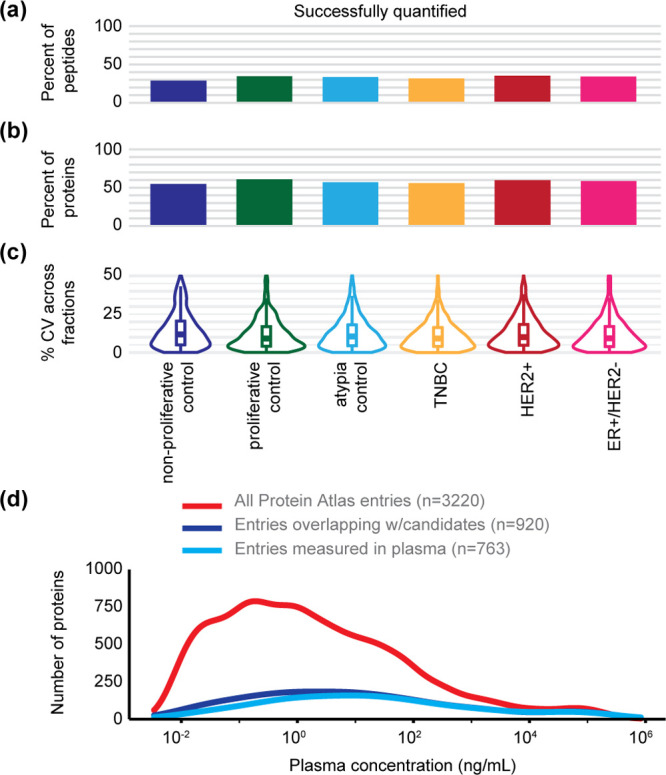
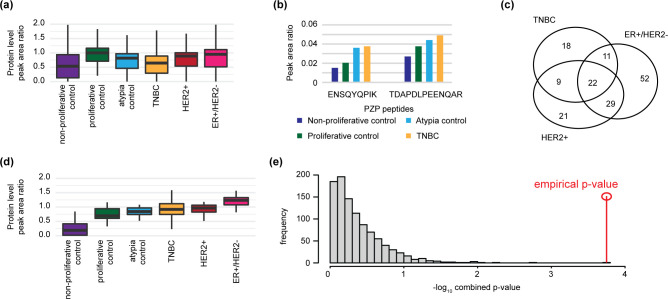
Despite advances in proteomic technologies, clinical translation of plasma biomarkers remains low, partly due to a major bottleneck between the discovery of candidate biomarkers and costly clinical validation studies. Due to a dearth of multiplexable assays, generally only a few candidate biomarkers are tested, and the validation success rate is accordingly low. Previously, mass spectrometry-based approaches have been used to fill this gap but feature poor quantitative performance and were generally limited to hundreds of proteins. Here, we demonstrate the capability of an internal standard triggered-parallel reaction monitoring (IS-PRM) assay to greatly expand the numbers of candidates that can be tested with improved quantitative performance. The assay couples immunodepletion and fractionation with IS-PRM and was developed and implemented in human plasma to quantify 5176 peptides representing 1314 breast cancer biomarker candidates. Characterization of the IS-PRM assay demonstrated the precision (median % CV of 7.7%), linearity (median R2 > 0.999 over 4 orders of magnitude), and sensitivity (median LLOQ < 1 fmol, approximately) to enable rank-ordering of candidate biomarkers for validation studies. Using three plasma pools from breast cancer patients and three control pools, 893 proteins were quantified, of which 162 candidate biomarkers were verified in at least one of the cancer pools and 22 were verified in all three cancer pools. The assay greatly expands capabilities for quantification of large numbers of proteins and is well suited for prioritization of viable candidate biomarkers.


Conflict of interest statement

The authors declare no competing financial interest.

Figures

Figure 1
Figure 1
Targeted IS-PRM assay for prioritization of breast cancer biomarkers for validation studies. A candidate list of protein biomarkers was derived from profiling depleted plasma from mice harboring patient-derived xenografts (PDX) of human breast cancer or normal breast tissue to identify human proteins secreted or shed from tumors. Plasma samples from 23 PDX-bearing mice were depleted, pooled, proteolytically digested, fractionated, and profiled by LC-MS/MS, which identified 1314 unique human proteins across the three independent profiles. Because validation of the candidate biomarkers is resource intensive, we sought to use quantitative IS-PRM to prioritize candidate biomarkers showing differential expression in pooled plasma samples from women diagnosed with breast cancer vs women diagnosed with benign breast lesions.
Figure 2
Figure 2
Summary of peptide selection for targeted proteomics. Peptides were selected from three sources to obtain at least three peptides per protein: (i) those directly observed in the PDX discovery experiments, (ii) peptides available in-house from previous projects, and (iii) peptides from the online databases Peptide Atlas (http://www.peptideatlas.org/) and SRMAtlas (http://www.srmatlas.org/). For selection, peptides had to be between 7 and 25 amino acids in length, have a hydrophobicity score between 10 and 40, and have no more than one missed cleavage. A total of 1303 of the candidate biomarkers are represented by three or more peptides per protein; proteins with less than three peptides were keratins and IgGs.
Figure 3
Figure 3
Characterization of the IS-PRM analytical performance. (a) Percent of peptides that triggered quantification (heavy peptides meeting the detection threshold and fragment ion requirement) and were successfully quantified (endogenous peptides meeting all quantification criteria with signal >2× the maximum signal in the blanks). (b) Percentage of the 1314 targeted proteins that were quantified. (c) Distribution of the correlation coefficients squared (R2) for quantified peptides using the top three (100, 10, and 1% MCF10A) or all four concentration points of the curve. (d) Distribution of slopes for peptides successfully quantified using the top two, three, or all four concentration points. (e) Precision of the replicates of heavy to light peak area ratios for each dilution point. For violin plots, the bold line shows median, box shows inner quartile, vertical line shows 5–95 percentile, density of measurements is indicated by the thin line. (f) Distribution of the number of proteins detected according to the protein level per cell (as reported in Ly et al.).
Figure 4
Figure 4
Applying the IS-PRM assay to prioritize the biomarker candidate proteins in plasma of human breast cancer patients. (a) Percent of endogenous light signals meeting quantification criteria with a signal >2× the maximum signal in the blanks in each of the plasma pools. (b) Percent of candidate protein biomarkers with endogenous levels measured in each of the plasma pools. (c) Violin box plot showing the technical variability of the replicate measurements of the heavy to light peak area ratios (PAR), measured by using the PAR in neighboring bRP fractions as technical replicates. Bold line shows median, box shows inner quartile, vertical line shows 5–95 percentile, density of measurements is indicated by the thin line. (d) Distribution of the number of proteins detected according to reported plasma concentration.
Figure 5
Figure 5
Verification of candidate biomarkers in the breast cancer plasma pools. (a) Endogenous levels in the depleted and fractionated plasma pools, reported as the peak area ratio (PAR; light/heavy) using the median value from multiple measurements of peptides. (b) PAR of quantified peptides from PZP in three control pools and triple negative breast cancer (TNBC). An example of a candidate biomarker meeting significance testing in the TNBC breast cancer subtype with endogenous levels significantly higher (p < 0.001) in cancer compared to at least two of the three confounding control plasma pools with a significant regression trend (p < 0.01; trend comparing nonproliferative control → proliferative control → atypia control → cancer subtype). (c) Venn diagram of the 162 candidate biomarkers verified in the pooled case/control study. A total of 22 of the candidates passed both cutoffs (p-value < 0.001 and regression trend p-value < 0.1) in all three breast cancer subtypes. (d) Endogenous levels of the 22 proteins found higher in all three breast cancer subtypes compared to the three confounding control samples. For box plots, bold line shows median, box shows inner quartile, vertical line shows 5–95 percentile. (e) Combined p-value from differentiation between cancer subtypes and control plasma pools using randomly sampled subsets of 22 proteins (1000 permutations). The p-value for the set of overlapping 22 proteins verified by IS-PRM assay (p = 0.00016) is shown by the red line. p-Values are based on a student t test.

References

    1. Bhawal R.; Oberg A. L.; Zhang S.; Kohli M. Challenges and Opportunities in Clinical Applications of Blood-Based Proteomics in Cancer. Cancers (Basel) 2020, 12 (9), 2428.10.3390/cancers12092428. - DOI - PMC - PubMed
    1. Landegren U.; Hammond M. Cancer diagnostics based on plasma protein biomarkers: hard times but great expectations. Mol. Oncol 2021, 15 (6), 1715–1726. 10.1002/1878-0261.12809. - DOI - PMC - PubMed
    1. Keshishian H.; Burgess M. W.; Specht H.; Wallace L.; Clauser K. R.; Gillette M. A.; Carr S. A. Quantitative, multiplexed workflow for deep analysis of human blood plasma and biomarker discovery by mass spectrometry. Nat. Protoc 2017, 12 (8), 1683–1701. 10.1038/nprot.2017.054. - DOI - PMC - PubMed
    1. Omenn G. S.; et al. Overview of the HUPO Plasma Proteome Project: results from the pilot phase with 35 collaborating laboratories and multiple analytical groups, generating a core dataset of 3020 proteins and a publicly-available database. Proteomics 2005, 5 (13), 3226–45. 10.1002/pmic.200500358. - DOI - PubMed
    1. Geyer P. E.; Holdt L. M.; Teupser D.; Mann M. Revisiting biomarker discovery by plasma proteomics. Mol. Syst. Biol. 2017, 13 (9), 942.10.15252/msb.20156297. - DOI - PMC - PubMed

Publication types