Keystroke-Dynamics for Parkinson's Disease Signs Detection in an At-Home Uncontrolled Population: A New Benchmark and Method
- PMID: 35767495
- PMCID: PMC9904385
- DOI: 10.1109/TBME.2022.3187309
Keystroke-Dynamics for Parkinson's Disease Signs Detection in an At-Home Uncontrolled Population: A New Benchmark and Method
Abstract
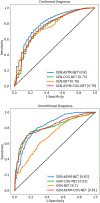
Parkinson's disease (PD) is the second most prevalent neurodegenerative disease disorder in the world. A prompt diagnosis would enable clinical trials for disease-modifying neuroprotective therapies. Recent research efforts have unveiled imaging and blood markers that have the potential to be used to identify PD patients promptly, however, the idiopathic nature of PD makes these tests very hard to scale to the general population. To this end, we need an easily deployable tool that would enable screening for PD signs in the general population. In this work, we propose a new set of features based on keystroke dynamics, i.e., the time required to press and release keyboard keys during typing, and used to detect PD in an ecologically valid data acquisition setup at the subject's homes, without requiring any pre-defined task. We compare and contrast existing models presented in the literature and present a new model that combines a new type of keystroke dynamics signal representation using hold time and flight time series as a function of key types and asymmetry in the time series using a convolutional neural network. We show how this model achieves an Area Under the Receiving Operating Characteristic curve ranging from 0.80 to 0.83 on a dataset of subjects who actively interacted with their computers for at least 5 months and positively compares against other state-of-the-art approaches previously tested on keystroke dynamics data acquired with mechanical keyboards.
Figures


Similar articles
-
Detecting Motor Impairment in Early Parkinson's Disease via Natural Typing Interaction With Keyboards: Validation of the neuroQWERTY Approach in an Uncontrolled At-Home Setting.J Med Internet Res. 2018 Mar 26;20(3):e89. doi: 10.2196/jmir.9462. J Med Internet Res. 2018. PMID: 29581092 Free PMC article.
-
Early Parkinson's Disease Detection via Touchscreen Typing Analysis using Convolutional Neural Networks.Annu Int Conf IEEE Eng Med Biol Soc. 2019 Jul;2019:3535-3538. doi: 10.1109/EMBC.2019.8857211. Annu Int Conf IEEE Eng Med Biol Soc. 2019. PMID: 31946641
-
Diagnostic accuracy of keystroke dynamics as digital biomarkers for fine motor decline in neuropsychiatric disorders: a systematic review and meta-analysis.Sci Rep. 2022 May 11;12(1):7690. doi: 10.1038/s41598-022-11865-7. Sci Rep. 2022. PMID: 35546606 Free PMC article.
-
Pattern analysis of computer keystroke time series in healthy control and early-stage Parkinson's disease subjects using fuzzy recurrence and scalable recurrence network features.J Neurosci Methods. 2018 Sep 1;307:194-202. doi: 10.1016/j.jneumeth.2018.05.019. Epub 2018 May 30. J Neurosci Methods. 2018. PMID: 29859213
-
The Concept of Prodromal Parkinson's Disease.J Parkinsons Dis. 2015;5(4):681-97. doi: 10.3233/JPD-150685. J Parkinsons Dis. 2015. PMID: 26485429 Free PMC article. Review.
Cited by
-
Diagnosing Parkinson's disease via behavioral biometrics of keystroke dynamics.Sci Adv. 2025 Apr 4;11(14):eadt6631. doi: 10.1126/sciadv.adt6631. Epub 2025 Apr 4. Sci Adv. 2025. PMID: 40184462 Free PMC article.
-
Generalizing Parkinson's disease detection using keystroke dynamics: a self-supervised approach.J Am Med Inform Assoc. 2024 May 20;31(6):1239-1246. doi: 10.1093/jamia/ocae050. J Am Med Inform Assoc. 2024. PMID: 38497957 Free PMC article.
-
Keystroke Biometrics as a Tool for the Early Diagnosis and Clinical Assessment of Parkinson's Disease.Diagnostics (Basel). 2023 Sep 26;13(19):3061. doi: 10.3390/diagnostics13193061. Diagnostics (Basel). 2023. PMID: 37835803 Free PMC article.
-
Smartphone-derived Virtual Keyboard Dynamics Coupled with Accelerometer Data as a Window into Understanding Brain Health: Smartphone Keyboard and Accelerometer as Window into Brain Health.Proc SIGCHI Conf Hum Factor Comput Syst. 2023 Apr;2023:326. doi: 10.1145/3544548.3580906. Epub 2023 Apr 19. Proc SIGCHI Conf Hum Factor Comput Syst. 2023. PMID: 38115842 Free PMC article.
-
Modified SqueezeNet Architecture for Parkinson's Disease Detection Based on Keypress Data.Biomedicines. 2022 Oct 28;10(11):2746. doi: 10.3390/biomedicines10112746. Biomedicines. 2022. PMID: 36359266 Free PMC article.
References
-
- Paolini Paoletti F, Farotti L, and Parnetti L, “Progression of symptoms in Parkinson’s disease,” in Diagnosis and Management in Parkinson’s Disease, Elsevier, 2020, pp. 3–20. doi: 10.1016/B978-0-12-815946-0.00001-6. - DOI
-
- Haq NF, Cai J, Yu T, McKeown MJ, and Wang ZJ, “Parkinson’s Disease Detection from fMRI-Derived Brainstem Regional Functional Connectivity Networks,” in Medical Image Computing and Computer Assisted Intervention – MICCAI 2020, vol. 12267, Martel AL, Abolmaesumi P, Stoyanov D, Mateus D, Zuluaga MA, Zhou SK, Racoceanu D, and Joskowicz L, Eds. Cham: Springer International Publishing, 2020, pp. 33–43. doi: 10.1007/978-3-030-59728-3_4. - DOI
Publication types
MeSH terms
Grants and funding
LinkOut - more resources
Full Text Sources
Medical

