. 2022 Jun 29;18(6):e1010238.
doi: 10.1371/journal.pcbi.1010238. eCollection 2022 Jun.

Discovering molecular features of intrinsically disordered regions by using evolution for contrastive learning

Affiliations

Discovering molecular features of intrinsically disordered regions by using evolution for contrastive learning

Alex X Lu et al. PLoS Comput Biol. .

Abstract

A major challenge to the characterization of intrinsically disordered regions (IDRs), which are widespread in the proteome, but relatively poorly understood, is the identification of molecular features that mediate functions of these regions, such as short motifs, amino acid repeats and physicochemical properties. Here, we introduce a proteome-scale feature discovery approach for IDRs. Our approach, which we call "reverse homology", exploits the principle that important functional features are conserved over evolution. We use this as a contrastive learning signal for deep learning: given a set of homologous IDRs, the neural network has to correctly choose a held-out homolog from another set of IDRs sampled randomly from the proteome. We pair reverse homology with a simple architecture and standard interpretation techniques, and show that the network learns conserved features of IDRs that can be interpreted as motifs, repeats, or bulk features like charge or amino acid propensities. We also show that our model can be used to produce visualizations of what residues and regions are most important to IDR function, generating hypotheses for uncharacterized IDRs. Our results suggest that feature discovery using unsupervised neural networks is a promising avenue to gain systematic insight into poorly understood protein sequences.


Conflict of interest statement

I have read the journal’s policy and the authors of this manuscript have the following competing interests: AMM is a Consultant to Dewpoint Therapeutics Inc.

Figures
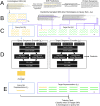
Fig 1
Fig 1. A schematic description of the reverse homology method.
A) We use standard intrinsically disordered region (IDR) prediction methods to obtain predicted IDRs for the whole proteome. We then extract homologous sets of disordered regions from whole protein multiple sequence alignments of orthologs, obtained from public databases B) Homologous sets of IDRs (gold) are combined with randomly chosen non-homologous IDRs to derive the proxy task for each region C) We sample a subset of IDRs (blue dotted box) from H and use this to construct the query set (Sq, blue box). We also sample a single IDR (purple dotted box) from H not used in the query set and add this to the target set (St, purple box). Finally, we populate the target set with non-homologous IDRs (green), sampled at random from other IDRs from other proteins in the proteome. D) The query set is encoded by the query set encoder g1. The target set is encoded by the target set encoder g2. In our implementation, we use a five-layer convolutional neural network architecture. Both encoders include both max and average pooling of the same features, which correspond to motif-like and repeat or bulk features, respectively. We label convolutional layers with the number of kernels x the number of filters in each layer. Fully connected layers are labeled with the number of filters. E) The output of g1 is a single representation for the entire query set. In our implementation, we pool the sequences in the query set using a simple average of their representations. The output of g2 is a representation for each sequence in the target set. The training goal of reverse homology is to learn encoders g1 and g2 that produce a large score between the query set representation and the homologous target representation, but not non-homologous targets. In our implementation, this is the dot product: g1(Sq)g2(st+)>g1(Sq)g2(st). After training, we extract features using the target sequence encoder. For this work, we extract the pooled features of the final convolutional layer, as shown by the arrow in D.
Fig 2
Fig 2. UMAP scatterplot of reverse homology features for our yeast model.
Reverse homology features are extracted using the final convolutional layer of the target encoder: max-pooled features are shown in red, while average-pooled features are shown in blue. We show the sequence logo corresponding to select features, named using the index at which they occur in our architecture (see Methods for how these are generated). Amino acids are colored according to their property, as shown by the legend at the bottom. All sequence logos range from 0 to 4.0 bits on the y-axis.
Fig 3
Fig 3
A) The maximum correlation between features in the final convolutional layer and each of the 66 literature-curated features from the trained reverse homology model vs. a randomly initialized model. Features are coloured by their category (top legend). Black trace indicates y = x, while grey traces indicate features more than 2.0x correlated, and less than 0.5x times correlated than the untrained random features. B) Fold enrichment for the set of nearest neighbors using feature representations from the final convolutional layer of the target encoder of our reverse homology model, versus literature-curated feature representations, for 92 GO Slim terms. We show the names of some GO terms in text boxes. C) Area under the receiver operating curve (AUC) for regularized logistic regression classification of mitochondrial targeting signals and Cdc28 targets obtained through 5-fold cross validation. A deep language model (Unirep, gold) performs better than reverse homology (blue) and literature-curated features (green). D) Features with largest coefficients (indicated below each logo) selected by the sparse classifier are consistent with the known amino acid composition biases in mitochondrial targeting signals (left) and short linear motifs in Cdc28 substrates (right).
Fig 4
Fig 4. Sequence logos, feature distributions, and examples of mutation maps for each average feature.
(A,C) Sequence logos and a histogram of the value of the feature across all IDRs is shown for Average F136 (A) and Average F65 (C). We annotate the histograms with the top activating sequences. (B,D) Mutation maps for F136 for an IDR in Uth1 in B and for F65 for an IDR in Lge1 (D), which are the 4th and 6th most activating sequences for their respective features. Mutation maps are visualized as letter maps, where positions above the axis are positions where retaining the original amino acid is preferable, while positions below the axis are positions where the activation could be improved by mutating to another amino acid. The height of the combined letters corresponds to the total magnitude of the change in the feature for all possible mutations (which we define as the favourability). For positions above the axis, we show amino acids that result in the highest value for the feature (i.e. the most favored amino acids at that position.) For positions below the axis, we show amino acids that result in the lowest value for the feature (i.e. the most disfavored amino acids at that position).
Fig 5
Fig 5
(A) Statistical enrichment of reverse homology features points to known motifs for Grb2 and PKA (top left and right, respectively). Bottom: benchmarking reverse homology features against DALEL, a state-of-the-art motif-finder. Recall of residues within characterized binding sites (blue and green bars) at a fixed total number of predictions (purple) is compared. (B) A novel motif (top logo) is more likely to match a peptide with double phosphorylation in vivo (gold bar) than random expectation (dashed line) or the feature identified as the cannonical PKA consensus (green bar). (C) Novel “positive to negative charge transition” features (top logos) are more likely to be found in proteins annotated as ribonucleocomplex in both yeast and human models than random expectation (dashed line). In A-C error bars represent standard errors of the proportion using the normal approximation to the binomial. (D and E) Global representations of features enriched in clusters of human proteins obtained through unsupervised analysis of microscopy images (HPA-X). UMAP scatter plots of the feature space are generated as in Fig 2. T-statistics from enrichment of features in the image clusters are indicated by colour and logos show representative examples of enriched features. (D) differences in the bulk properties of IDRs in proteins with different membrane localizations. The enrichments for the mitochondrial IDRs (likely targeting signals) are shown for reference on the left. (E) shows differences between bulk properties of IDRs in various nuclear subcompartments. The enrichments for the nucleus are shown for reference on the left.
Fig 6
Fig 6
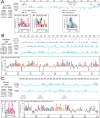
Summaries of known features (purple) compared to the top ranked reverse homology features (red and blue) for three individual IDRs, plus letter maps for selected features. We show the position of max pooled features in red (boundaries set using a cut-off of -10 or lower in magnitude), and the values of average features in blue. Average features are sorted in descending order (i.e. the top ranked feature is at the top.) Mutation maps are visualized as in Fig 4.

Similar articles

Cited by

References

    1. Kulkarni P, Uversky VN. Intrinsically Disordered Proteins: The Dark Horse of the Dark Proteome. Proteomics. 2018;18. doi: 10.1002/pmic.201800061 - DOI - PubMed
    1. Van Der Lee R, Buljan M, Lang B, Weatheritt RJ, Daughdrill GW, Dunker AK, et al.. Classification of intrinsically disordered regions and proteins. Chemical Reviews. American Chemical Society; 2014. pp. 6589–6631. doi: 10.1021/cr400525m - DOI - PMC - PubMed
    1. Lindorff-Larsen K, Kragelund BB. On the potential of machine learning to examine the relationship between sequence, structure, dynamics and function of intrinsically disordered proteins. 2021. - PubMed
    1. Davey NE. The functional importance of structure in unstructured protein regions. Current Opinion in Structural Biology. Elsevier Ltd; 2019. pp. 155–163. doi: 10.1016/j.sbi.2019.03.009 - DOI - PubMed
    1. Wright PE, Dyson HJ. Intrinsically disordered proteins in cellular signalling and regulation. Nat Rev Mol Cell Biol. 2015;16: 18–29. doi: 10.1038/nrm3920 - DOI - PMC - PubMed

Publication types

MeSH terms

Grants and funding