. 2022 Jul;8(26):eabl8247.
doi: 10.1126/sciadv.abl8247. Epub 2022 Jun 29.

In vivo multidimensional CRISPR screens identify Lgals2 as an immunotherapy target in triple-negative breast cancer

Affiliations

In vivo multidimensional CRISPR screens identify Lgals2 as an immunotherapy target in triple-negative breast cancer

Peng Ji et al. Sci Adv. 2022 Jul.

Abstract

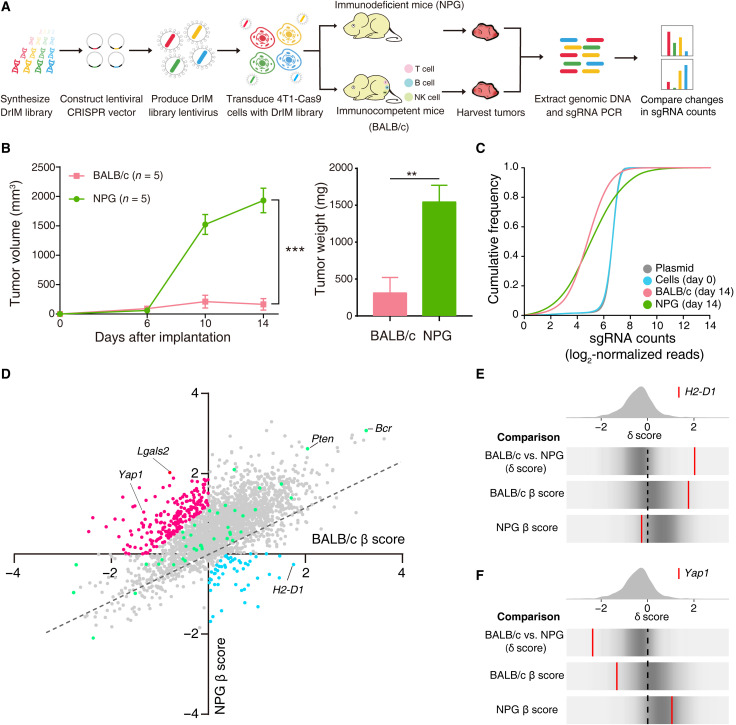
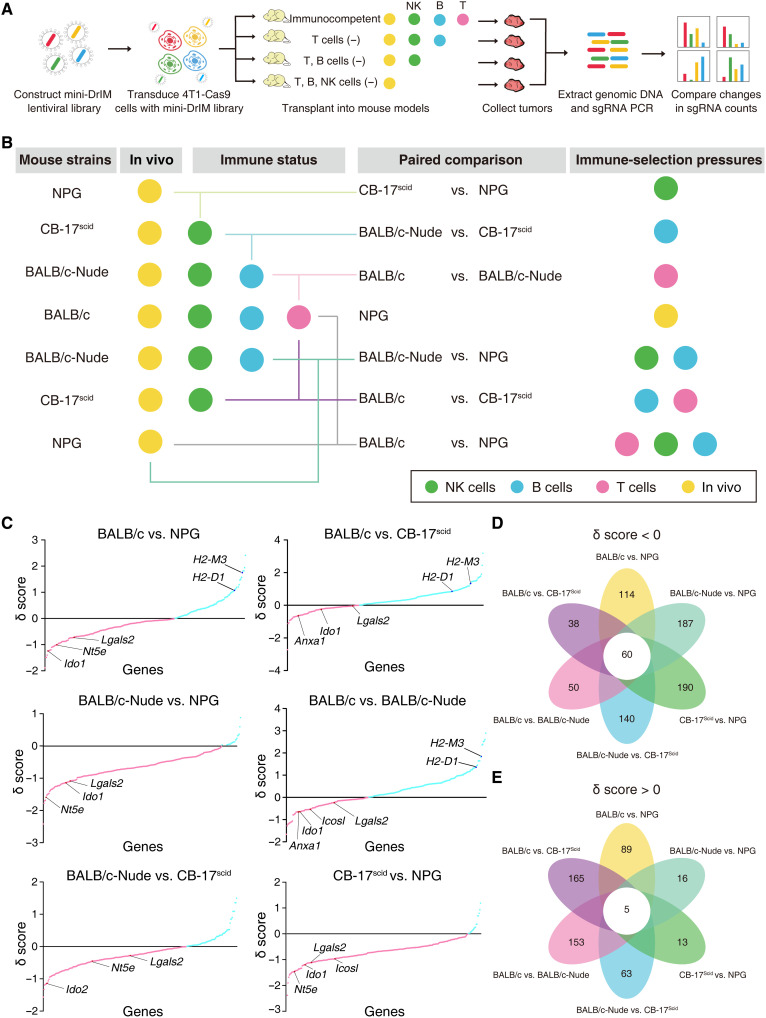
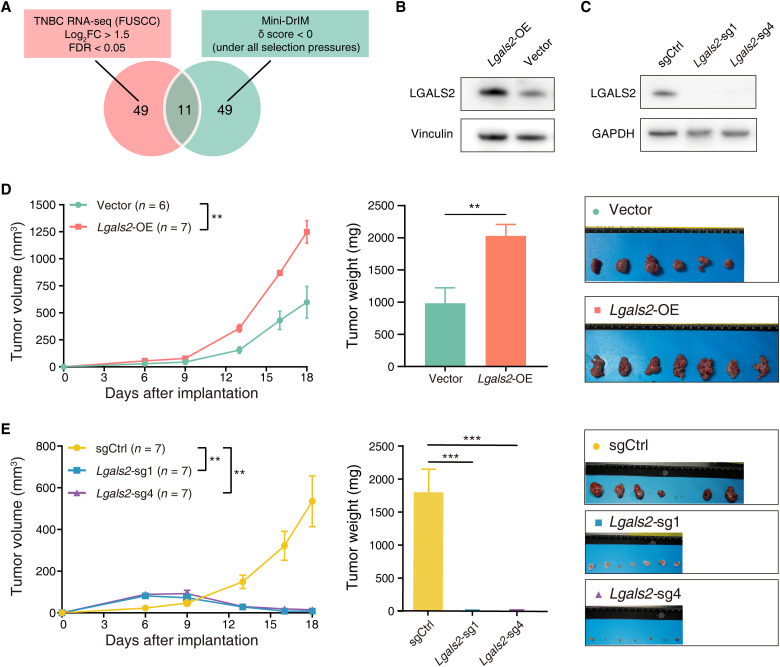
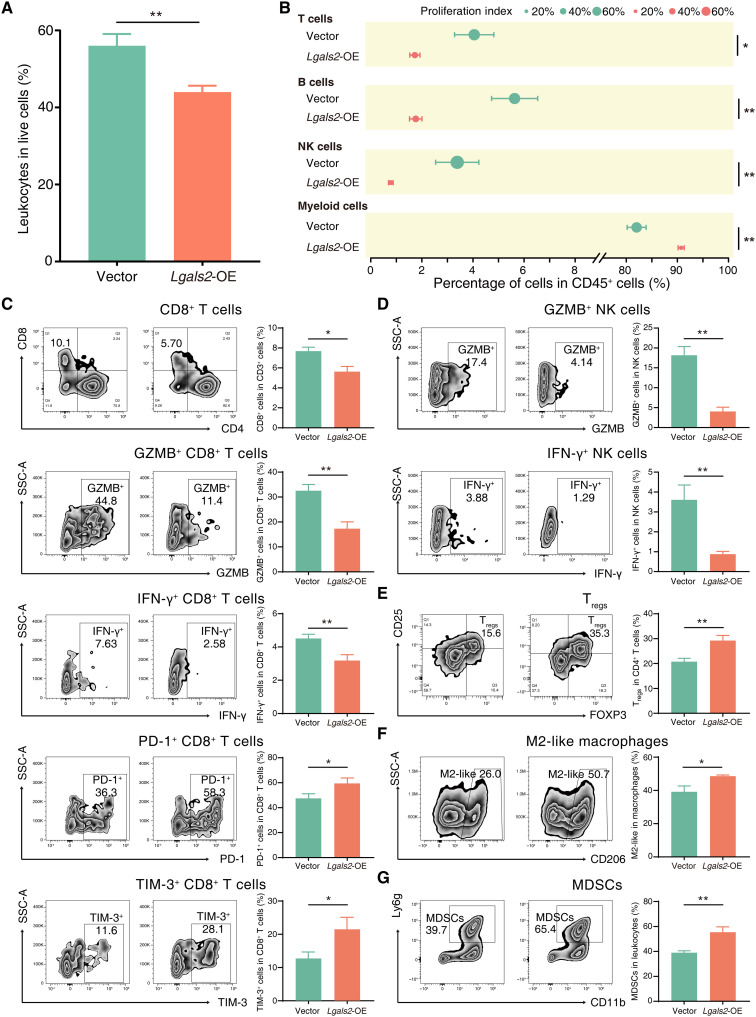
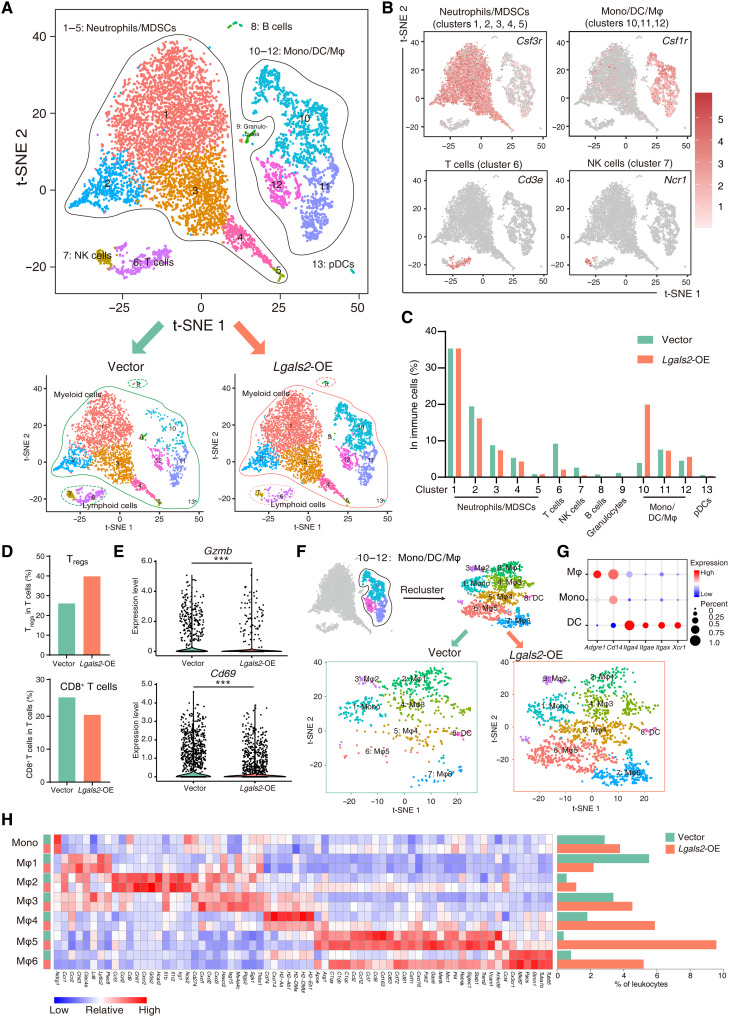
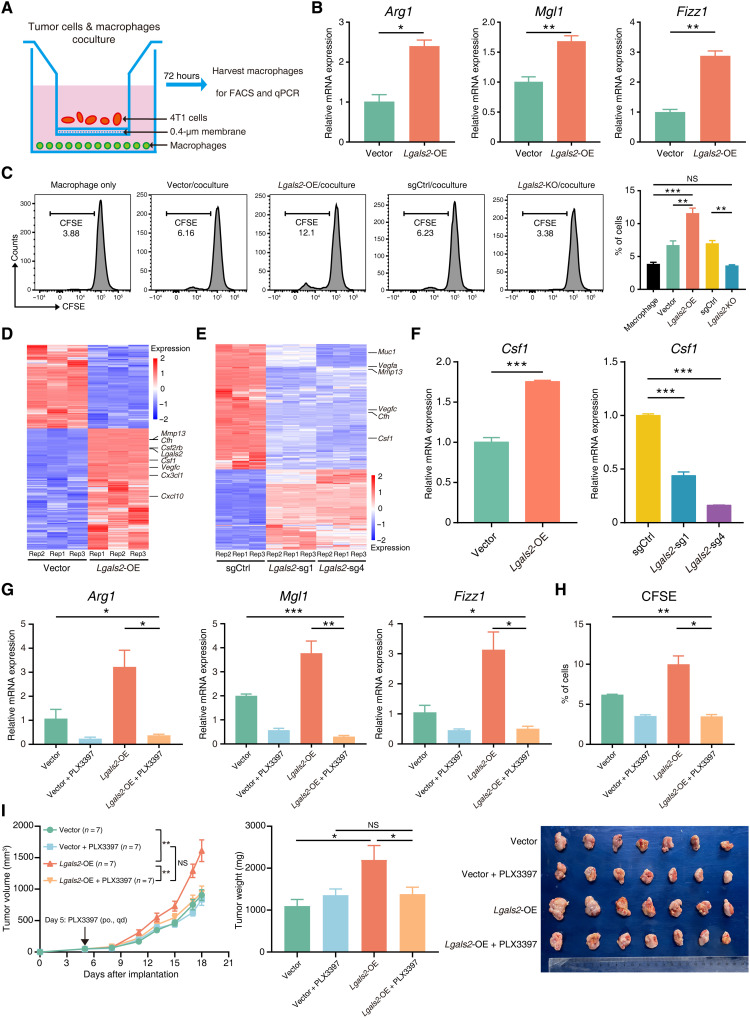
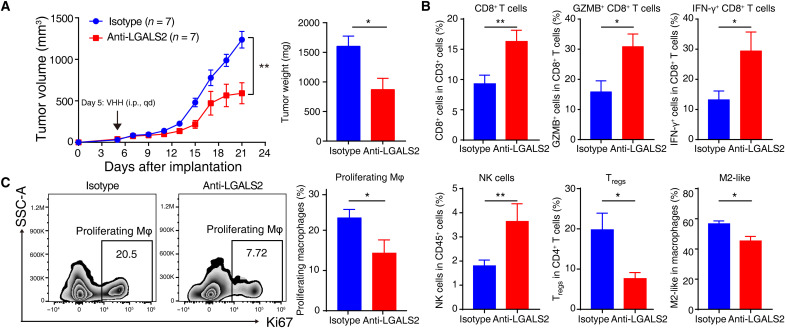
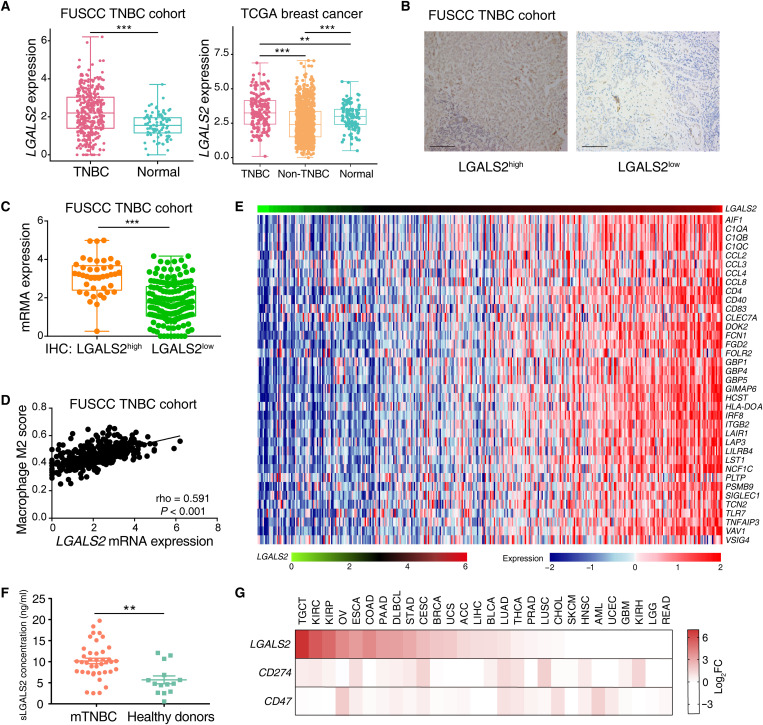
Immune checkpoint inhibitors exhibit limited response rates in patients with triple-negative breast cancer (TNBC), suggesting that additional immune escape mechanisms may exist. Here, we performed two-step customized in vivo CRISPR screens targeting disease-related immune genes using different mouse models with multidimensional immune-deficiency characteristics. In vivo screens characterized gene functions in the different tumor microenvironments and recovered canonical immunotherapy targets such as Ido1. In addition, functional screening and transcriptomic analysis identified Lgals2 as a candidate regulator in TNBC involving immune escape. Mechanistic studies demonstrated that tumor cell-intrinsic Lgals2 induced the increased number of tumor-associated macrophages, as well as the M2-like polarization and proliferation of macrophages through the CSF1/CSF1R axis, which resulted in the immunosuppressive nature of the TNBC microenvironment. Blockade of LGALS2 using an inhibitory antibody successfully arrested tumor growth and reversed the immune suppression. Collectively, our results provide a theoretical basis for LGALS2 as a potential immunotherapy target in TNBC.


Figures

Fig. 1.
Fig. 1.. In vivo CRISPR screens targeting disease-related immune genes identify candidate tumor-related immune genes.
(A) Schematics of the experimental design. (B) Tumor growth and tumor weight of intramammary fat pad tumors from transplanted DrIM-transduced 4T1-Cas9 cells in BALB/c mice (n = 5) and NPG mice (n = 5). **P < 0.01 and ***P < 0.001. Data are presented as the means ± SEM. (C) Cumulative distribution function plots of DrIM library sgRNAs in the plasmid, cells before transplantation, tumors in BALB/c mice, and tumors in NPG mice. Distributions in each sample type are averaged across individual mice and infection replicates. (D) Scatterplot of the gene essentiality score (β score) in BALB/c versus β score in NPG for all genes after in vivo screening. The dotted line indicates the linear regression trend line. Every dot means a gene in library. The color of the points represents selected genes as candidate in the second round of screen (red, immune escape; blue, immune surveillance; green, control). (E and F) Frequency histograms of the δ score for all sgRNAs. sgRNAs targeting the indicated genes including (E) H2-D1 and (F) Yap1 are shown by the red lines.
Fig. 2.
Fig. 2.. In vivo mini-DrIM library screens uncover immune-response features of selected genes under different immune pressures.
(A) Schematics of the experimental design. (B) Diagram of in vivo screens of the mini-DrIM pool under multiple immune-selection pressures. (C) Scatterplots showing the rank-ordered δ score of all targeted genes in the mini-DrIM library under the indicated immune-selection pressure. X axis shows targeted genes; y axis shows the δ score of each targeted gene. Genes are highlighted in red (δ score < 0) and blue (δ score > 0). (D and E) Flower plots showing the number of genes with (D) δ score < 0 or (E) δ score >0 under each immune-selection pressure and all immune-selection pressures.
Fig. 3.
Fig. 3.. Lgals2 affects tumor growth in vivo, not in vitro.
(A) Venn diagram of the two criteria to identify the candidate gene hits (significantly enriched in TNBC tumor samples, δ score < 0 under all selection pressures). (B and C) Western blot of Lgals2 protein level in 4T1 cells transduced with (B) either vector or Lgals2–overexpressing (OE) plasmid and (C) either vector control or Lgals2-targeting sgRNAs. (D and E) Tumor growth, tumor weight, and ex vivo images of resected tumors from transplanted 4T1 cells with (D) Lgals2 overexpression or (E) Lgals2 KO in BALB/c mice. ***P < 0.001 and **P < 0.01. Data are presented as the means ± SEM. GAPDH, glyceraldehyde-3-phosphate dehydrogenase.
Fig. 4.
Fig. 4.. Lgals2 is associated with immune cell infiltration in the TME.
(A) Bar plot comparing the percentage of leukocytes among live cells between vector control and Lgals2-overexpressing 4T1 tumors. **P < 0.01. (B) Forest plot showing different types of infiltrating immune cells in vector controls and Lgals2-overexpressing 4T1 tumors. **P < 0.01; *P < 0.05. Data are presented as means ± SEM. (C to G) The primary tumors of vector control and Lgals2-overexpressing 4T1 tumors of BALB/c mice were harvested for flow cytometry to determine the percentages of (C) CD8+ T cells among CD3+ T cells, granzyme B+ (GZMB+) cells among CD8+ T cells, IFN-γ+ cells among CD8+ T cells, PD-1+ cells among CD8+ T cells, and TIM-3+ cells among CD8+ T cells; (D) GZMB+ cells among NK cells and IFN-γ+ cells among NK cells; (E) FOXP3+CD25+ Tregs among CD4+ T cells; (F) M2-like macrophages among total macrophages; and (G) MDSCs among CD45+ cells. Representative plots of individual tumors are shown on the left, and bar graphs of the summary data for all tumors are shown on the right. **P < 0.01; *P < 0.05; not significant (NS) P ≥ 0.05. Data are presented as the means ± SEM.
Fig. 5.
Fig. 5.. Single-cell RNA-seq reveals the Lgals2-induced polarization of macrophages in the TME.
(A) The t-SNE plot of intratumoral immune cells in 4T1 tumors. Cells and clusters are color coded by the major cell type found. (B) t-SNE plot of immune cells displaying marker gene expression. (C) The distribution of immune cell types between control vector and Lgals2-overexpressing tumors. (D) The distribution of Tregs and CD8+ T cells between control vector and Lgals2-overexpressing tumor cells. (E) Violin plot of Gzmb and Cd69 mRNA levels. (F) t-SNE plot of the reclassification of intratumoral monocytes/DCs/macrophages. (G) Expression of marker genes for identifying monocytes, DCs, and macrophages. (H) Heatmap displaying normalized expression of selected genes in each monocyte/DCs/macrophage cluster and histogram displaying the distribution of each cluster between control vector and Lgals2-overexpressing tumor cells.
Fig. 6.
Fig. 6.. Lgals2 facilitates M2-like polarization and proliferation of macrophages through CSF1.
(A) Schematic showing the 4T1 cells cocultured with mouse macrophages in a Transwell chamber of 0.4-μm pore size. (B) Arg1, Mgl1, and Fizz1 mRNA in mouse macrophages cocultured with Lgals2-overexpressing and vector control 4T1 cells for 72 hours were analyzed by qPCR. (C) CFSE-labeled mouse macrophages were cocultured with indicated 4T1 cells. Macrophage proliferation was quantified using fluorescence-activated cell sorting (FACS) analysis. Representative flow cytometry data are shown on the left, and quantification is shown on the right. (D and E) Heatmap of differentially expressed bulk RNA-seq genes between (D) Lgals2-overexpressing and vector control or (E) Lgals2-KO and vector control 4T1 cells in vitro. (F) qPCR validation of the differentially expressed gene Csf1 in 4T1 cells. (G and H) Mouse macrophages were cocultured with Lgals2-overexpressing and vector control 4T1 cells for 72 hours with/without CSF1R inhibitor PLX3397. (G) Arg1, Mgl1, and Fizz1 mRNA in mouse macrophages were analyzed by qPCR. (H) Macrophage proliferation was quantified using FACS analysis. (I) Tumor growth, tumor weight, and ex vivo images of resected tumors from transplanted 4T1 cells with vector control or Lgals2 overexpression in BALB/c mice following the treatment of PLX3397 (n = 7 each group). The arrow indicates the beginning time of treatment of PLX3397. If not noted otherwise, data are presented as the means ± SEM. ***P < 0.001, **P < 0.01, *P < 0.05, and NS P ≥ 0.05.
Fig. 7.
Fig. 7.. Blockade of LGALS2 enhances antitumor immune responses and shows the immunotherapeutic potential of targeting LGALS2 in TNBC.
(A) Tumor growth and tumor weight of intramammary fat pad tumors from transplanted 4T1 cells in BALB/c mice following isotype (n = 7) or anti-LGALS2 antibody (n = 7) injection. The arrow indicates the beginning time of injection of isotype or anti-LGALS2 antibody. **P < 0.01 and *P < 0.05. Data are presented as means ± SEM. (B) Primary tumors grown from 4T1 cells following different treatments were harvested for flow cytometry to determine the percentages of CD8+ T cells among CD3+ T cells, GZMB+ cells among CD8+ T cells, IFN-γ+ cells among CD8+ T cells, NK cells among CD45+ leukocytes, FOXP3+CD25+ Tregs among CD4+ T cells, and M2-like macrophages among total macrophages. **P < 0.01; *P < 0.05. Data are presented as the means ± SEM. (C) Representative plots and bar graphs of the percentages of proliferating macrophages among total macrophages from the primary tumors grown from 4T1 cells following different treatments. *P < 0.05. Data are presented as the means ± SEM.
Fig. 8.
Fig. 8.. LGALS2 is up-regulated in TNBC and associated with M2-like macrophage markers.
(A) Box plot showing LGALS2 mRNA expression levels across TNBC, non-TNBC, and normal samples in the FUSCC and TCGA cohorts. Whiskers indicate the minimum and maximum values. ***P < 0.001; **P < 0.01. (B) Representative images of IHC staining of LGALS2 in TNBC tumor samples. Scale bars, 200 μm. (C) Box plot comparing LGALS2 mRNA expression level between high and low IHC scores of LGALS2 for TNBC in which mRNA expression and IHC were both available in the FUSCC cohort (n = 193). Whiskers indicate the minimum and maximum values. ***P < 0.001. (D) The association between LGALS2 mRNA expression levels and M2-like macrophage scores in TNBC patient samples from FUSCC (n = 360). The M2-like macrophage scores were computed as described by Xiao et al. (60). (E) Heatmap of the association between LGALS2 mRNA levels and a list of TAM-related genes in the FUSCC TNBC cohort (n = 360). FDR < 0.05 and Spearman rho > 0.3 were used as the criteria to select the most significant TAM markers for generating the heatmap. (F) Comparison of serum LGALS2 concentration between patients with metastatic TNBC and healthy donors. **P < 0.01. Whiskers indicate the means ± SEM. (G) Heatmap of LGALS2 tumor–to–matched normal mRNA expression ratios (log2FC) compared to known immune checkpoints in many different types of tumors.

References

    1. Bray F., Ferlay J., Soerjomataram I., Siegel R. L., Torre L. A., Jemal A., Global cancer statistics 2018: GLOBOCAN estimates of incidence and mortality worldwide for 36 cancers in 185 countries. CA Cancer J. Clin. 68, 394–424 (2018). - PubMed
    1. Denkert C., Liedtke C., Tutt A., von Minckwitz G., Molecular alterations in triple-negative breast cancer—The road to new treatment strategies. Lancet 389, 2430–2442 (2017). - PubMed
    1. Wilky B. A., Immune checkpoint inhibitors: The linchpins of modern immunotherapy. Immunol. Rev. 290, 6–23 (2019). - PubMed
    1. Schmid P., Rugo H. S., Adams S., Schneeweiss A., Barrios C. H., Iwata H., Dieras V., Henschel V., Molinero L., Chui S. Y., Maiya V., Husain A., Winer E. P., Loi S., Emens L. A.; IMpassion130 Investigators , Atezolizumab plus nab-paclitaxel as first-line treatment for unresectable, locally advanced or metastatic triple-negative breast cancer (IMpassion130): Updated efficacy results from a randomised, double-blind, placebo-controlled, phase 3 trial. Lancet Oncol. 21, 44–59 (2020). - PubMed
    1. Schmid P., Cortes J., Pusztai L., McArthur H., Kummel S., Bergh J., Denkert C., Park Y. H., Hui R., Harbeck N., Takahashi M., Foukakis T., Fasching P. A., Cardoso F., Untch M., Jia L., Karantza V., Zhao J., Aktan G., Dent R., O’Shaughnessy J.; KEYNOTE-522 Investigators , Pembrolizumab for early triple-negative breast cancer. N. Engl. J. Med. 382, 810–821 (2020). - PubMed

MeSH terms