. 2022 Jul;8(26):eabm6185.
doi: 10.1126/sciadv.abm6185. Epub 2022 Jun 29.

Exceptionally stable preindustrial sea level inferred from the western Mediterranean Sea

Affiliations

Exceptionally stable preindustrial sea level inferred from the western Mediterranean Sea

Bogdan P Onac et al. Sci Adv. 2022 Jul.

Abstract

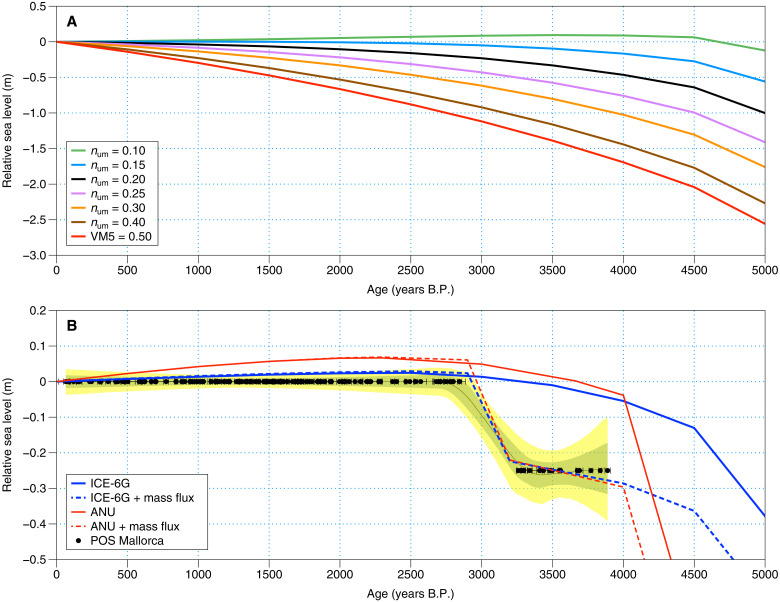
An accurate record of preindustrial (pre-1900 CE) sea level is necessary to contextualize modern global mean sea level (GMSL) rise with respect to natural variability. Precisely dated phreatic overgrowths on speleothems (POS) provide detailed rates of Late Holocene sea-level rise in Mallorca. Statistical analysis indicates that sea level rose locally by 0.12 to 0.31 m (95% confidence) from 3.26 to 2.84 thousand years (ka) ago (2σ) and remained within 0.08 m (95% confidence) of preindustrial levels from 2.84 ka to 1900 CE. This sea-level history is consistent with glacial isostatic adjustment models adopting relatively weak upper mantle viscosities of ~1020 Pa s. There is virtual certainty (>0.999 probability) that the average GMSL rise since 1900 CE has exceeded even the high average rate of sea-level rise between 3.26 and 2.84 ka inferred from the POS record. We conclude that modern GMSL rise is anomalous relative to any natural variability in ice volumes over the past 4000 years.


Figures

Fig. 1.
Fig. 1.. Holocene POS in Mallorca.
(A) Schematic representation of the indicative meaning of POS. RSL is measured by subtracting POS’s RWL from its elevation relative to modern sea level. IR, indicative range; ht, high tide; lt, low tide. (B) Drawing depicting types of POS growth. 1, Knob-type POS encrusting a stalactite that was too short to allow growth over the full tidal range (i.e., only high-tide growth); 2, spindle-shaped POS precipitated on a column over the entire tidal range as shown in (A) and 2a/b. (C) Composite POS in Coves del Drac formed during sea level still stand no. 1 (2b) and after a sea-level rise to still stand no. 2 (2a). Photo credit: B. P. Onac, University of South Florida.
Fig. 2.
Fig. 2.. Mallorca POS-derived Late Holocene RSL.
A Bayesian statistical analysis (19) of the POS data (green and yellow envelopes denote the 67 and 95% credible intervals, respectively) shows that RSL (uncorrected for GIA) remained still at −0.25 m between ~3.9 and ~3.3 ka and at preindustrial GMSL for the past ~2.8 ka. Blue and red curves show the GMSL with respect to 1900 CE (mean with 1σ uncertainties) in (1) and (8), respectively. Solid circles and open rhombs denote POS analyzed at University of New Mexico and University of Bern, respectively. The inset focuses on the RSL position measured in three caves since 2008. Codes in the legend represent the identifiers of each U-series dated POS as listed in table S1. Vertical uncertainties on the POS data are omitted from the figure but are shown on fig. S18A.
Fig. 3.
Fig. 3.. Comparison between RSL observations (POS) and predictions from GIA models in Mallorca over the past 5000 years.
(A) Predictions based on the ICE-6G history and the VM5 viscosity model (red line) as well as a series of additional Earth models in which the num of VM5 is progressively reduced from 0.4 × 10²¹ to 0.1 × 10²¹ Pa s (num, as labeled, in units of 1021 Pa s). UM, upper mantle. (B) Prediction (solid blue) based on the ICE-6G ice history and the VM5 Earth model with the exception that the num of that model is reduced to 1.3 × 10²⁰ Pa s. The dashed blue line is identical to the solid but augmented to include a linear melt event from WAIS between 3.26 and 2.84 ka equivalent to 0.22-m GMSL, which would be necessary for a ~0.25-m RSL change in Mallorca. To achieve the same sea-level rise at Mallorca from GrIS melt would require a mass flux equivalent to ~0.5 m of the GMSL rise, which is unlikely, given the arguments cited above favoring WAIS as the source. The red lines are analogous to the blue, except that the Australian National University (ANU) ice history is adopted (with the component of melt in that model over the past 4 ka removed) and the adopted Earth model has LT = 60 km, num = 1.5 × 10²⁰ Pa s, and nlm = 2 × 10²¹ Pa s. Solid black circles (with age uncertainties) represent POS elevations transferred from Fig. 2, the green and yellow shaded envelopes representing 67 and 95% credible intervals, respectively, determined from the Bayesian change point model.

References

    1. Kopp R. E., Kemp A. C., Bittermann K., Horton B. P., Donnelly J. P., Gehrels W. R., Hay C. C., Mitrovica J. X., Morrow E. D., Rahmstorf S., Temperature-driven global sea-level variability in the Common Era. Proc. Natl. Acad. Sci. U.S.A. 113, E1434–E1441 (2016). - PMC - PubMed
    1. Dutton A., Carlson A. E., Long A. J., Milne G. A., Clark P. U., DeConto R., Horton B. P., Rahmstorf S., Raymo M. E., Sea-level rise due to polar ice-sheet mass loss during past warm periods. Science 349, aaa4019 (2015). - PubMed
    1. Horton B. P., Kopp R. E., Garner A. J., Hay C. C., Khan N. S., Roy K., Shaw T. A., Mapping sea-level change in time, space, and probability. Annu. Rev. Env. Resour. 43, 481–521 (2018).
    1. Walker J. S., Kopp R. E., Little C. M., Horton B. P., Timing of emergence of modern rates of sea-level rise by 1863. Nat. Commun. 13, 966 (2022). - PMC - PubMed
    1. Kemp A. C., Wright A. J., Edwards R. J., Barnett R. L., Brain M. J., Kopp R. E., Cahill N., Horton B. P., Charman D. J., Hawkes A. D., Hill T. D., van de Plassche O., Relative sea-level change in Newfoundland, Canada during the past ∼3000 years. Quat. Sci. Rev. 201, 89–110 (2018).