. 2022 Sep 27;6(18):5449-5462.
doi: 10.1182/bloodadvances.2021006008.

Development of a carotid artery thrombolysis stroke model in mice

Affiliations

Development of a carotid artery thrombolysis stroke model in mice

Jessica A A Maclean et al. Blood Adv. .

Abstract

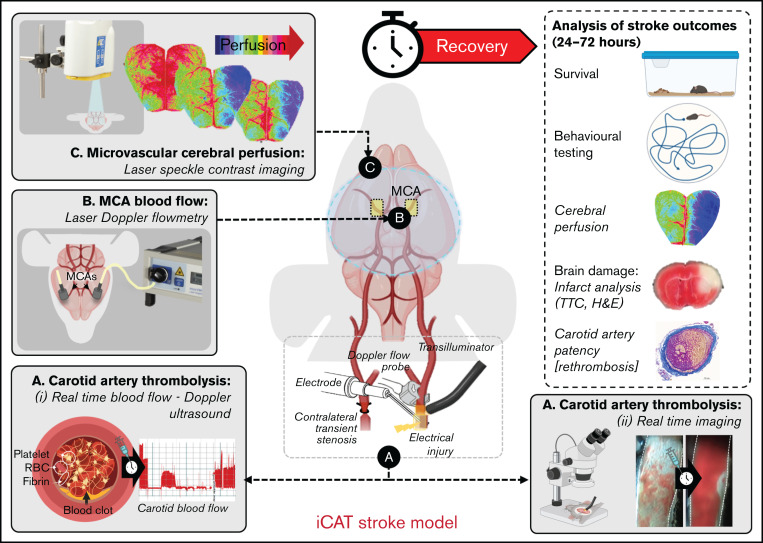
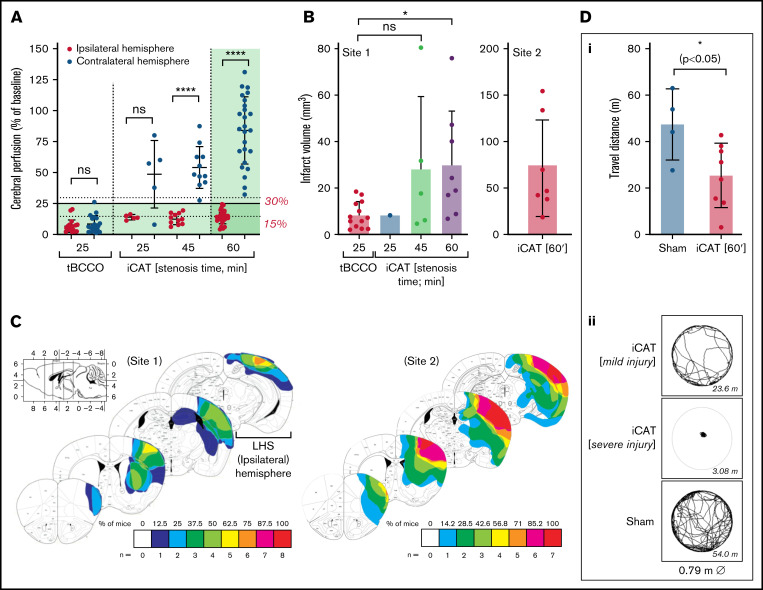
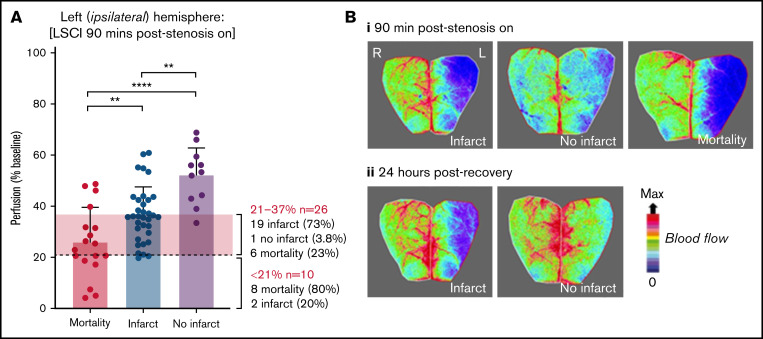
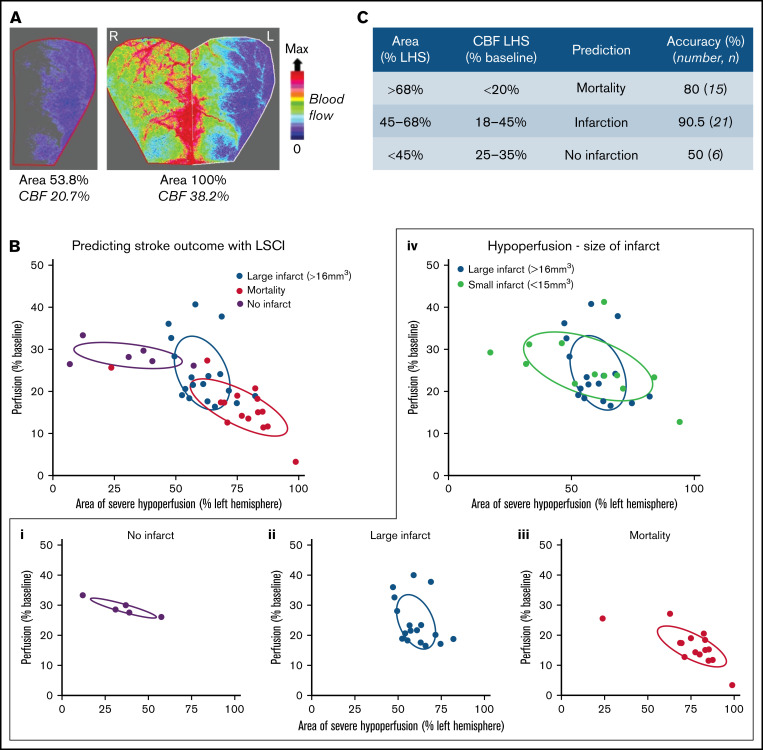
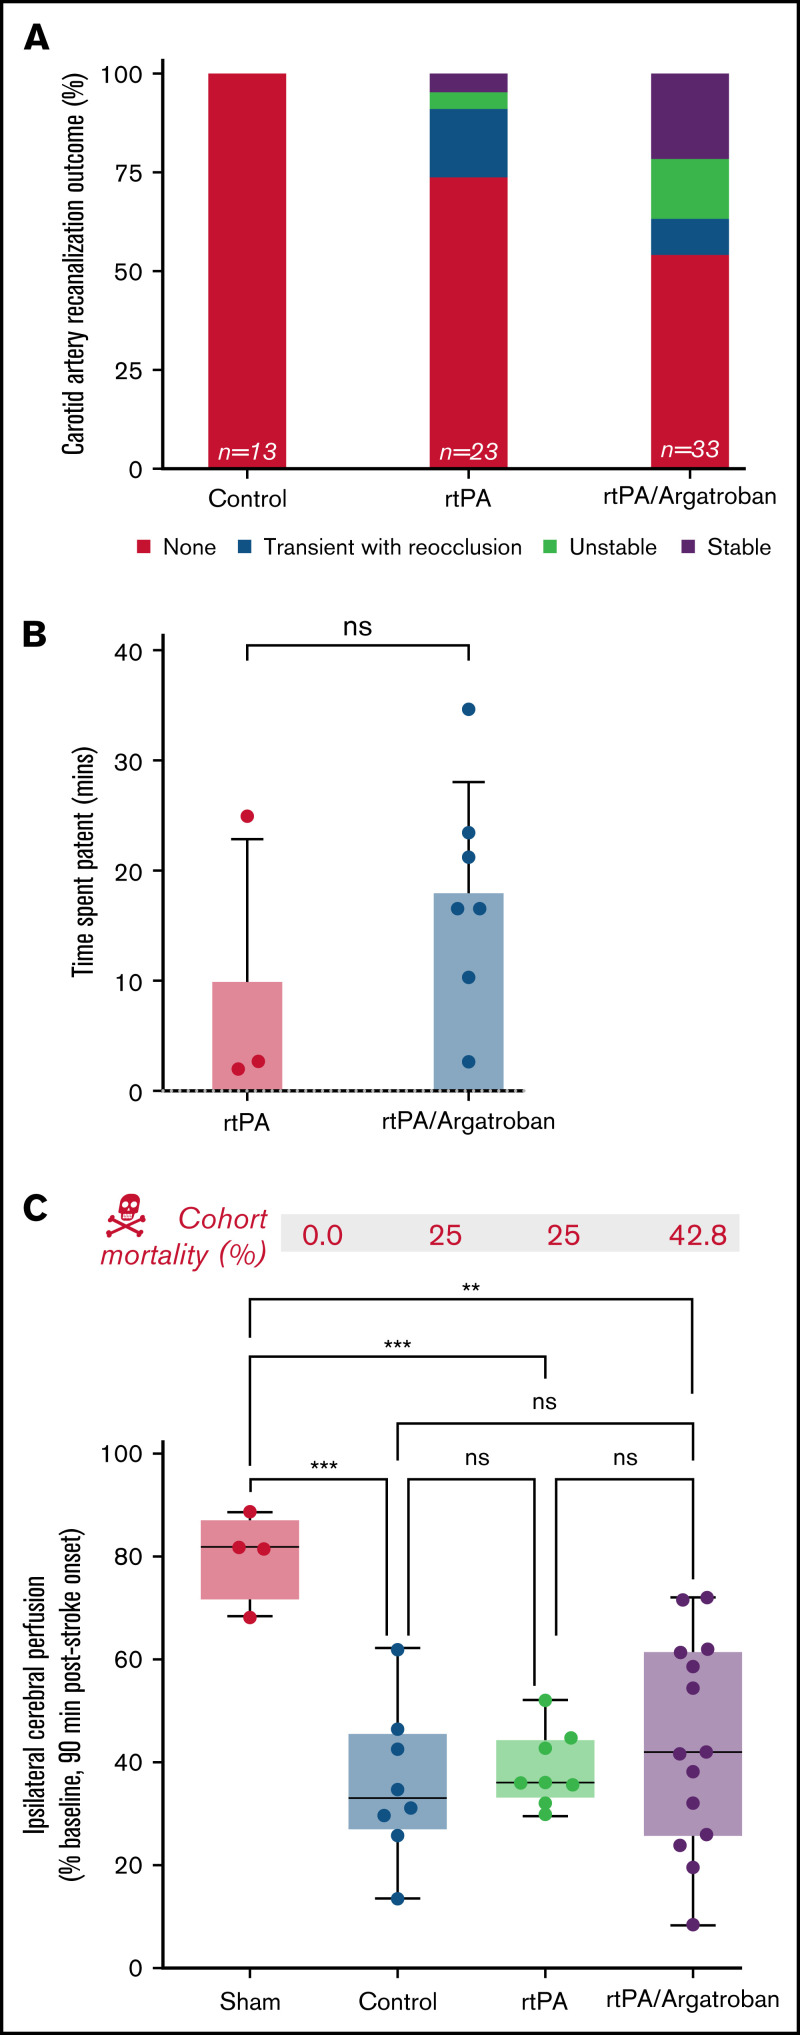
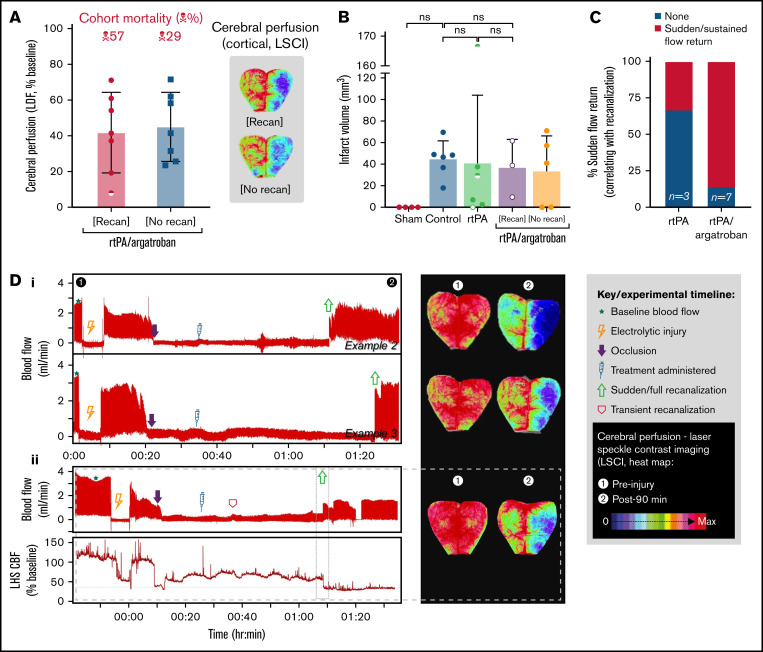
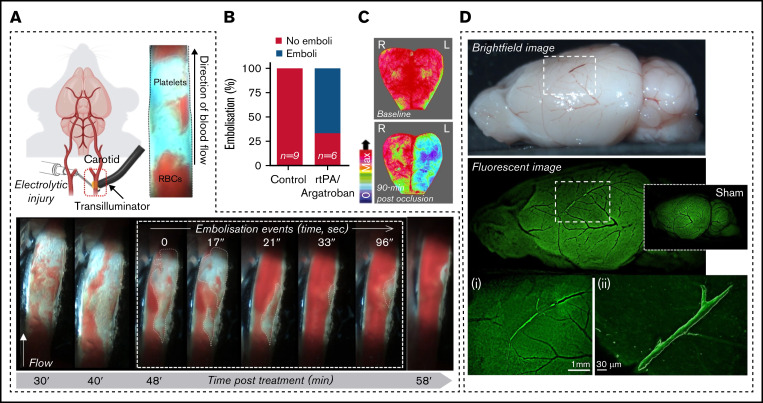
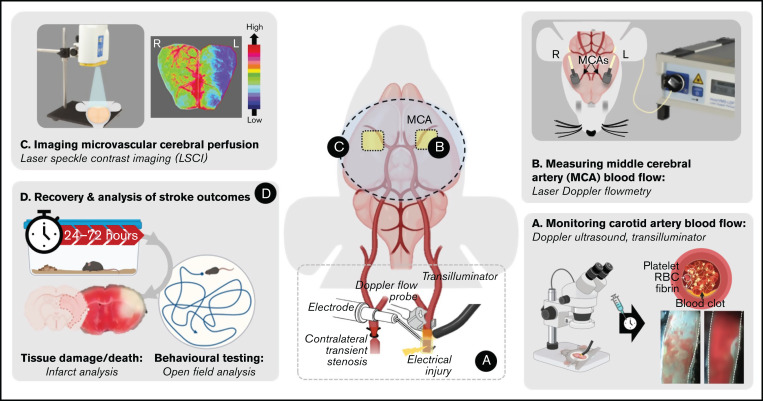
Recanalization with restored cerebral perfusion is the primary goal of thrombolytic therapy in acute ischemic stroke. The identification of adjunctive therapies that can be safely used to enhance thrombolysis in stroke remains an elusive goal. We report here the development of a mouse in situ carotid artery thrombolysis (iCAT) stroke model involving graded cerebral ischemia to induce unihemispheric infarction after thrombotic occlusion of the common carotid artery (CCA). Electrolytic-induced thrombotic occlusion of the left CCA enabled real-time assessment of recanalization and rethrombosis events after thrombolysis with recombinant tissue-type plasminogen activator (rtPA). Concurrent transient stenosis of the right CCA induced unihemispheric hypoperfusion and infarction in the left middle cerebral artery territory. Real-time assessment of thrombolysis revealed recanalization rates <30% in rtPA-treated animals with high rates of rethrombosis. Addition of the direct thrombin inhibitor argatroban increased recanalization rates to 50% and reduced rethrombosis. Paradoxically, this was associated with increased cerebral ischemia and stroke-related mortality (25%-42%). Serial analysis of carotid and cerebral blood flow showed that coadministration of argatroban with rtPA resulted in a marked increase in carotid artery embolization, leading to distal obstruction of the middle cerebral artery. Real-time imaging of carotid thrombi revealed that adjunctive anticoagulation destabilized platelet-rich thrombi at the vessel wall, leading to dislodgement of large platelet emboli. These studies confirm the benefits of anticoagulants in enhancing thrombolysis and large artery recanalization; however, at high levels of anticoagulation (∼3-fold prolongation of activated partial thromboplastin time), this effect is offset by increased incidence of carotid artery embolization and distal middle cerebral artery occlusion. The iCAT stroke model should provide important new insight into the effects of adjunctive antithrombotic agents on real-time thrombus dynamics during thrombolysis and their correlation with stroke outcomes.


Figures

None
Graphical abstract
Figure 1.
Figure 1.
The iCAT stroke model causes unihemispheric infarction. C57BL/6 male mice underwent the iCAT procedure (25, 45, and 60 minutes’ stenosis) or thrombotic bilateral common carotid artery occlusion (tBCCO) procedure (25 minutes). (A) Dot plot depicting the average perfusion drop (percentage of baseline) for mice in each cohort, in which the ischemic threshold is indicated by the solid gray line (25% baseline). The average cerebral perfusion of the ipsilateral (left, red symbols) and contralateral (right, blue symbols) cerebral hemispheres was assessed with LDF for the duration of the stroke induction period and presented as a percentage of baseline perfusion. Specifically, LDF readings are presented as the average cerebral perfusion immediately after bilateral occlusion until clamp removal (supplemental Figure 1Bii a-b) or immediately after stenosis application to immediately after stenosis release (supplemental Figure 1Cii; between a and b). (B-D) A subset of animals from panel A were recovered to 24 hours’ postischemia induction at Site 1. Site 2 represents experiments completed at a secondary site where ambient room temperature was >2°C warmer than Site 1. (B) Infarct volume was assessed with TTC staining, with dot plots depicting infarct volumes at 24 hours in surviving animals. Data in panels A and B represent the mean ± standard deviation, analyzed to assess statistical significance using one-way analysis of variance, where nsP > .05, *P < .05, ****P < .001. (C) The infarct area of individual mice subjected to 60 minutes of graded stenosis at either Site 1 or 2 (quantified in panel B) was demarcated and overlaid onto a single image of the relevant brain section, with layers color-coded to reflect the number (n) of animals presenting with cerebral infarction within the denoted region (as indicated by the color key). (D) Post 24-hour recovery, functional evaluation of animals undergoing either sham or 60 minutes of iCAT-induced ischemia was conducted with open-field assessment using MouseMove at Site 1. The histogram depicts quantification of travel distance in animals undergoing either sham or 60 minutes of iCAT-induced ischemia (i) or depicts travel patterns taken from representative mice for each of sham and iCAT (mild and severe injury) (ii). ns, not significant.
Figure 2.
Figure 2.
Cortical perfusion measurements are predictive of stroke outcomes in the iCAT model. C57BL/6 mice were subjected to the iCAT stroke model (60 minutes’ ischemia), with LCSI assessed at 90 minutes’ poststroke onset (stenosis on). Mice were then recovered and assessed for stroke outcomes, including mortality and presence of infarction at 24 hours. (A) Quantification of cerebral perfusion at 90 minutes, grouped according to 24-hour stroke outcome (mortality, infarct/no infarct), with data depicted as the mean ± standard deviation, with statistical significance analyzed by using an ordinary one-way analysis of variance with Šidák’s multiple comparisons test, where **P < .01, ****P < .0001. (B) LSCI examples show flux readouts of cortical cerebral perfusion in the ipsilateral (left; L) and contralateral (right; R) hemisphere at 90 minutes (i) and 24 hours (ii) after stroke onset, with a representative image taken from 1 of all 3 stroke outcome categories assessed (ie, mortality, no infarct, and infarct). Experiments were conducted at ambient temperature <21°C (Site 1).
Figure 3.
Figure 3.
Stroke outcome at 24 hours is predicted by cortical perfusion measurements. C57BL/6 mice were subjected to the iCAT stroke model (60 minutes’ ischemia). (A) Representative flux image of the ipsilateral (L) and contralateral (R) cerebral cortex of a C57BL/6 mouse at 90 minutes’ post–stroke onset, in which the left inset depicts the area of ipsilateral hemisphere with severe hypoperfusion, defined as threshold <250 flux units, as quantified using moorReview 5.0 software. (B) Scatter plots represent the calculated area of severe hypoperfusion (as assessed in panel A) correlated with the overall degree of hypoperfusion within the same region, for each individual mouse. Data were analyzed by using XLSTAT (Addinsoft, Paris, France) to highlight any correlation between the level of hypoperfusion and stroke outcomes, where mice were grouped according to their outcome at 24 hours, including no infarct (no TTC-visible infarction) (i), large infarct (infarct visible on TTC > 16 mm3) (ii), and small infarct (infarct visible on TTC < 15 mm3) or mortality (iii), where an individual mouse was deceased before end point. (iv) Severe and moderate hypoperfusion were classified as LSCI flux <21% of baseline and LSCI flux between 21% and 37% of baseline, respectively. (C) Tabulated summary depicting area of hypoperfusion and correlated predictive outcome, based on the analysis presented in panel B. Experiments were conducted at ambient temperature <21°C (Site 1).
Figure 4.
Figure 4.
Combined fibrinolytic and anticoagulant therapy improves early recanalization but not cerebral perfusion. C57BL/6 mice were subjected to the iCAT stroke model (60 minutes’ ischemia). Treatments were delivered IV 15 minutes after occlusion of the carotid artery (supplemental Figure 2E). Treatment dosing regimens: rtPA (10 mg/kg [1/9 mg/kg bolus/infusion over 30 minutes]); argatroban (80 µg/kg bolus; 40 µg/kg per minute infusion over 60 minutes + osmotic minipump 40 µg/kg/min infusion 23 hours). Blood flow was monitored for 60 minutes after treatment onset, and recanalization defined as measurable return of blood flow, classified as: stable (steady flow), unstable (fluctuating flow), transient with reocclusion, or none, as defined in the supplemental Methods. (A) Graph represents the percentage of animals exhibiting each specified category of blood flow, where n represents the total number of animals in each cohort. Recanalization data in the rtPA and rtPA/argatroban cohort represent pooled data from separate experimental cohorts. (B) Graph represents the amount of time vessels remain patent, quantified as a function of the area under the curve for rtPA and rtPA/argatroban cohorts. (C) A subset of animals was recovered to 24 hours for assessment of stroke outcomes (Recanalization details of this cohort alone are provided in supplemental Figure 4.) Cerebral perfusion (LSCI) was assessed at 90 minutes’ post–stroke onset in sham (n = 4) and control (n = 8) animals or in animals treated with rtPA (n = 8) or rtPA/argatroban (n = 14) from a single experimental cohort. Animals that died before the 90-minute time point were not included in cerebral perfusion assessment. Quantification of ipsilateral cerebral perfusion at 90 minutes’ post–stroke onset is presented in a boxplot depicting the middle 50% (box) and minimum to maximum data values obtained (whiskers), with all data points shown for clarity. Statistical analysis was performed by using an ordinary one-way analysis of variance with Tukey’s multiple comparisons test, where ***P < .001, **P < .005 and nsP > .05. Cohort mortality Skull and crossbones ([skull and crossbones]) denote mortality rate as a percentage of animals treated (sham, n = 8; vehicle, n = 8; rtPA, n = 8; rtPA/argatroban, n = 14). ns, not significant.
Figure 5.
Figure 5.
Combined fibrinolytic and anticoagulant therapy causes sudden recanalization and paradoxical cerebral hypoperfusion. Treatment cohorts described in Figure 4C were further analyzed for cerebral perfusion (A, LDF, left hemisphere [LHS]; LSCI, right hemisphere [RHS]), mortality (A, [skull and crossbones], expressed as %) and infarct volume (B). For mice treated with the combination of rtPA/argatroban (n = 14), outcomes were further differentiated into mice that successfully recanalized (Recan) vs those that remained occluded (No Recan). (B) Cerebral infarct was assessed with TTC staining of excised brain sections from the mouse cohorts presented in Figure 4C. Animals that died before the 24-hour point were not included in the infarct assessment. Infarct assessment was performed on experiments conducted at Site 2. In panels A and B, open circles represent animals in which embolization was observed on the flow trace, as characterized by a sudden and sustained recanalization event; half circles represent recanalization without embolization; and closed circles represent sustained occlusion. (C) Based on blood flow (LDF), the incidence of sudden and sustained recanalization events in rtPA vs rtPA/argatroban cohorts was expressed as percentage of the total number of animals in each treatment group (as indicated). (D) Examples of real-time flow traces from the iCAT procedure (i) or electrolytic injury alone (ii), and the corresponding LDF (ii) shows the sudden recanalization events, in which an abrupt return of blood flow (↑, i,ii) was observed concomitant with a reduction in LDF (ii), and sustained deficient in cerebral perfusion (LSCI heat map images, i, ii), despite full carotid recanalization. LSCI images depict CBF at baseline (pre-injury) and 90 minutes’ post-carotid occlusion . ns, not significant; RBCs, red blood cells.
Figure 6.
Figure 6.
Combining anticoagulation and rtPA therapy induces carotid artery embolization. Electrolytic injury of the left carotid artery in C57BL/6 male mice was performed in a separate mouse cohort, with animals administered the platelet label DyLight488 before electrolytic injury (where indicated). (A) Real-time imaging of thrombolysis was conducted post-carotid occlusion, using the mouse carotid artery transilluminator, as described in the Methods. Thrombolytic therapy (vehicle control, rtPA, rtPA/argatroban) was delivered IV at 15 minutes’ post-occlusion and imaging conducted for 60 minutes after treatment onset. Images presented are 1 example, from 30 to 58 minutes’ posttreatment onset (platelets = white; erythrocytes = red). Inset: Embolization events at 48 minutes (48’00’’) posttreatment onset, with platelet mass outlined by broken lines, and quantification of embolization incidence presented in panel B. (C) Global cerebral perfusion (LCSI) was assessed pre-injury (baseline) and 90 minutes’ post-occlusion for the same mouse presented in panel A. The carotid artery was confirmed to be patent immediately before and immediately after collection of the LSCI reading. (D) At 90 minutes’ post-occlusion, the brain from the mouse depicted in panels A and C was excised and imaged with a Nikon AZ100 Multizoom Macroscope (i, ii) and postimaging processing performed by using Nikon NIS-Element’s Clarify.ai algorithm module. (ii) Confocal imaging of platelet embolus was performed by using a Leica SP8 confocal system and the three-dimensional data set acquired by using LAS X (version 3.5.7). Three-dimensional data were rendered by using Imaris version 9.8. Treatment dosing regimens: rtPA (10 mg/kg [1/9 mg/kg bolus/infusion over 30 minutes]); argatroban (80 µg/kg bolus; 40 µg/kg/min infusion over 60 minutes). Scale bars = 1 mm (panel Di); 30 = µm (panel Dii).
Figure 7.
Figure 7.
Schematic overview of the iCAT stroke model. (A) The iCAT model incorporates thrombotic occlusion of the CCA induced by electrolytic injury to allow for real-time monitoring of occlusion and recanalization events. (B) After thrombotic occlusion of the carotid artery, transient stenosis of the contralateral carotid artery induces ipsilateral cerebral hypoperfusion sufficient to induce infarction (<25% baseline flow), measurable with LDF over the MCA territory. Cerebral perfusion analysis with LSCI at 90 minutes’ post–stroke onset is predictive of 24-hour outcome (C), including behavioral deficit, infarct progression, and mortality (D). Elements of this image were created with BioRender.com and exported under a paid subscription. RBC, red blood cell.

References

    1. Rha J-H, Saver JL. The impact of recanalization on ischemic stroke outcome: a meta-analysis. Stroke. 2007;38(3):967-973. - PubMed
    1. National Institute of Neurological Disorders and Stroke rtPA Stroke Study Group. Tissue plasminogen activator for acute ischemic stroke. N Engl J Med. 1995;333(24):1581-1588. - PubMed
    1. Alexandrov AV, Grotta JC. Arterial reocclusion in stroke patients treated with intravenous tissue plasminogen activator. Neurology. 2002;59(6): 862-867. - PubMed
    1. Rubiera M, Alvarez-Sabín J, Ribo M, et al. . Predictors of early arterial reocclusion after tissue plasminogen activator-induced recanalization in acute ischemic stroke. Stroke. 2005;36(7):1452-1456. - PubMed
    1. Saqqur M, Uchino K, Demchuk AM, et al. ; CLOTBUST Investigators . Site of arterial occlusion identified by transcranial Doppler predicts the response to intravenous thrombolysis for stroke. Stroke. 2007;38(3):948-954. - PubMed

Publication types

MeSH terms