. 2022 Jun 28;39(13):111001.
doi: 10.1016/j.celrep.2022.111001.

Loss of Stathmin-2, a hallmark of TDP-43-associated ALS, causes motor neuropathy

Affiliations

Loss of Stathmin-2, a hallmark of TDP-43-associated ALS, causes motor neuropathy

Kelsey L Krus et al. Cell Rep. .

Abstract

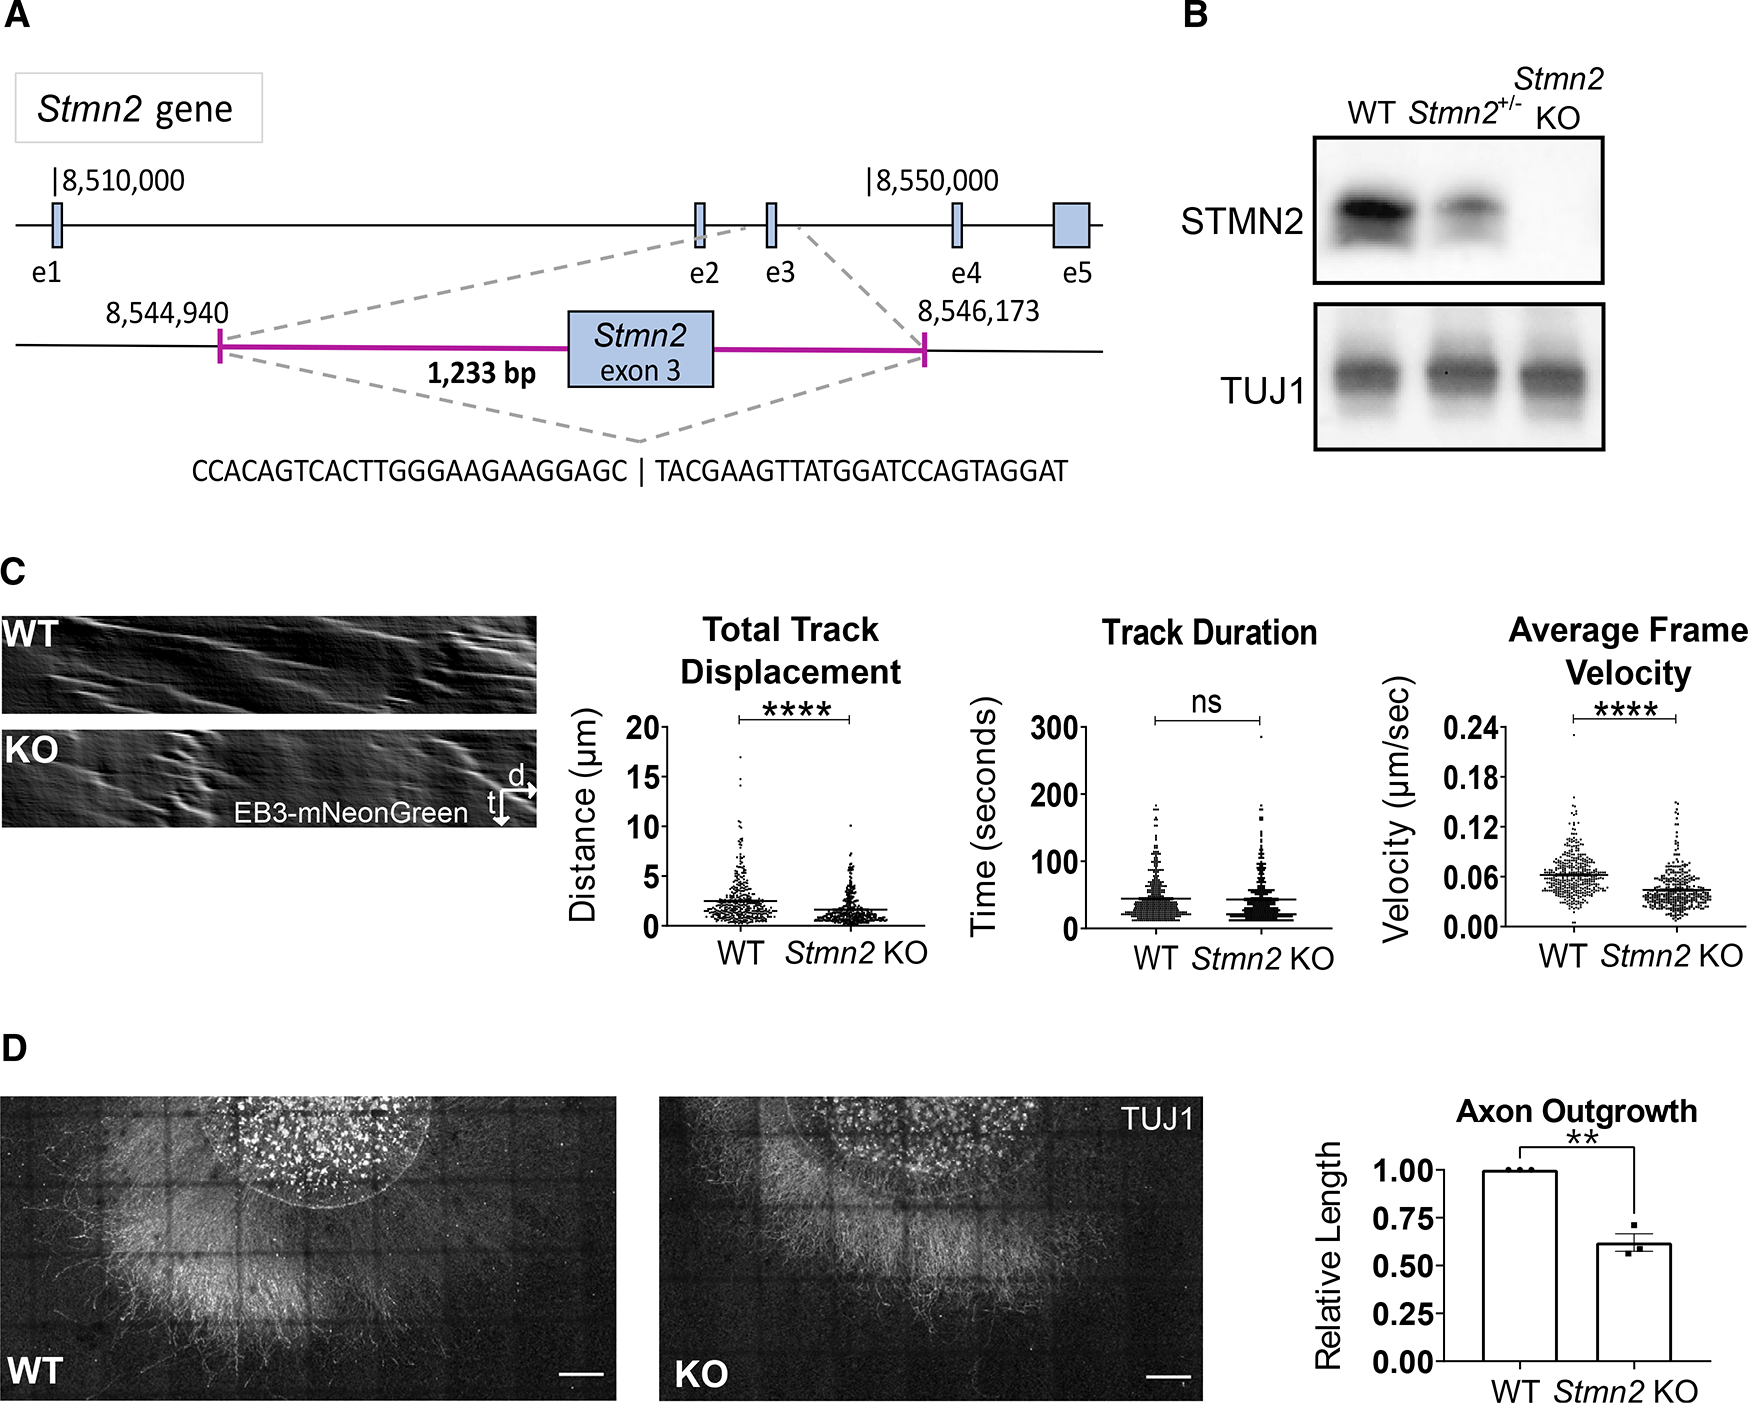
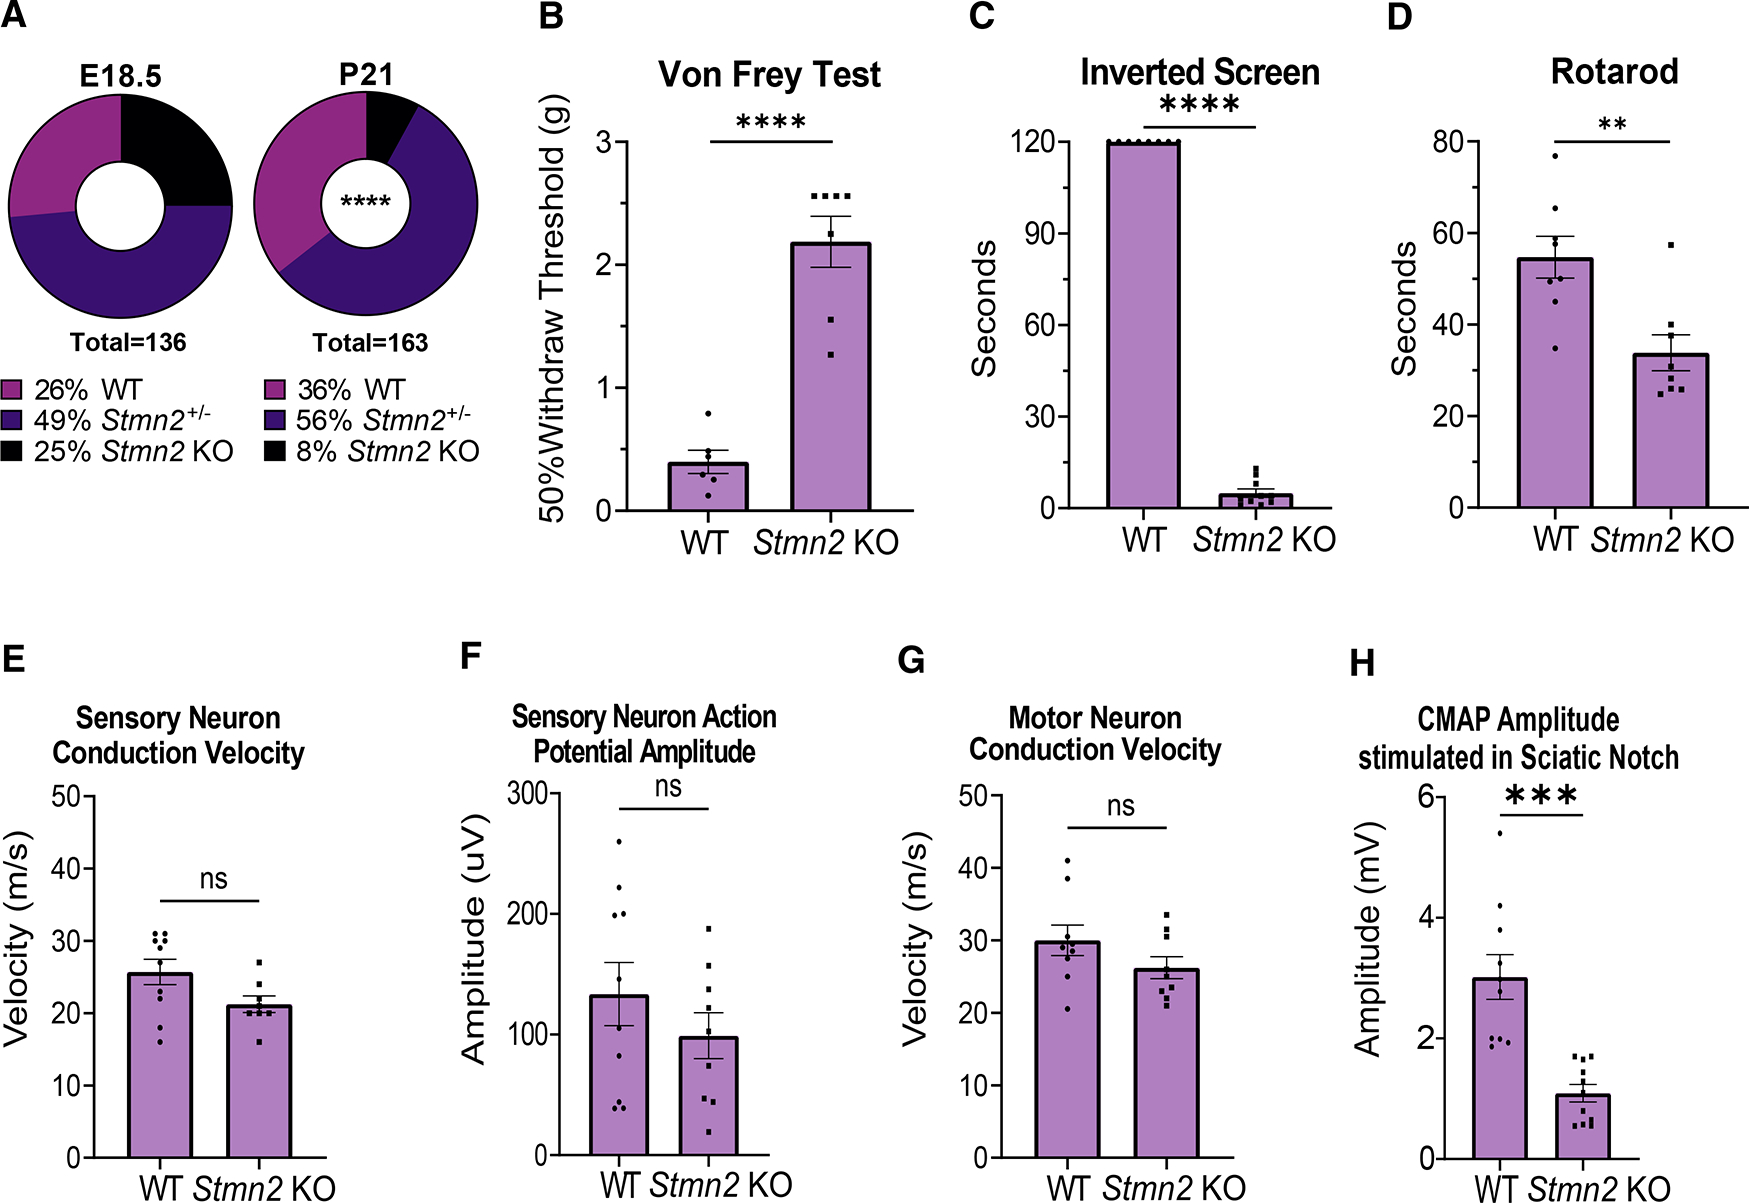
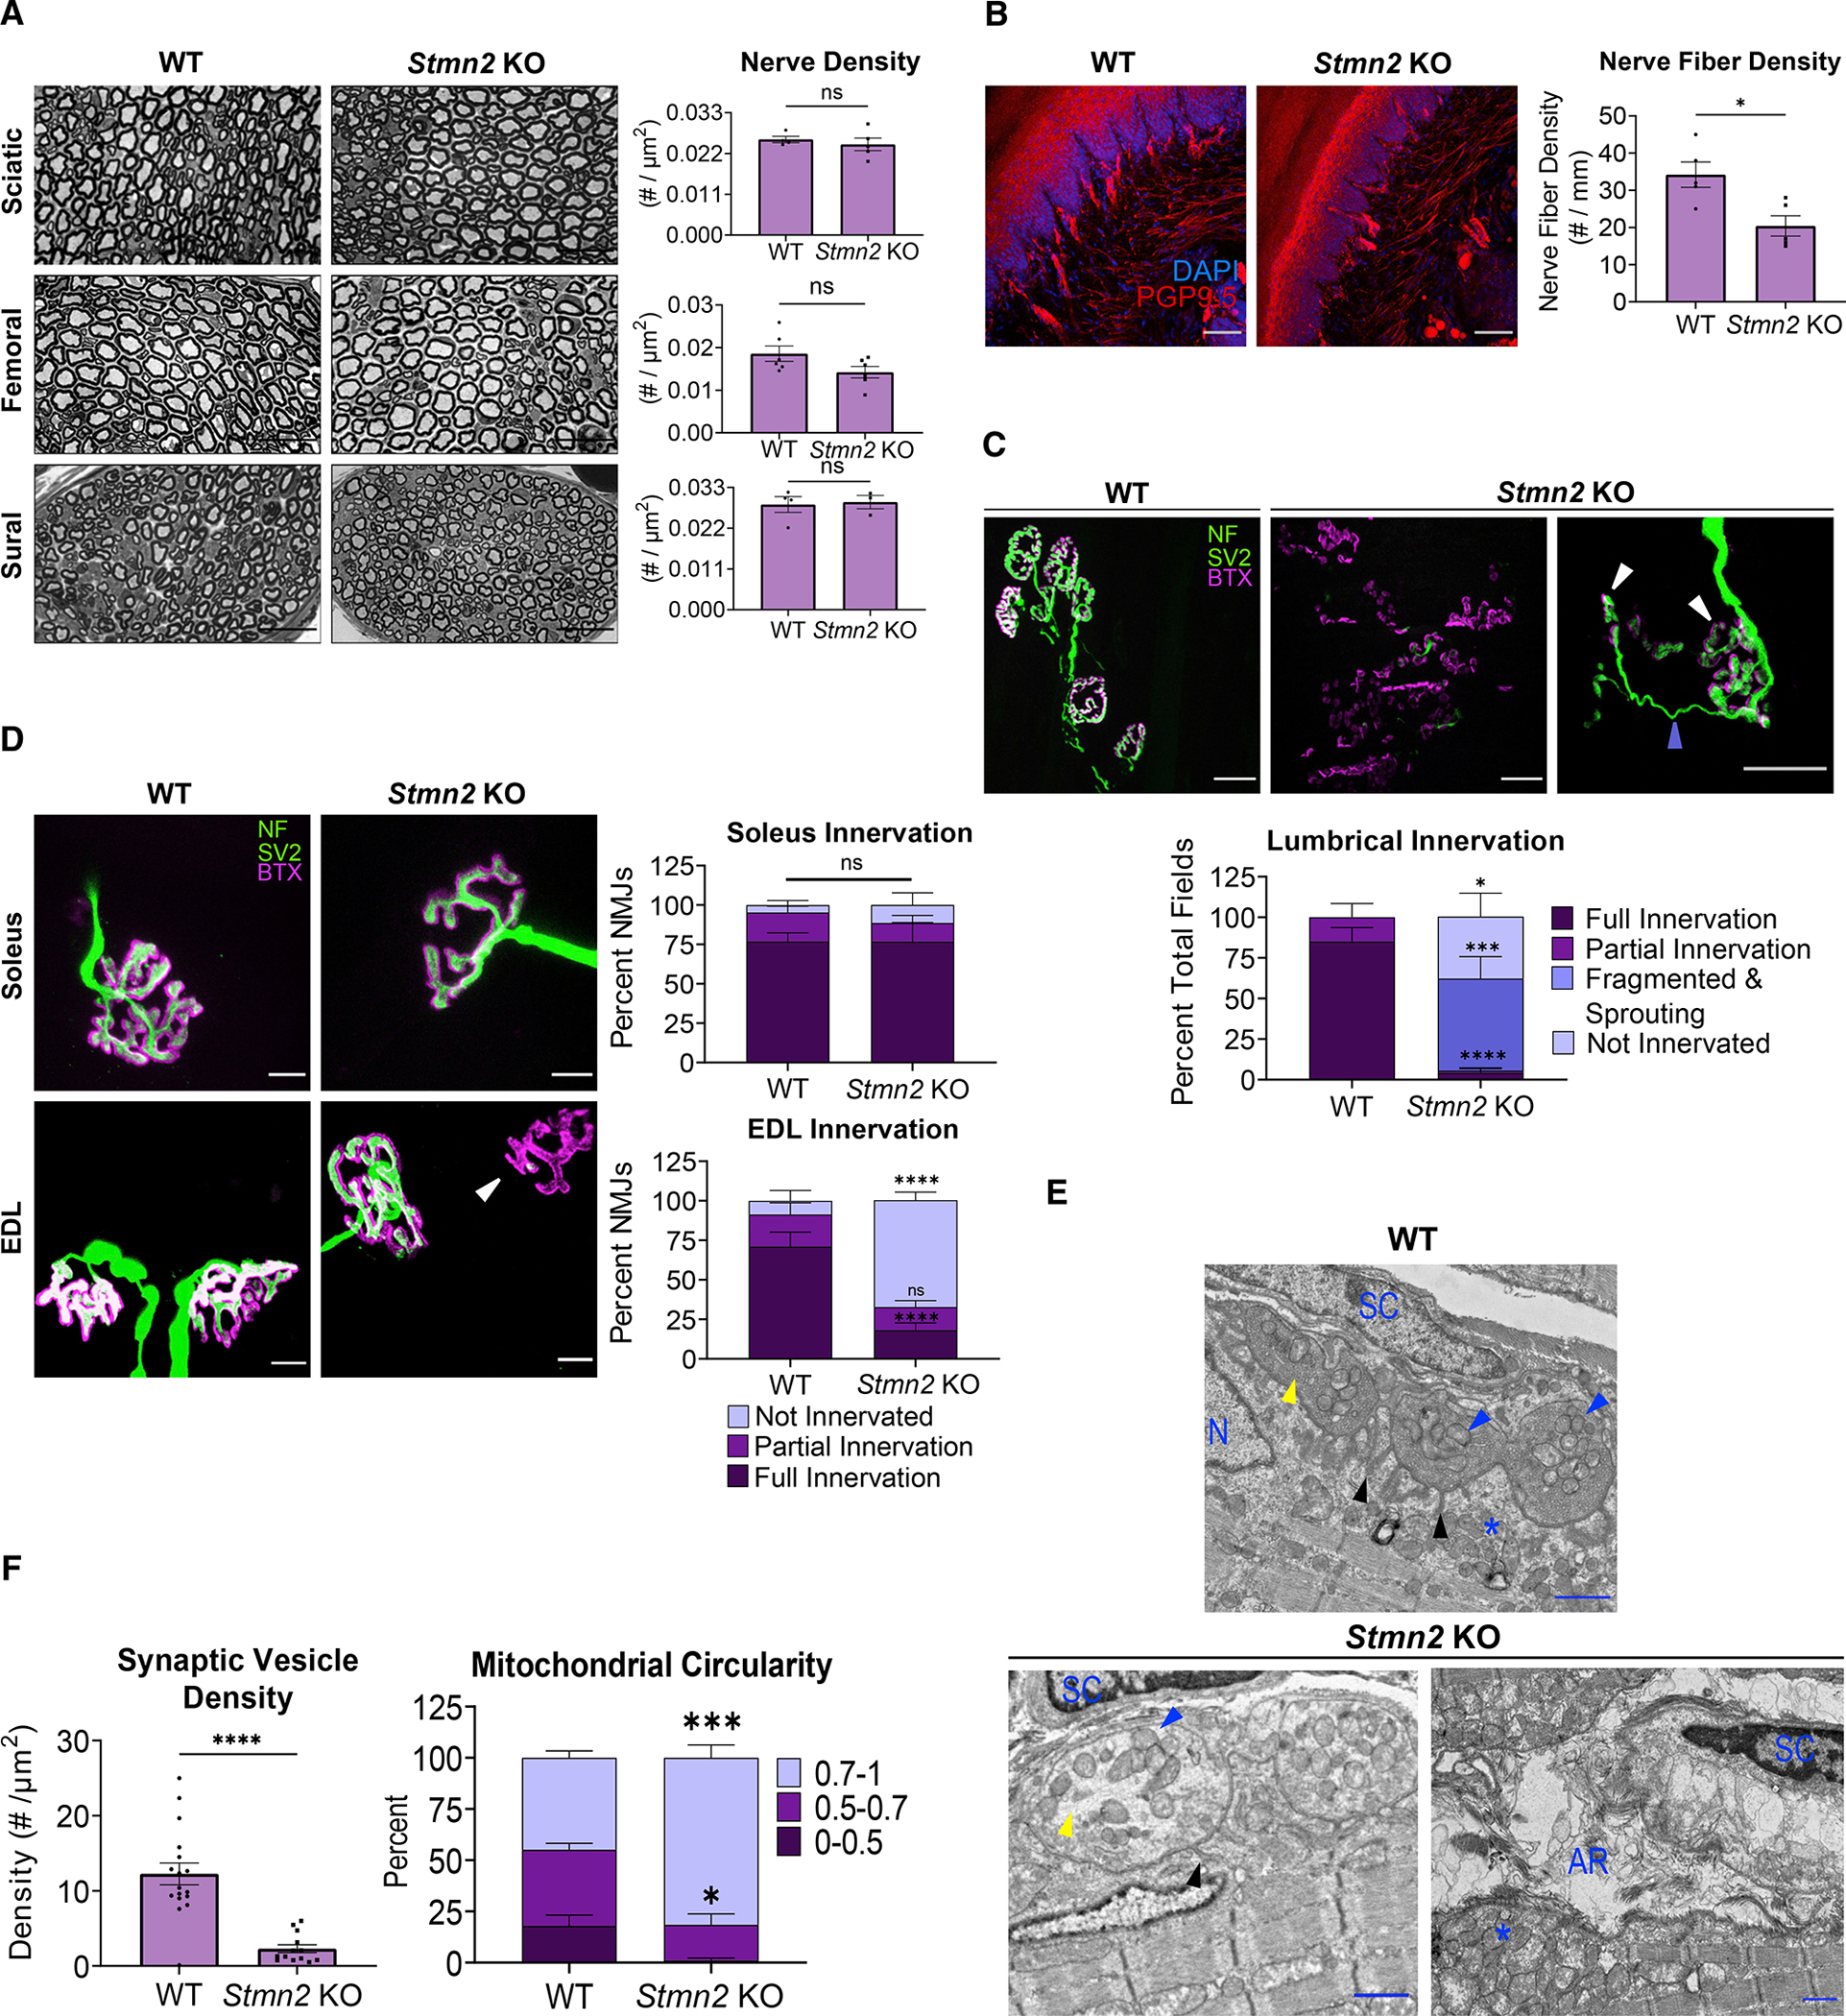
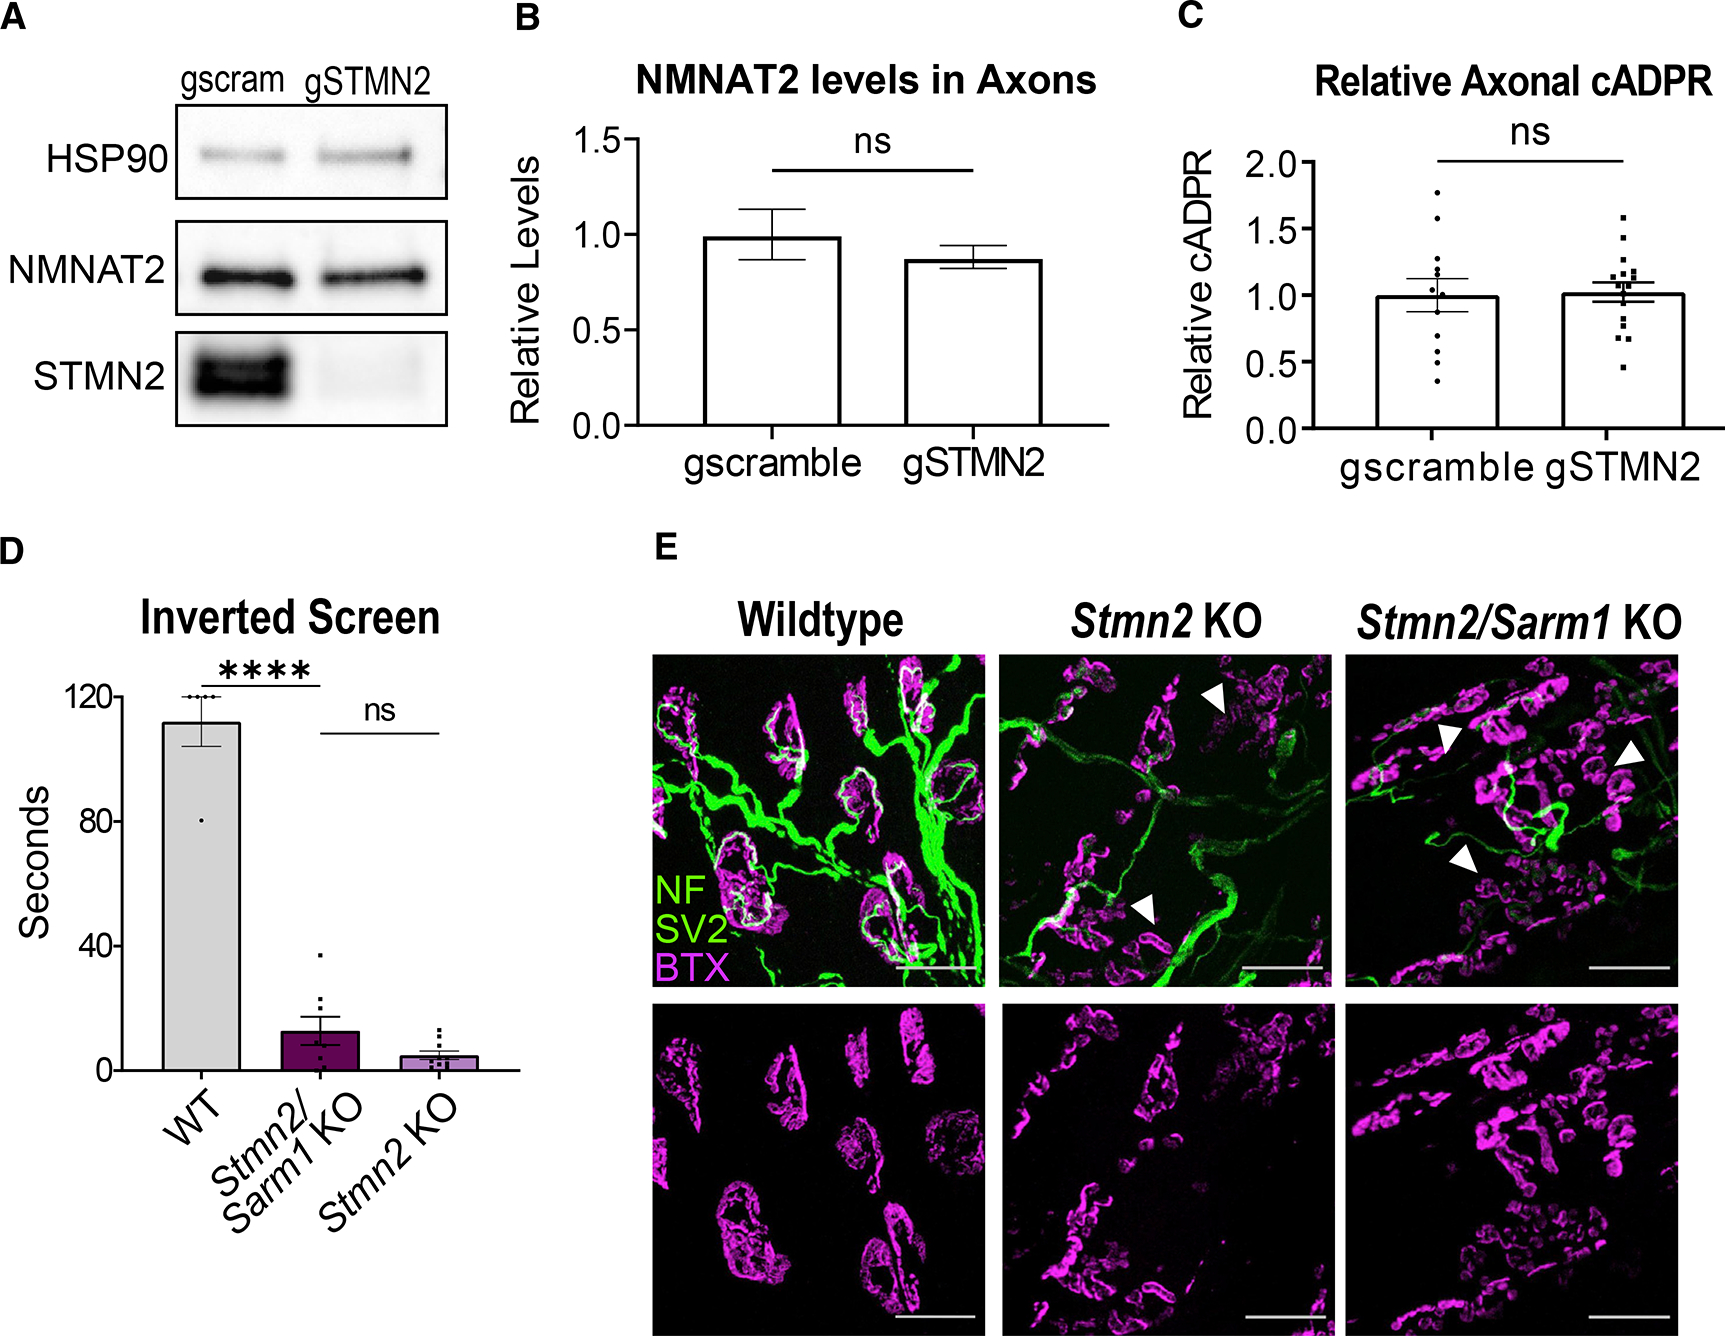
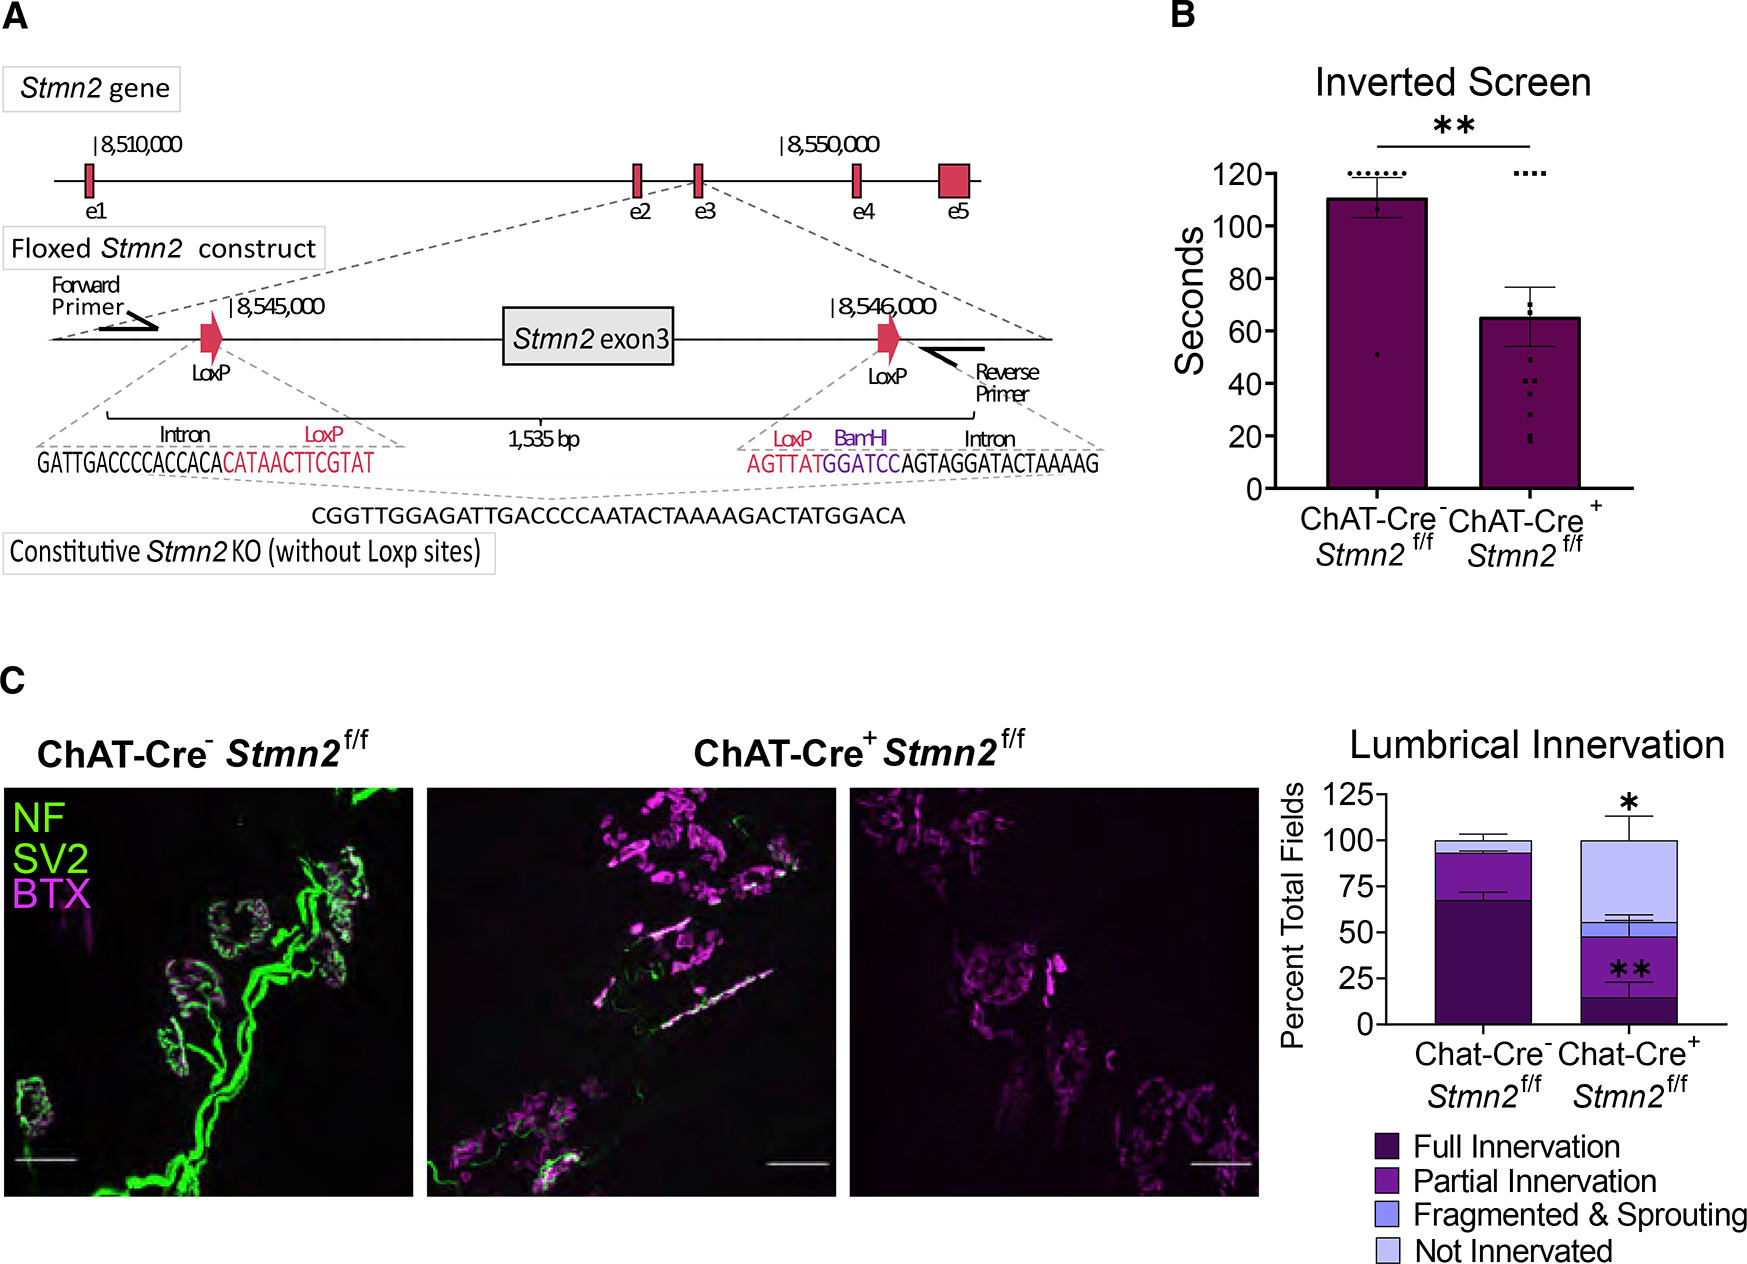
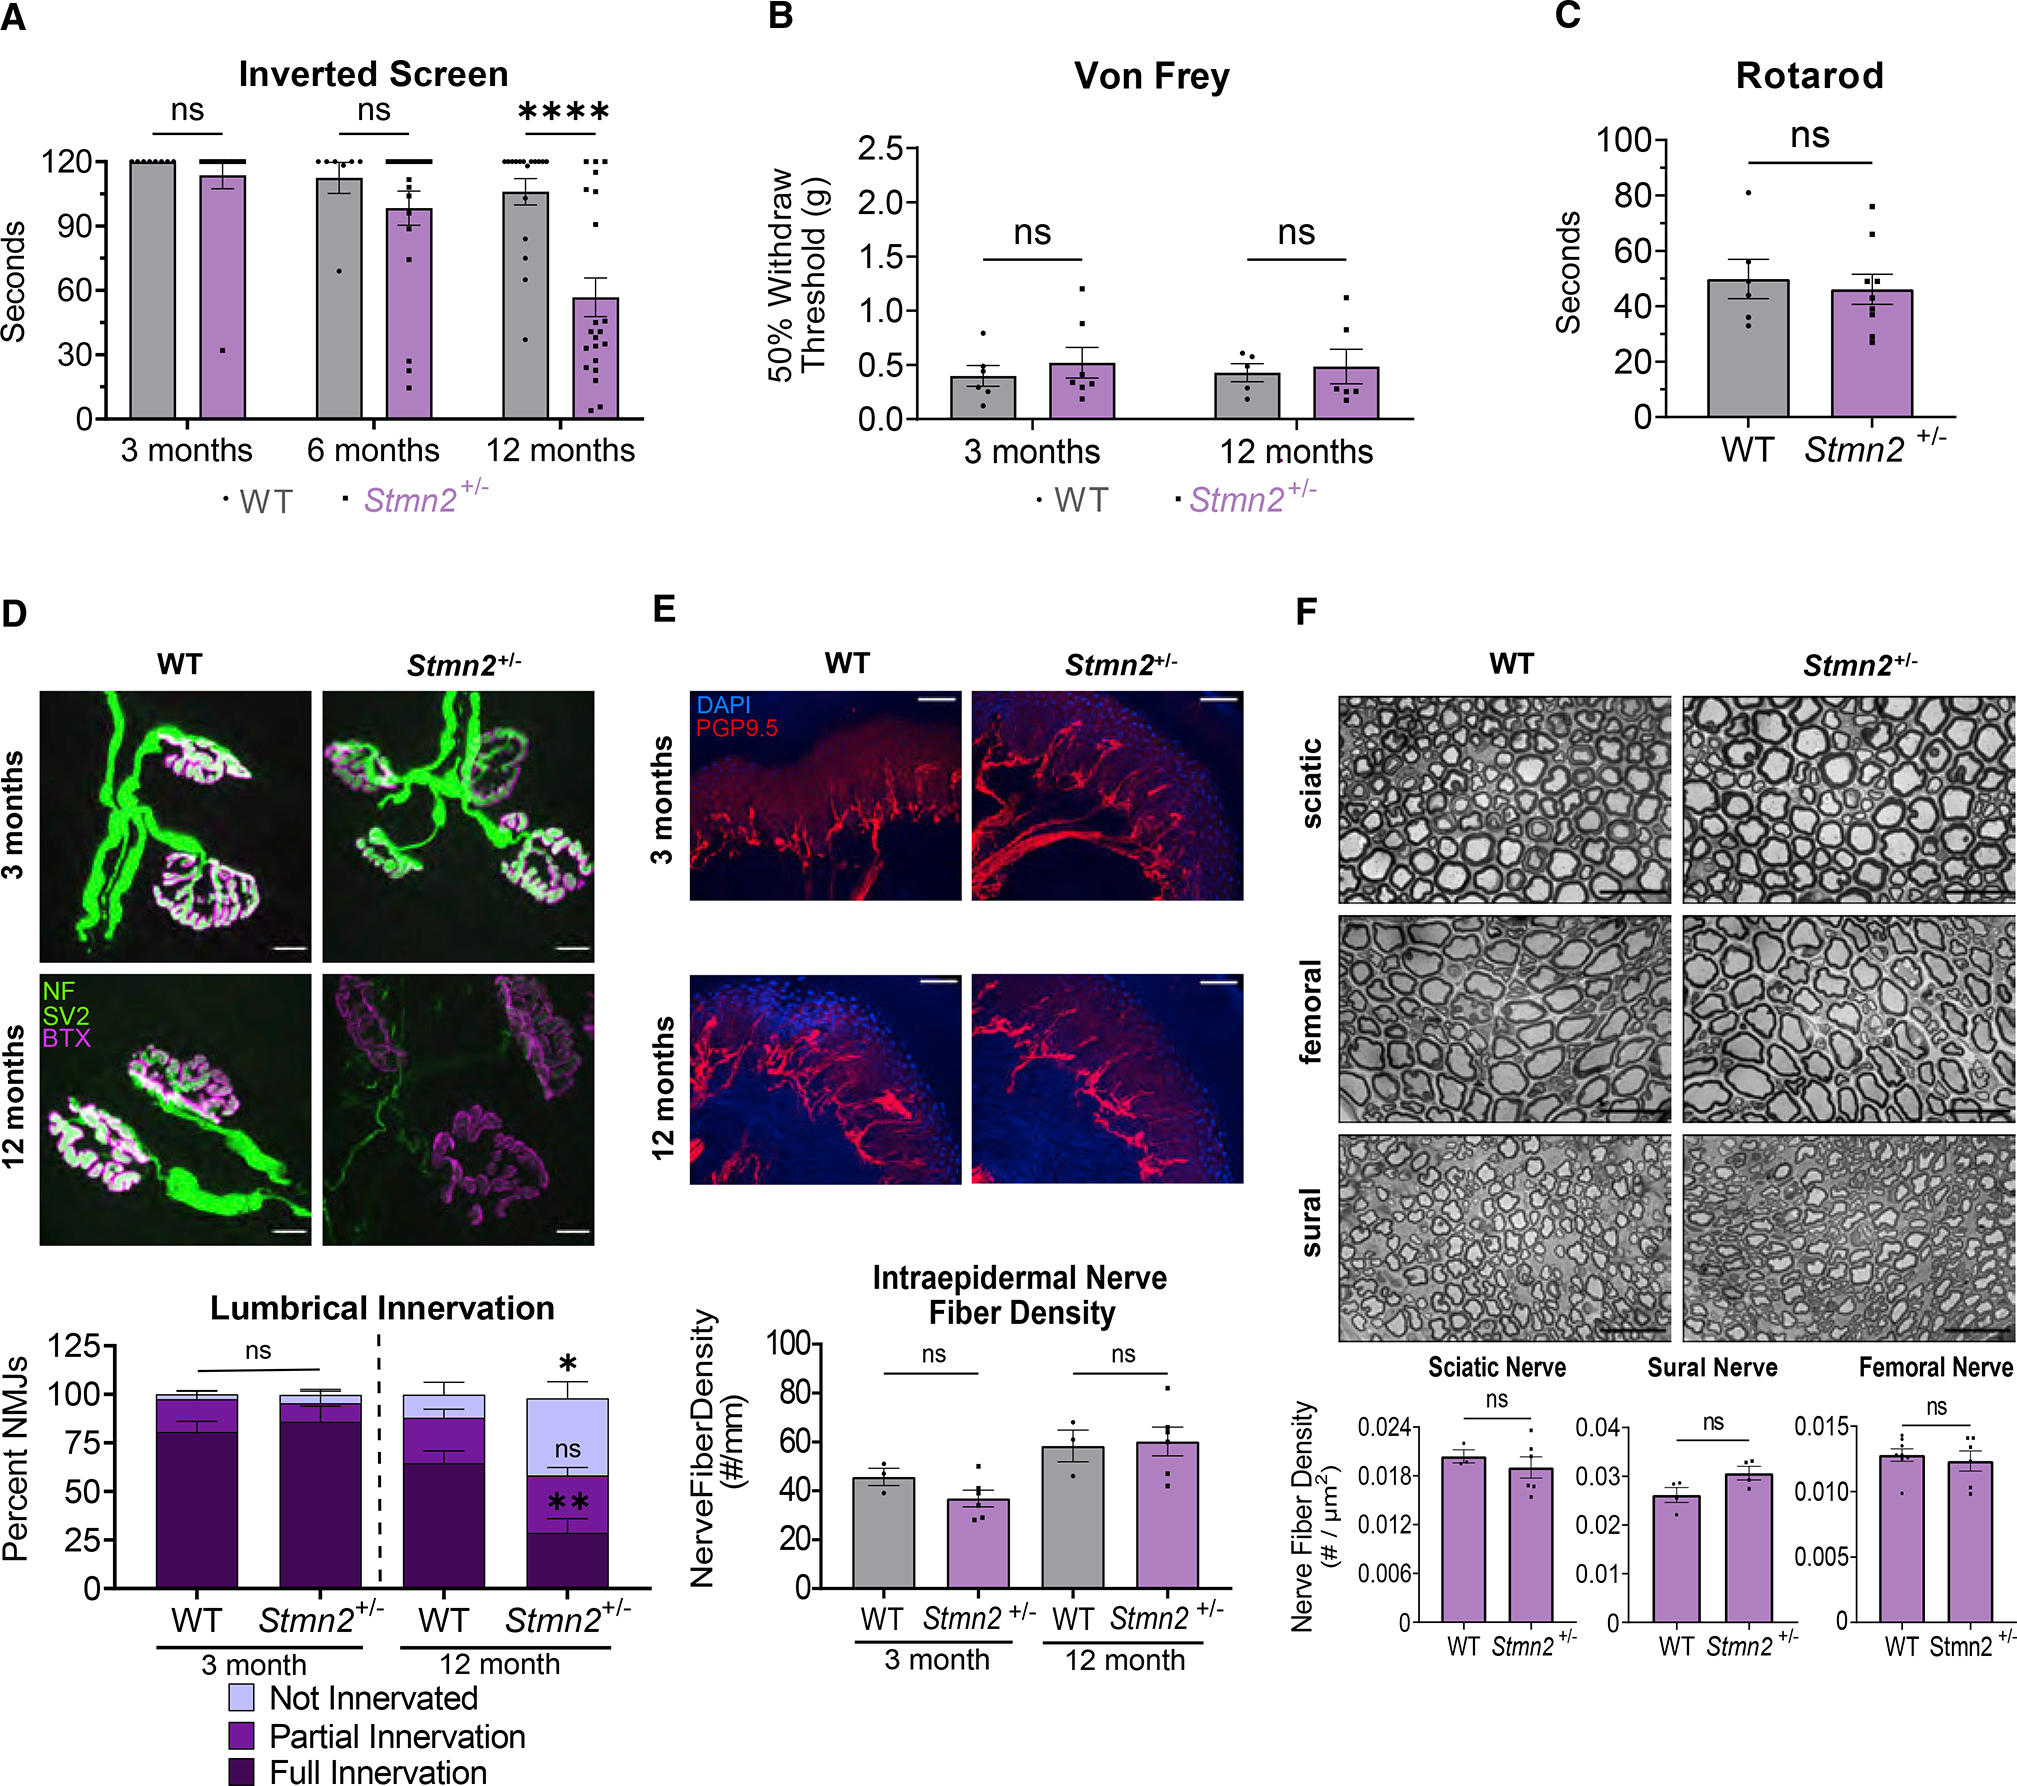
TDP-43 mediates proper Stathmin-2 (STMN2) mRNA splicing, and STMN2 protein is reduced in the spinal cord of most patients with amyotrophic lateral sclerosis (ALS). To test the hypothesis that STMN2 loss contributes to ALS pathogenesis, we generated constitutive and conditional STMN2 knockout mice. Constitutive STMN2 loss results in early-onset sensory and motor neuropathy featuring impaired motor behavior and dramatic distal neuromuscular junction (NMJ) denervation of fast-fatigable motor units, which are selectively vulnerable in ALS, without axon or motoneuron degeneration. Selective excision of STMN2 in motoneurons leads to similar NMJ pathology. STMN2 knockout heterozygous mice, which better model the partial loss of STMN2 protein found in patients with ALS, display a slowly progressive, motor-selective neuropathy with functional deficits and NMJ denervation. Thus, our findings strongly support the hypothesis that STMN2 reduction owing to TDP-43 pathology contributes to ALS pathogenesis.

Keywords: CP: Neuroscience; NMNAT2; SARM1; SCG-10; axon degeneration; motor neuron; neurodegeneration; neuropathy; stathmin.


Conflict of interest statement

Declaration of interests A.D. and J.M. are co-founders, scientific advisory board members, and shareholders of Disarm Therapeutics, a wholly owned subsidiary of Eli Lilly. A.J.B. is a consultant to Disarm Therapeutics. The authors have no other competing conflicts or financial interests.

Figures

Figure 1.
Figure 1.. Constitutive Stmn2 KO results in delayed microtubule polymerization and axon outgrowth
(A) Schematic of Stmn2 gene deletion region. The magenta area represents the deleted region. (B) STMN2 protein in brain lysates from 3-month-old mice heterozygous and homozygous for Stmn2 deletion allele. (C) Representative kymographs of EB3-mNeonGreen movement from WT and Stmn2 KO embryonic DRG neurons. Quantified to the right is total track displacement (μm), track duration (s), and average frame velocity (μm/s). (D) Representative images of spot culture axon length on DIV3. Relative axon length quantified to the right. Scale bar, 500 μm. All data are presented as mean ± SEM. Statistical significance was determined by the Student unpaired t-test. ns, not significant. **p < 0.01, ****p < 0.0001.
Figure 2.
Figure 2.. Total STMN2 loss causes perinatal lethality as well as sensory and motor deficits
(A) Genotype distribution of E18.5 embryos (n = 136) and P21 mice (n = 163). Statistical significance was determined by the χ2 test for goodness of fit. (B) Average 50% hind paw withdrawal threshold when force (grams) applied (WT n = 6, KO n = 7). (C and D) (C) Latency time (s) to fall from an inverted screen (WT n = 8, KO n = 10; max. 120 s), and (D) length of time (s) on an accelerating rotarod before falling (WT n = 8, KO n = 8), for WT and Stmn2 KO mice. (E and F) (E) Average sensory nerve conduction velocity and (F) Action potential amplitude for WT (n = 10) and Stmn2 KO mice (n = 8,9). (G and H) (G) Average motor neuron conduction velocity (WT and KO n = 9) and (H) Compound muscle action potential (CMAP) amplitude stimulated in the sciatic notch for WT (n = 9,10) and Stmn2 KO (n = 9,11) mice. All data reported here are from 3-month-old mice. Unless otherwise stated, statistical significance was determined by the Student unpaired t-test. All data are presented as mean ± SEM. ns, not significant. **p < 0.01, ***p < 0.001, ****p < 0.0001. See also Figures S1 and S2.
Figure 3.
Figure 3.. STMN2 deletion results in IENF loss and distal NMJ denervation
(A) Representative images of sciatic, femoral, and sural nerves in 3-month-old WT (n = 4, 6, and 4, respectively) and Stmn2 KO (n = 5, 6, and 3, respectively) animals with quantification of nerve density (#/mm2) shown to the right. Scale bar, 25 μm. Statistical significance determined by the Student unpaired t-test. (B) IENF density of footpad skin of 3-month-old WT (n = 5) and Stmn2 KO (n = 5) mice. Nerve fiber density quantified as the number of nerves per millimeter of basement membrane. Scale bar, 50 μm. Statistical significance determined by the Student unpaired t-test. (C) Representative images from lumbrical muscles of 3-month-old WT and Stmn2 KO mice. NMJs visualized by neurofilament/SV2 (green) and bungarotoxin (magenta). The white arrow shows fragmented AChR clusters, and the periwinkle arrow indicates sprout from an adjacent NMJ. Quantification is based on the innervation of a region of AChR clusters contained within a 20× field. Scale bar, 25 μm. (WT animals n = 7, KO n = 10). (D) Representative images from soleus and EDL muscles from 3-month-old WT (n = 3–4) and Stmn2 KO (n = 4) mice. Scale bar, 10 μm. Quantification of percent NMJs of each innervation status on the right. Arrow highlights denervated endplate. (E) Representative electron micrographs of NMJs from 3-month-old WT and Stmn2 KO lumbricals. Scale bar, 1 μm. Black arrow = junctional folds, blue arrow = presynaptic mitochondria, yellow arrow = synaptic vesicles (or lack thereof). *Post-synaptic mitochondrial clustering. AR, axon remnants; N, myocyte nuclei; SC, Schwann cell. (F) Quantification of synaptic vesicle density in the presynapse (#/μm2) (WT n = 17, KO n = 13 synapses). Statistical significance determined by the unpaired Student’s t test. Mitochondrial Circularity quantified on the right (mitochondria of WT and KO n = 3 synapses). “1” represents a perfect circle. Unless otherwise stated, statistical significance was determined using two-way ANOVA with Sidak’s multiple comparisons test. All data are presented as mean ± SEM. ns, not significant. *p < 0.05, **p < 0.01, ***p < 0.001, ****p < 0.0001. See also Figure S3.
Figure 4.
Figure 4.. Phenotypes associated with STMN2 loss are not mediated by SARM1 activation
(A) Representative western blots of NMNAT2 and STMN2 using axonal lysates from neurons derived from Cas9 transgenic mice infected with lentivirus expressing Stmn2 or scrambled control gRNAs. (B) Relative NMNAT2 protein band intensity (n = 4 experiments). (C) Average relative cADPR levels from axonal lysates from neurons derived from Cas9 transgenic mice infected with lentivirus expressing Stmn2 (n = 16) or scrambled control (n = 12) gRNAs. Statistical significance determined by the Student unpaired t-test. (D) Latency time to fall from an inverted screen (max. 120s) for WT (n = 5), Stmn2/Sarm1 KO (n = 8), and Stmn2 KO (n = 10, from Figure 2) animals. Statistical significance determined by one-way ANOVA with Tukey’s multiple comparison test. (E) Representative images of lumbrical NMJs from WT, Stmn2/Sarm1 KO, and Stmn2 KO mice. NMJs visualized by neurofilament/SV2 (green) and bungarotoxin (magenta). Arrows point to fragmented and denervated AChR clusters. Scale bar, 25 μm. All data are presented as mean ± SEM. ns, not significant. ****p < 0.0001.
Figure 5.
Figure 5.. Stmn2 KO in motor neurons causes motor pathology
(A) Schematic of floxed Stmn2 allele. (B) Latency time to fall from an inverted screen (max. 120 s) for ChAT-Cre/Stmn2f/f (n = 9) and ChAT-Cre+/Stmn2f/f (n = 13) mice at 3 months of age. Statistical significance was determined by the Student unpaired t-test. (C) Representative images of NMJs from 3-month-old ChAT-Cre/Stmn2f/f (n = 3) and ChAT-Cre+/Stmn2f/f (n = 6) lumbrical muscles. NMJs were visualized by neurofilament/SV2 (green) and bungarotoxin (magenta) staining. Scale bar, 25 μm. Quantification is to the right. All data are presented as mean ± SEM. *p < 0.05, **p < 0.01. See also Figure S4.
Figure 6.
Figure 6.. Partial STMN2 depletion results in progressive, distal motor neuropathy
(A) Latency time to fall from an inverted screen (max. 120 s) for WT and Stmn2+/− mice at 3 (n = 8 and 14), 6 (n = 7 and 20), and 12 (n = 17 and 21) months of age. (B) Average 50% hindpaw withdrawal threshold when force (grams) applied to 3- and 12-month-old WT (n = 6 and 5) and Stmn2+/− (n = 7 and 6) mice. (C) Time to fall (s) from an accelerating rod for 12-month-old WT and Stmn2+/− mice. Statistical significance was determined by the Student unpaired t-test. (D) Lumbrical NMJs visualized by neurofilament/SV2 (green) and bungarotoxin (magenta) staining. Scale bar, 10 μm. Quantification is below. Three months, WT and KO n = 4; 12 months, WT n = 5, KO n = 8. (E) IENF labelled with anti-PGP9.5 and DAPI. Scale bar, 50 μm. (WT n = 3, KO n = 6). (F) Representative images of sciatic (WT n = 3, KO n = 6), femoral (WT n = 8, KO n = 6), and sural nerves (WT and KO n = 4) in 12-month-old WT and Stmn2+/− animals with quantification of nerve density (#/μm2) shown underneath. Scale bar, 25 μm. Statistical significance determined by the Student unpaired t-test. Unless otherwise noted, statistical significance was determined by two-way ANOVA with Sidak’s multiple comparisons test. All data are presented as mean ± SEM. ns, not significant. *p < 0.05, **p < 0.01, ****p < 0.0001. See also Figure S5.

Similar articles

Cited by

References

    1. Abbade J, Klemetti MM, Farrell A, Ermini L, Gillmore T, Sallais J, Tagliaferro A, Post M, and Caniggia I (2020). Increased placental mitochondrial fusion in gestational diabetes mellitus: an adaptive mechanism to optimize feto-placental metabolic homeostasis? BMJ Open Diabetes. Res Care. 8, e000923. 10.1136/bmjdrc-2019-000923. - DOI - PMC - PubMed
    1. Anderson DJ, and Axel R (1985). Molecular probes for the development and plasticity of neural crest derivatives. Cell 42, 649–662. 10.1016/0092-8674(85)90122-9. - DOI - PubMed
    1. Araki T, Sasaki Y, and Milbrandt J (2004). Increased nuclear NAD biosynthesis and SIRT1 activation prevent axonal degeneration. Science 305, 1010–1013. 10.1126/science.1098014. - DOI - PubMed
    1. Atsumi T (1981). The ultrastructure of intramuscular nerves in amyotrophic lateral sclerosis. Acta Neuropathol. 55, 193–198. 10.1007/bf00691318. - DOI - PubMed
    1. Basu H, Ding L, Pekkurnaz G, Cronin M, and Schwarz TL (2020). Kymolyzer, a semi-autonomous kymography tool to analyze intracellular motility. Curr. Protoc. Cell Biol 87, e107. 10.1002/cpcb.107. - DOI - PMC - PubMed

Publication types