. 2022 Aug 17;110(16):2625-2645.e7.
doi: 10.1016/j.neuron.2022.06.002. Epub 2022 Jun 28.

Overlapping transcriptional programs promote survival and axonal regeneration of injured retinal ganglion cells

Affiliations

Overlapping transcriptional programs promote survival and axonal regeneration of injured retinal ganglion cells

Anne Jacobi et al. Neuron. .

Abstract

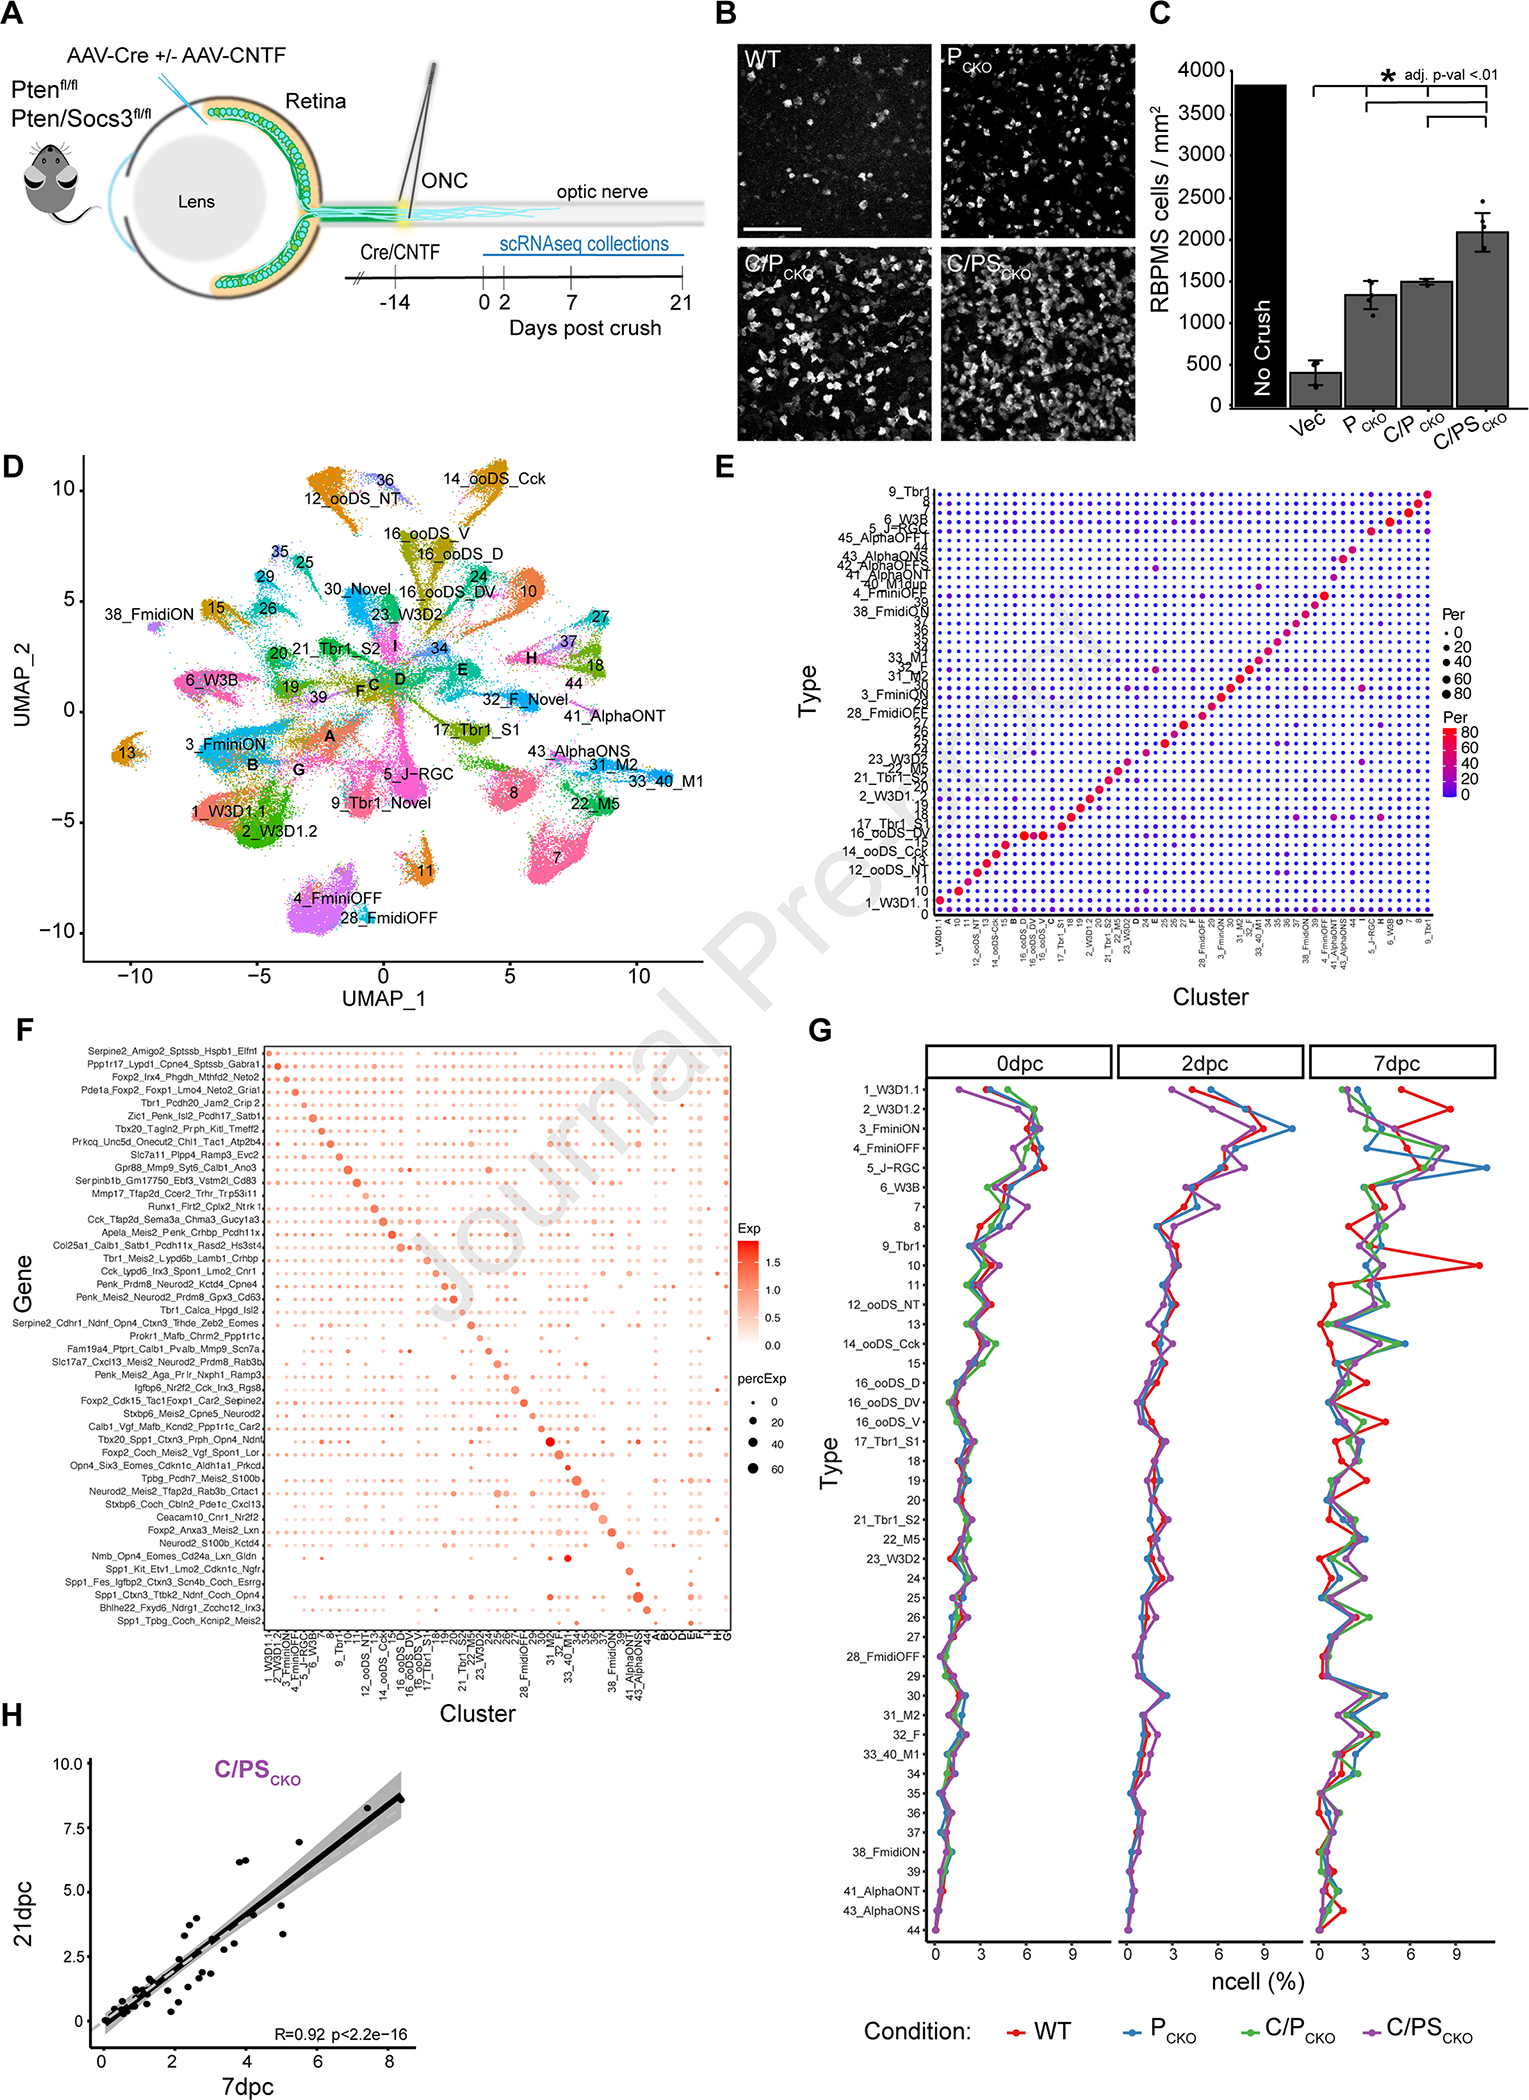
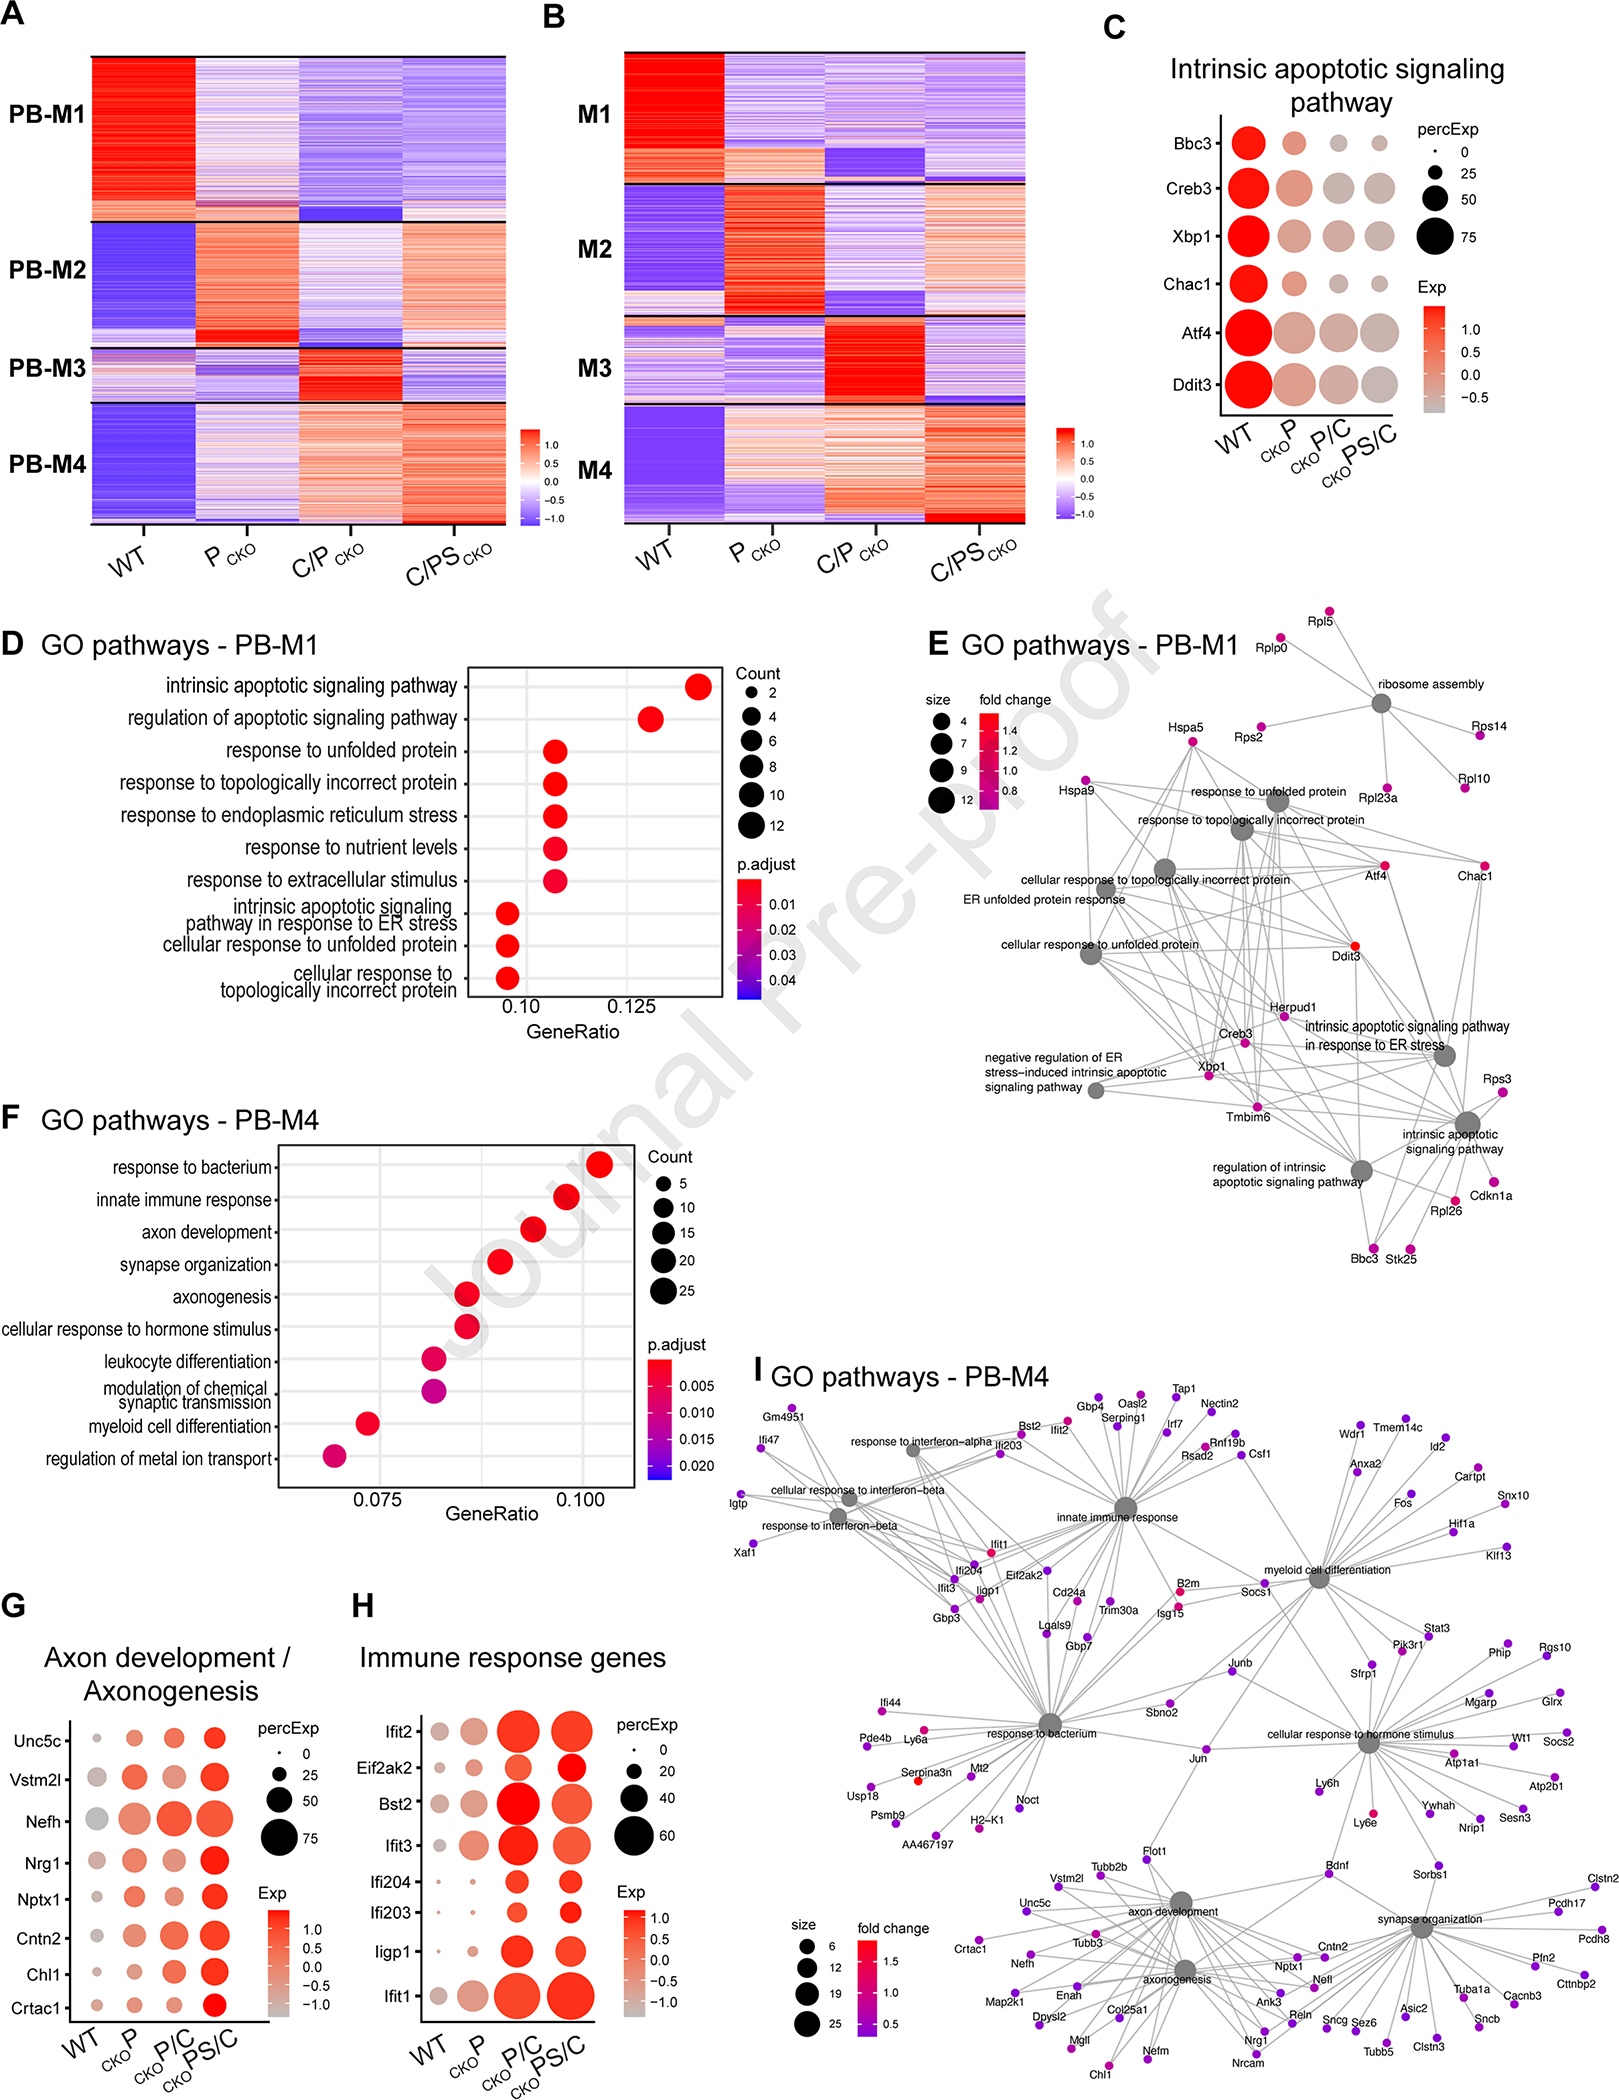
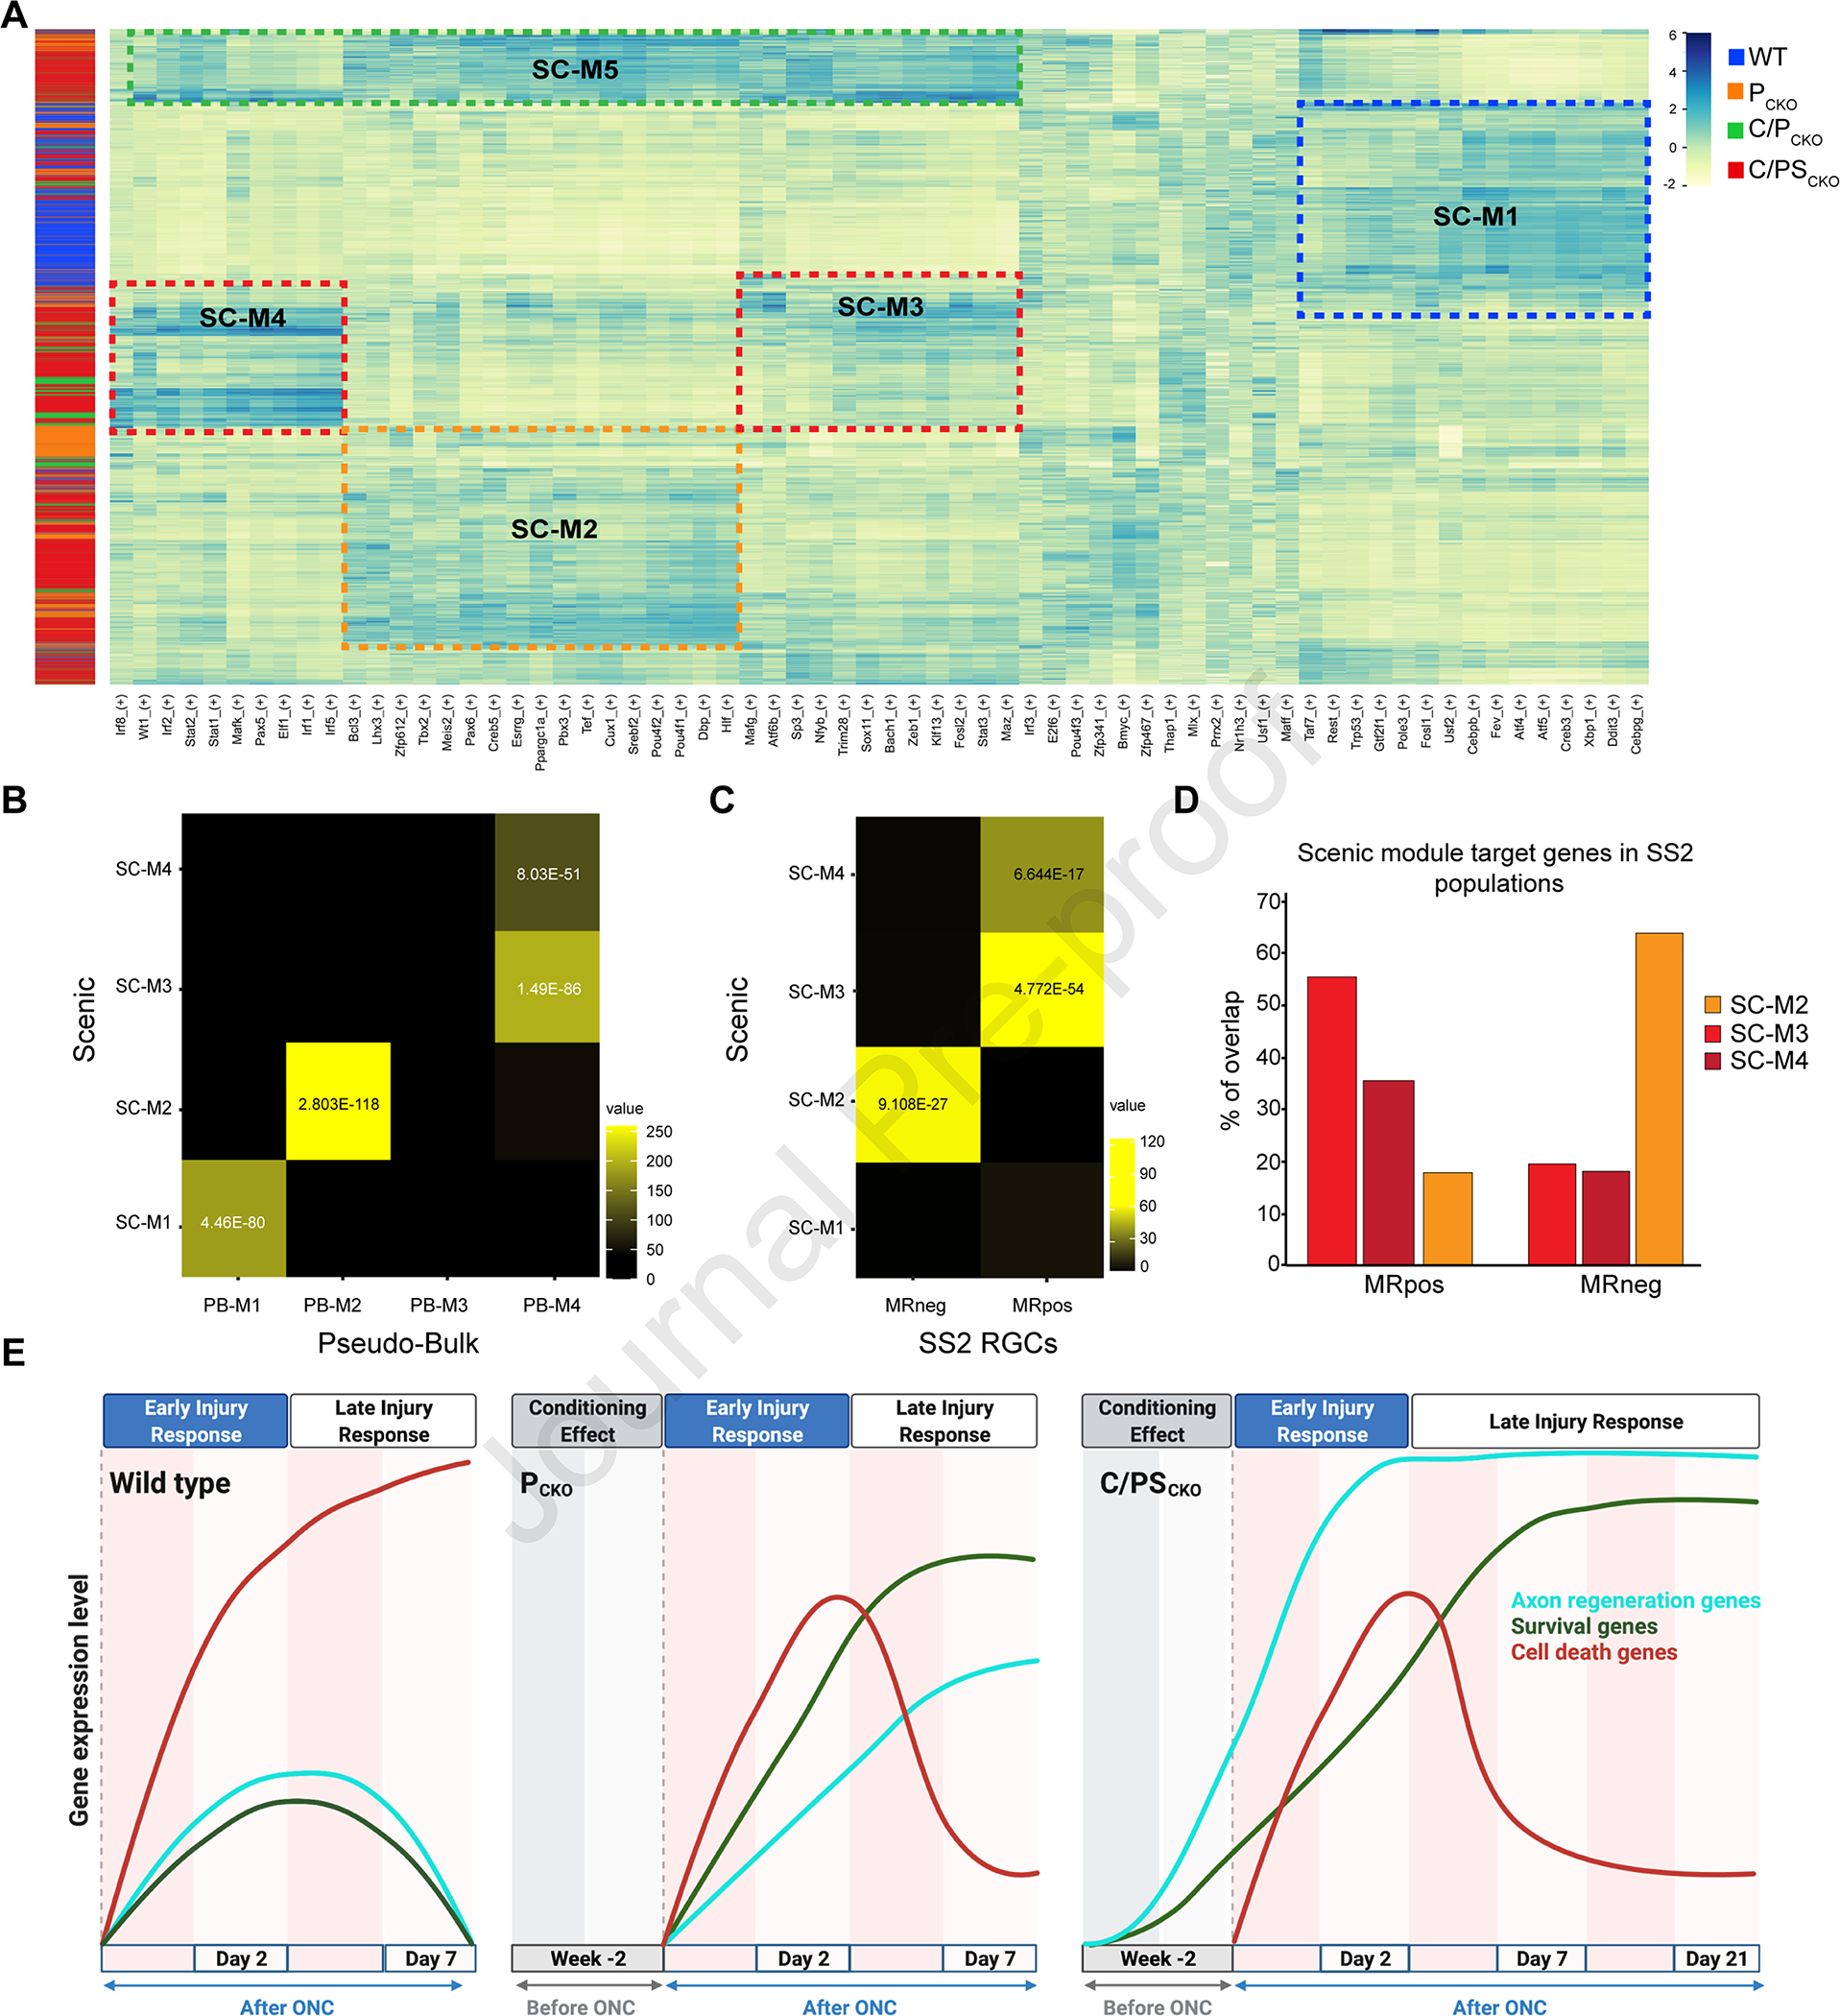
Injured neurons in the adult mammalian central nervous system often die and seldom regenerate axons. To uncover transcriptional pathways that could ameliorate these disappointing responses, we analyzed three interventions that increase survival and regeneration of mouse retinal ganglion cells (RGCs) following optic nerve crush (ONC) injury, albeit not to a clinically useful extent. We assessed gene expression in each of 46 RGC types by single-cell transcriptomics following ONC and treatment. We also compared RGCs that regenerated with those that survived but did not regenerate. Each intervention enhanced survival of most RGC types, but type-independent axon regeneration required manipulation of multiple pathways. Distinct computational methods converged on separate sets of genes selectively expressed by RGCs likely to be dying, surviving, or regenerating. Overexpression of genes associated with the regeneration program enhanced both survival and axon regeneration in vivo, indicating that mechanistic analysis can be used to identify novel therapeutic strategies.

Keywords: CNTF; Pten; Socs3; Wt1; axonal regeneration; single-cell RNA sequencing.


Conflict of interest statement

Declaration of interests J.R.S. is a consultant for Biogen. Z.H. is an advisor of SpineX, Life Biosciences, and Myro Therapeutics.

Figures

Figure 1:
Figure 1:. Interventions preserve type identity and increase survival of most RGC types after ONC
A) AAV2-Cre was injected into the vitreous body of PTENf/f (PCKO) or Ptenf/fSocs3f/f (PSCKO) mice to delete the floxed genes 2 weeks before crushing the optic nerve (ONC). AAV2 encoding ciliary neurotrophic factor (CNTF) was co-injected as indicated (C/PCKO or C/PSCKO). RGCs were collected for scRNA-seq at indicated times thereafter. B) Immunohistochemistry in retinal whole-mounts for the pan-RGC marker, RBPMS, shows increased survival of RGCs at 21dpc following PCKO, C/PCKO and C/PSCKO. Scale bar = 100μm C) RGC density (RBPMS+/mm2 cells, *adjusted p-value <0.01) at 21dpc compared to uncrushed control, measured from images such as those in B. D) scRNA-Seq data from all RGCs analyzed in this study displayed as a UMAP. Numbers indicate RGC ‘Novel ‘types as defined in the atlas presented in Tran, et al. (2019). Letters (A-G) show clusters that could not be assigned to a type. E) Comparison of cell type mapping in the current dataset to the RGC atlas from Tran et al., (2019) shown as a confusion matrix. Dot sizes and colors represent the percentage of cells in each cluster on the x-axis that match the atlas types on the y-axis. F) Expression of gene marker combinations from the control RGC atlas in the current dataset. Color of the dot represents the average expression of the gene marker combination, and the dot size represents the proportion of cells expressing these markers. G) Proportion of types in WT and each intervention at 0, 2 and 7dpc. H) Scatterplot showing correspondence (RPearson = 0.92) between frequencies of C/PSCKO RGCs of at 7 and 21dpc. Each dot shows one RGC type. The dark line shows best fit with confidence interval indicated in grey.
Figure 2:
Figure 2:. Type-independent axon regeneration in C/PSCKO
A) Maximum projections through cleared optic nerves showing anterograde-labeled RGC axons at 21dpc following injection of AAVs encoding Cre and/or CNTF into Ptenfl/fl or Ptenfl/fl Socs3fl/fl mice. An empty vector was injected into WT mice. Scale bar: 250μm; asterisk = crush site; red dashed lines are 1.5mm from crush site. B) Estimated numbers of regenerating axons 1.5mm distal to injury site at 21dpc, from images such as those shown in A. Error bar: SEM; p value by Kruskal – Wallis test and Bonferroni’s post hoc: *** ≤ 0.001. Vector n = 7, PCKO n = 5, C/PCKO n = 4, C/PSCKO n = 4. C) Protocol for retrograde labeling of regenerating RGCs for SS2 collection. 5% Dextran micro-Ruby (MR) was injected into the nerve stump at ~1mm distal to ONC at 20dpc. D) Eyes collected 21dpc. Left and upper middle panels show fluorescence of injected MR in nerve stump. Lower middle panel shows retrogradely labeled RGCs in a dissected C/PSCKO retina. Right panels from retina as in D but labeled with anti-RBPMS (pan-RGC marker in grey). Dashed lines outline MR+ RGCs. Scalebar = 500μm (top), 50μm (bottom). E) and F) Proportions of surviving RGCs by subclass in PCKO (E) and C/PSCKO (F) among RGCs collected by the 10x Genomics platform. All subclasses are present among surviving RGCs. G - H) Proportions of regenerating RGCs (MR+) among retrograde-labeled RGCs collected by SS2 shown by subclass in PCKO (G), C/PCKO (H) and C/PSCKO (I).
Figure 3:
Figure 3:. Injury independent effects and mitigation of injury response induced by interventions
A) Dotplot showing genes upregulated in C/PCKO and C/PSCKO compared to WT and PCKO prior to injury (0dpc, 2 weeks after AAV injection). B) “Composite RAG score” (defined in text), compiled from 306 genes selectively expressed in regenerating (MR+) C/PSCKO RGCs. C) Dotplot showing Crhbp and Stmn1 downregulation in C/PSCKO prior to injury. D-G) Scatterplots showing expression level in current dataset of 771 genes identified as upregulated (pink) or downregulated (green) after ONC (0.5–14dpc) in a previous study (Tran et al., 2019). Responses in current data (WT 7dpc vs 0dpc) are similar to those in Tran et al., showing reproducibility (D). In PCKO, (E) or C/PSCKO (F), expression changes are attenuated or reversed. There are only minor differences between overall expression between PCKO and C/PSCKO (G). H) Boxplots of composite scores showing average expression of the up- or downregulated genes from (D-F) at 0, 2 and 7dpc. Horizontal line = mean, box below = 25th percentile, box above = 75th percentile, grey lines = whiskers / range.
Figure 4:
Figure 4:. Gene expression analysis of regenerating RGCs
A) Volcano Plot of genes differentially expressed between MR+ and MR RGCs from C/PSCKO retinas at 21dpc. p-value < 0.05, logFC > 0.7. Grey dots are genes not considered as highly significant DE (logFC ≥ 0.6). B, C) Dotplots highlighting Top10 GO-pathways enriched in regenerating (MR+) RGCs compared to surviving (MR) RGCs (B) or in surviving compared to regenerating RGCs (C). D) Volcano Plot of genes differentially expressed between MR+ PCKO and C/PSCKO RGCs. Genes associated with immune response or alphaRGCs are indicated in red and blue, respectively. Grey dots as in (A). E) Dotplot highlighting Top10 GO-pathways enriched in regenerating MR+ C/PSCKO RGCs compared to MR+ PCKO RGCs.
Figure 5:
Figure 5:. Gene modules revealed as genes selectively regulated by individual interventions
A,B) Heatmaps showing genes selectively expressed at 7dpc following each intervention, as calculated for each intervention against all others (A) or for each intervention compared to the one to its left (B) Expression values of each gene (row) are averaged across all RGCs in an intervention (columns) and then z-scored prior to plotting. Black bars separate genes into 4 modules (PB-M1-4). C) Dotplot showing expression of selected apoptotic pathway associated genes from PB-M1 at 7dpc. D,F) Top10 GO-pathways enriched in PB-M1 (D) or PB-M4 (F) (logFC > 0.6, FDR < 0.001) E,I) Cnet plot of Top10 pathways for PB-M1 (E) or PB-M4 (I) with associated genes. Color of dots represents the fold change of genes. Size of the grey dots refer to the number of genes enriched with the GO-term. G,H) Dotplots showing expression of genes implicated in axonogenesis (G) and immune responses (H) from PB-M4.
Figure 6:
Figure 6:. Gene modules revealed by single cell analysis using Monocle
A) Expression of 6 co-expression gene modules across the 40 Monocle clusters at 7dpc. Their relationships are indicated by the dendrogram to the left. Module expression is averaged across rows. B) Proportions of RGCs belonging to sets of Monocle clusters predominantly enriched for the indicated co-expression Module in each intervention. C) Heatmap of statistical enrichment using the hypergeometric test indicating correspondence between modules obtained from Pseudo-bulk analysis (Figure 5A) and Monocle analyses modules. Statistically significant p-values are shown. D-I) UMAPs show enrichment co-expression Modules across RGC populations. J-O) Top10 GO-pathways for each Monocle module. All genes contributing to the modules were considered. (logFC > 0.6, FDR < 0.001).
Figure 7:
Figure 7:. Gene regulatory modules revealed by Scenic
A) Heatmap of top regulon expression level (transcription factors (TF) and their putative downstream targets) in each cell at 7dpc established by Scenic analysis. Each row is a single RGC, with color bar at left indicating intervention type. Each column is a single regulon, with the TF listed at bottom. Dotted lines indicate 4 modules discussed in the text. B,C) Heatmaps of statistical enrichment using the hypergeometric test indicating the possibility of overlap between Scenic module regulons (TFs and potential regulated target genes; y-axis) and PB-M1-4 from Pseudo-Bulk analysis (C) or genes selectively expressed in regenerating (MR+) or surviving (MR) RGCs from micro-Ruby analysis (D). Statistically significant p-values are shown. D) Proportions of SCENIC module target genes shared with genes enriched in regenerating (MR+) or surviving (MR) RGCs obtained from micro-Ruby dataset. E) Schematic showing expression of death, survival and regeneration module genes following ONC in wild-type mice and after interventions. Data are taken from Figures 3, 7, S7 and Tran et al. (2019). However, the schematic is meant to show trends and is not quantitatively accurate. Increases prior to nerve crush reflect the “conditioning” effect of delivering interventions two weeks prior to injury, as described in the text. Created with BioRender.com
Figure 8:
Figure 8:. Genes affecting RCG axon regeneration
A) Experimental outline for in vivo tests of candidate regeneration-promoting genes. An AAV2 carrying a cDNA (for overexpression, OE) or sgRNA (for knockout, KO) was injected intravitreally 14 days before the crush. At 19dpc for OE or 12dpc for KO, regenerating axons were anterogradely labeled by CTB647 injection. B) Violin plots showing expression of OE candidates in regenerating (MR+) and surviving (MR) RGCs. C) Maximum projections of cleared optic nerves showing anterograde-labeled RGC axons at 21dpc following indicated treatment. Scale bar = 250μm, red asterisks indicate crush site. D) Quantification of axon regeneration based on images such as those in C. Data are shown as mean ±SEM. p-value by Kruskal – Wallis followed by Dunn’s post hoc at each distance. p ≤ 0.05 = *, p ≤ 0.01 = **. E) RGC density (RBPMS+ cells/mm2; mean ±SD) based on images such as those in (F). *adjusted p-value <.05 (FDR). F) Immunohistochemistry in retinal whole mounts stained for RBPMS at 21dpc following OE-Gal, OE-Wt1 and OE-Crh. Scale bar = 100μm. G) Maximum projections of cleared PCKO optic nerves following indicated treatment. As in (C) but 14dpc. H) Quantification of axon regeneration based on images such as those in (G). Data are shown as mean ±SEM with n = 4–6 each. **p<0.01.

Comment in

References

    1. Abe N, and Cavalli V (2008). Nerve injury signaling. Current Opinion in Neurobiology 18, 276–283. 10.1016/j.conb.2008.06.005. - DOI - PMC - PubMed
    1. Aibar S, González-Blas CB, Moerman T, Huynh-Thu VA, Imrichova H, Hulselmans G, Rambow F, Marine JC, Geurts P, Aerts J, et al. (2017). SCENIC: Single-cell regulatory network inference and clustering. Nature Methods 14, 1083–1086. 10.1038/NMETH.4463. - DOI - PMC - PubMed
    1. Babon JJ, Kershaw NJ, Murphy JM, Varghese LN, Laktyushin A, Young SN, Lucet IS, Norton RS, and Nicola NA (2012). Suppression of Cytokine Signaling by SOCS3: Characterization of the Mode of Inhibition and the Basis of Its Specificity. Immunity 36, 239–250. 10.1016/j.immuni.2011.12.015. - DOI - PMC - PubMed
    1. Baskozos G, Sandy-Hindmarch O, Clark AJ, Windsor K, Karlsson P, Weir GA, McDermott LA, Burchall J, Wiberg A, Furniss D, et al. (2020). Molecular and cellular correlates of human nerve regeneration: ADCYAP1/PACAP enhance nerve outgrowth. Brain 143, 2009–2026. 10.1093/brain/awaa163. - DOI - PMC - PubMed
    1. Baudet ML, Rattray D, Martin BT, and Harvey S (2009). Growth hormone promotes axon growth in the developing nervous system. Endocrinology 150, 2758–2766. 10.1210/en.2008-1242. - DOI - PubMed

Publication types