. 2022 Aug 17;110(16):2607-2624.e8.
doi: 10.1016/j.neuron.2022.06.003. Epub 2022 Jun 28.

Core transcription programs controlling injury-induced neurodegeneration of retinal ganglion cells

Affiliations

Core transcription programs controlling injury-induced neurodegeneration of retinal ganglion cells

Feng Tian et al. Neuron. .

Erratum in

  • Core transcription programs controlling injury-induced neurodegeneration of retinal ganglion cells.
    Tian F, Cheng Y, Zhou S, Wang Q, Monavarfeshani A, Gao K, Jiang W, Kawaguchi R, Wang Q, Tang M, Donahue R, Meng H, Zhang Y, Jacobi A, Yan W, Yin J, Cai X, Yang Z, Hegarty S, Stanicka J, Dmitriev P, Taub D, Zhu J, Woolf CJ, Sanes JR, Geschwind DH, He Z. Tian F, et al. Neuron. 2023 Feb 1;111(3):444. doi: 10.1016/j.neuron.2023.01.008. Neuron. 2023. PMID: 36731430 Free PMC article. No abstract available.

Abstract

Regulatory programs governing neuronal death and axon regeneration in neurodegenerative diseases remain poorly understood. In adult mice, optic nerve crush (ONC) injury by severing retinal ganglion cell (RGC) axons results in massive RGC death and regenerative failure. We performed an in vivo CRISPR-Cas9-based genome-wide screen of 1,893 transcription factors (TFs) to seek repressors of RGC survival and axon regeneration following ONC. In parallel, we profiled the epigenetic and transcriptional landscapes of injured RGCs by ATAC-seq and RNA-seq to identify injury-responsive TFs and their targets. These analyses converged on four TFs as critical survival regulators, of which ATF3/CHOP preferentially regulate pathways activated by cytokines and innate immunity and ATF4/C/EBPγ regulate pathways engaged by intrinsic neuronal stressors. Manipulation of these TFs protects RGCs in a glaucoma model. Our results reveal core transcription programs that transform an initial axonal insult into a degenerative process and suggest novel strategies for treating neurodegenerative diseases.

Keywords: ATF3; ATF4; C/EBPg; CHOP; axon regeneration and neuronal degeneration; optic nerve; retinal ganglion cell.


Conflict of interest statement

Declaration of interests C.J.W. is a founder of Nocion Therapeutics and QurAlis. J.R.S. is a consultant for Biogen. Z.H. is an advisor of SpineX, Life Biosciences, and Myro Therapeutics.

Figures

Figure 1.
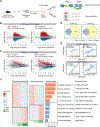
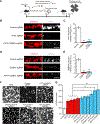
Figure 1.. In vivo CRISPR screen identifies negative transcriptional regulators of RGC survival and axon regeneration after ONC
(A) Schematic illustration of the in vivo CRISPR screen in ONC model. AAV2 vectors encoding sgRNAs were injected intravitreally to Rosa26-LSL-Cas9 mice at 2 weeks before ONC. To ensure ablation efficiency, the mix of five different sgRNAs (from GeCKO mouse v2 CRISPR knockout library) were selected to target each gene candidate. (B) The final lists of survival and regeneration hits were categorized into three groups: (1) deletion of the TF increasing axon regeneration without affecting RGC survival (Pro-Reg, 12 hits); (2) deletion of the TF increased RGC survival without affecting axon regeneration (Pro-Sur, 9 hits); (3) deletion of the TF promoted both RGC survival and axon regeneration (Pro-Sur, Pro-Reg, 1 hit). Each data point is the averaged results from RGC survival or axon regeneration analyses. (C) Representative immunohistochemistry images of wholemount retinas showing improved survival after ONC injury by CRISPR ablation of individual TFs. Scale bar, 50 μm. (D) Quantification of RGC survival with individual TF knockout. Data are shown as mean ± s.e.m. with n = 4–5 biological repeats. *p<0.05, **p<0.01, ***p<0.001, calculated by one-way ANOVA. (E) Representative optic nerve images showing axon regeneration after ONC injury with individual TF knockout. Scale bar, 0.5 mm. (F) Quantification of CTB labeled fluorescent intensity (from crush site) for all sgRNA hits that promote RGC axon regeneration. Data are shown as mean ± s.e.m. with n=5–6 biological repeats. *p<0.05, **p<0.01, ***p<0.001. Welch anova test, followed by Dunnett’s T3 adjustment.
Figure 2.
Figure 2.. Characterization of chromatin accessibility changes in retinal ganglion cells following optic nerve crush
(A) Schematic diagram summarizing the overall experimental flow. vGLUT2-labeled RGCs were FACS-sorted at 0 (no crush) 1, 3 days following optic nerve crush. ATAC-seq and RNA-seq were performed on separate sets of injured RGCs, with n = 3–6 biological repeats in each time point. (B-D) MA plots displaying differential accessible regions (DAR) (B) and differential expressed genes (DEGs) (C) in RGCs following injury. Each dot represents a peak region or a gene, and colored dots indicate DARs or DEGs (FDR p < 0.1, | log2 FC| > 0.3). Upregulated: red; Down-regulated: blue. (D) Overlap of DARs and DEGs at day 1 or day 3 following injury. (E) Pearson correlations between injury-induced changes in gene expression and chromatin accessibility at the promoter and distal DARs. Using GENCODE annotations, we defined an ATAC-seq peak ± 2 kb of a gene’s transcription start site (TSS) as a promoter (proximal regulatory element), and non-promoter peaks ± 500 kb of TSS as distal regulatory regions of that gene. The differential accessibilities of these DARs (log2 FCs) were correlated and plotted against the differential expression of the linked genes. If several distal peaks are linked to the same gene, the average differential accessibility was used to correlate with differential expression. (F) Chromatin accessibility and mRNA expression of linked peak-gene pairs. Heatmap colors indicate row-scaled chromatin accessibility (left) or mRNA expression levels (right). Bar plots represent negative log10 FDR-corrected p-values of top Gene Ontology (GO) terms associated with genes in each cluster. Representative genes in each term were displayed.
Figure 3.
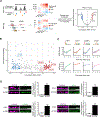
Figure 3.. Identification of transcription factors driving chromatin accessibility changes
(A) A schematic diagram displaying an unbiased bioinformatic approach to identify TF regulators driving chromatin accessibility and gene expression changes in injured RGCs. In this approach, we first find TF binding motifs that are significantly enriched within differentially accessible regions (DAR). The degree of accessibility at enriched TF motifs was computed as deviation Z-scores, and were correlated with TF expression levels across samples to classify TF mode of actions. (B) TF gene expression - motif accessibility correlations against maximum inter-sample difference in deviation Z-score. Each dot represents a TF, and colored dots indicate TFs whose gene expressions are significantly correlated or anti-correlated to motif deviations (Pearson’s correlation coefficient r > 0.5 and FDR < 0.1), and whose maximum cross-sample difference in deviation z-score is in the top 25% of all TFs. Th genes overlapped with CRISPR screen hits were highlighted. (C) TF binding motif accessibility deviations and RNA-seq expression levels for ATF3, ATF4, C/EBPγ, CHOP/DDIT3. (D) Representative immunohistochemical images showing injury-induced protein expression at 3d post-ONC of individual TFs. Data are shown as mean ± s.e.m. with n = 4. **p<0.01, ***p<0.001, calculated by two sample t test. Scale bar, 10 μm.
Figure 4.
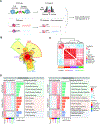
Figure 4.. Identification of direct target genes of the four survival TFs
(A) A schematic diagram displaying integrative analysis of DNA-footprinting using ATAC-seq data and RNA-seq to identify each TF’s direct target genes. Chromatin-bound TF protects DNA elements from Tn5 transposase cleavage, creating single-nucleotide-resolution DNA “footprints” during ATAC-seq. Mapping these footprints would identify DNA regions directly bound by the TF, and the genes linked to TF footprinted regions. To identify genes that are directly regulated by each survival TF, RNA-seq was performed on RGCs with or without prior CRSIPR ablation of this TF at day 3 following injury. Genes that are footprinted by this TF and differentially expressed (up- or down-regulated, absolute logFC >0 and FDR < 0.1) upon ablation of this TF are considered as its direct target genes. N = 4–5 biological repeats in each condition, except for the group with ATF4 ablation (n = 2 biological repeats after outlier removal). (B) A Chow -Rusky Venn diagram and an Upset plot showing the overlap of each TF’s direct targets. Similar to regular Venn diagram graphics, the Chow-Rusky Venn diagram is divided into 2n connected regions (n = 4 TF combinations). The regions forming loops indicate overlapped targets of colored TFs (e.g. 140 targets common to 4 TFs), while the other open connected regions indicate targets exclusive to certain sets of TFs (e.g. 820 targets unique to ATF3 that is red colored, but not to the other 3 TFs). In the Upset plot, the set size indicates the number of direct targets for each TF. The intersection size indicates the number of overlapped targets unique to dotted TF(s). (C) A heatmap of correlation matrix showing similarity and dis-similarity in the expression levels of each TF’s direct target genes. Normalized RNA-seq counts of each TF’s direct target genes were correlated and clustered by the distances among samples from control RGCs (nontargeting sgRNA) or treated RGCs receiving individual CRISPR TF ablations. Colors in the heatmap indicate Pearson’s correlations between two samples. ATF3 and CHOP are more similar in the expression levels of their target genes, while ATF4 and C/EBPγ are more similar. (D) Shared or unique target gene sets of each TF. Positive targets are defined as genes that are down-regulated (log2FC < 0, FDR < 0.1) when this TF is ablated. Negative targets are defined as genes that are up-regulated (log2FC > 0, FDR < 0.1) when this TF is ablated. Based on gene expression similarity in (C), each TF’s positive or negative targets were grouped together and clustered into three gene sets: a) genes that are uniquely controlled by ATF3 and CHOP, b) genes that are uniquely controlled by ATF4 and C/EBPγ, and c) genes that are shared by ATF3/CHOP and ATF4/C/EBPγ groups. Gene ontology on these three gene sets were performed and related GO terms with enrichment FDR value < 0.05 were presented.
Figure 5.
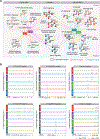
Figure 5.. Two distinct transcriptional programs regulated by ATF3/CHOP or C/EBPγ/ATF4 in injured RGCs
(A) A TF network plot showing the positive or negative targets and the associated biological pathways that are uniquely controlled by ATF3 and CHOP (ATF3/CHOP), uniquely controlled by ATF4 and C/EBPγ (ATF4/C/EBPγ), or shared by both ATF3/CHOP and ATF4/C/EBPγ (common). Representative genes in each pathway were shown. Each node indicates a gene. Node colors indicate the different GO terms, and edge colors indicate TFs. (B-C) Genome browser views of each of 4 TF’s binding sites around representative target genes. Y-axis indicates Tn5-bias corrected footprint signals of each TF from control (day 0) or optic nerve crushed (day 3) RGCs. Shown representative genes, including both positive (B) and negative (C) targets, are selected from the three groups in (A).
Figure 6.
Figure 6.. Functional interactions of the key TFs in injured RGCs
(A) Schematic illustration of CRISPR KO with sgRNAs targeting multiple genes. AAV2 vectors encoding sgRNAs were injected intravitreally to Rosa26-LSL-Cas9 mice at 2 weeks before ONC. (B-C) Representative images (B) and quantification (C) of ATF3 immunohistochemical staining indicate the knockout efficiency of ATF3 sgRNA and ATF3+C/EBPγ sgRNA. Data are shown as mean ± s.e.m. with n = 4. ***p<0.001, calculated by one-way ANOVA. Scale bar, 10 μm. (D-E) Representative images (D) and quantification (E) of C/EBPγ immunohistochemical staining indicate the knockout efficiency of C/EBPγ sgRNA and ATF3+C/EBPγ sgRNA. Data are shown as mean ± s.e.m. with n = 4. ***p<0.001, calculated by one-way ANOVA. Scale bar, 10 μm. (F) Representative images of RGC survival with combinations of sgRNA hits injected to LSL-Cas9 mice. Scale bar, 50 μm. (G) Quantification of RGC survival with combinations of sgRNA hits. Data are shown as mean ± s.e.m. with n = 4–5 biological repeats. *p<0.05, ***p<0.001, calculated by nonparametric Kruskal Wallis test, followed by Bonferroni adjustment.
Figure 7.
Figure 7.. CRISPR ablation of the identified TFs protects RGCs in a glaucoma model
(A) Schematic illustration of the viscobeads occlusion experimental glaucoma model. Concentrated viscobeads were injected into the mouse anterior chamber to block aqueous drainage. (B) A representative photograph of viscobeads accumulated at mouse iridocorneal angle 5 min after injection. Arrows show the white viscobeads were restricted at the iridocorneal angle. (C) Viscobeads distribution in the mouse anterior chamber following intracameral injection. Left: A representative transmission electron microscopy (TEM) image of an intact mouse iridocorneal angle. Right: A representative fluorescence image showing rhodamine B labelled viscobeads accumulation at mouse iridocorneal angle. Scale bar, 10 μm (left) and 100 μm (right). (D) Intraocular pressure (IOP) in the mice before and after the injection of viscobeads (n=10) or saline (n=5) and the naïve group (n=5). Data are shown as mean ± SD. (E, F) Representative wholemount retina confocal images from an intact mouse (E) and a mouse after 8 weeks from viscobeads injection (F). RBMPS antibody was used for the immunohistochemical staining of RGCs. Scale bar for the left panel for (F, G), 2 mm. Scale bar for the left panel for (F, G), 100 μm. (G) Quantification of RGC survival 8 weeks after the viscobeads (n=31) or saline (n=5) injection and the naïve group (n=5). Data are shown as mean ± SD. (H-K) Knockout of individual TFs protects RGCs in the glaucoma mice. (H) Schematic illustration. AAV2 vectors encoding sgRNAs were injected intravitreally at 2 weeks before beads injection. (I) IOP elevation in different group of mice. (J) Representative images of retinal sections showing RGC survival with sgRNA injections targeting indicated TFs. Scale bar, 20 μm. (K) Quantification of RGC survival after 8 weeks of viscobeads injection, including intact condition (n=7), control (non-targeting) sgRNA injection (n=10), ATF3 sgRNA injection (n=13), ATF4 sgRNA injection (n=9), C/EBPγ sgRNA injection (n=9), CHOP sgRNA injection (n=10), ATF3+ATF4 sgRNA injection (n=10), ATF3+C/EBPγ sgRNA injection (n=12). Data are shown as mean ± s.e.m.. **p<0.01, ***p<0.001, calculated by one-way ANOVA.

Comment in

Similar articles

Cited by

References

    1. Abel T, Martin KC, Bartsch D, and Kandel ER (1998). Memory suppressor genes: inhibitory constraints on the storage of long-term memory. Science 279, 338–341. - PubMed
    1. Aguayo AJ, Rasminsky M, Bray GM, Carbonetto S, McKerracher L, Villegas-Perez MP, Vidal-Sanz M, and Carter DA (1991). Degenerative and regenerative responses of injured neurons in the central nervous system of adult mammals. Philos Trans R Soc Lond B Biol Sci 331, 337–343. - PubMed
    1. Aime P, Karuppagounder SS, Rao A, Chen Y, Burke RE, Ratan RR, and Greene LA (2020). The drug adaptaquin blocks ATF4/CHOP-dependent pro-death Trib3 induction and protects in cellular and mouse models of Parkinson’s disease. Neurobiol Dis 136, 104725. - PMC - PubMed
    1. Almasieh M, and Levin LA (2017). Neuroprotection in Glaucoma: Animal Models and Clinical Trials. Annu Rev Vis Sci 3, 91–120. - PubMed
    1. Amemiya HM, Kundaje A, and Boyle AP (2019). The ENCODE Blacklist: Identification of Problematic Regions of the Genome. Sci Rep 9, 9354. - PMC - PubMed

Publication types