. 2022 Aug 8;32(15):3245-3260.e5.
doi: 10.1016/j.cub.2022.06.009. Epub 2022 Jun 28.

Selective enhancement of neural coding in V1 underlies fine-discrimination learning in tree shrew

Affiliations

Selective enhancement of neural coding in V1 underlies fine-discrimination learning in tree shrew

Joseph W Schumacher et al. Curr Biol. .

Abstract

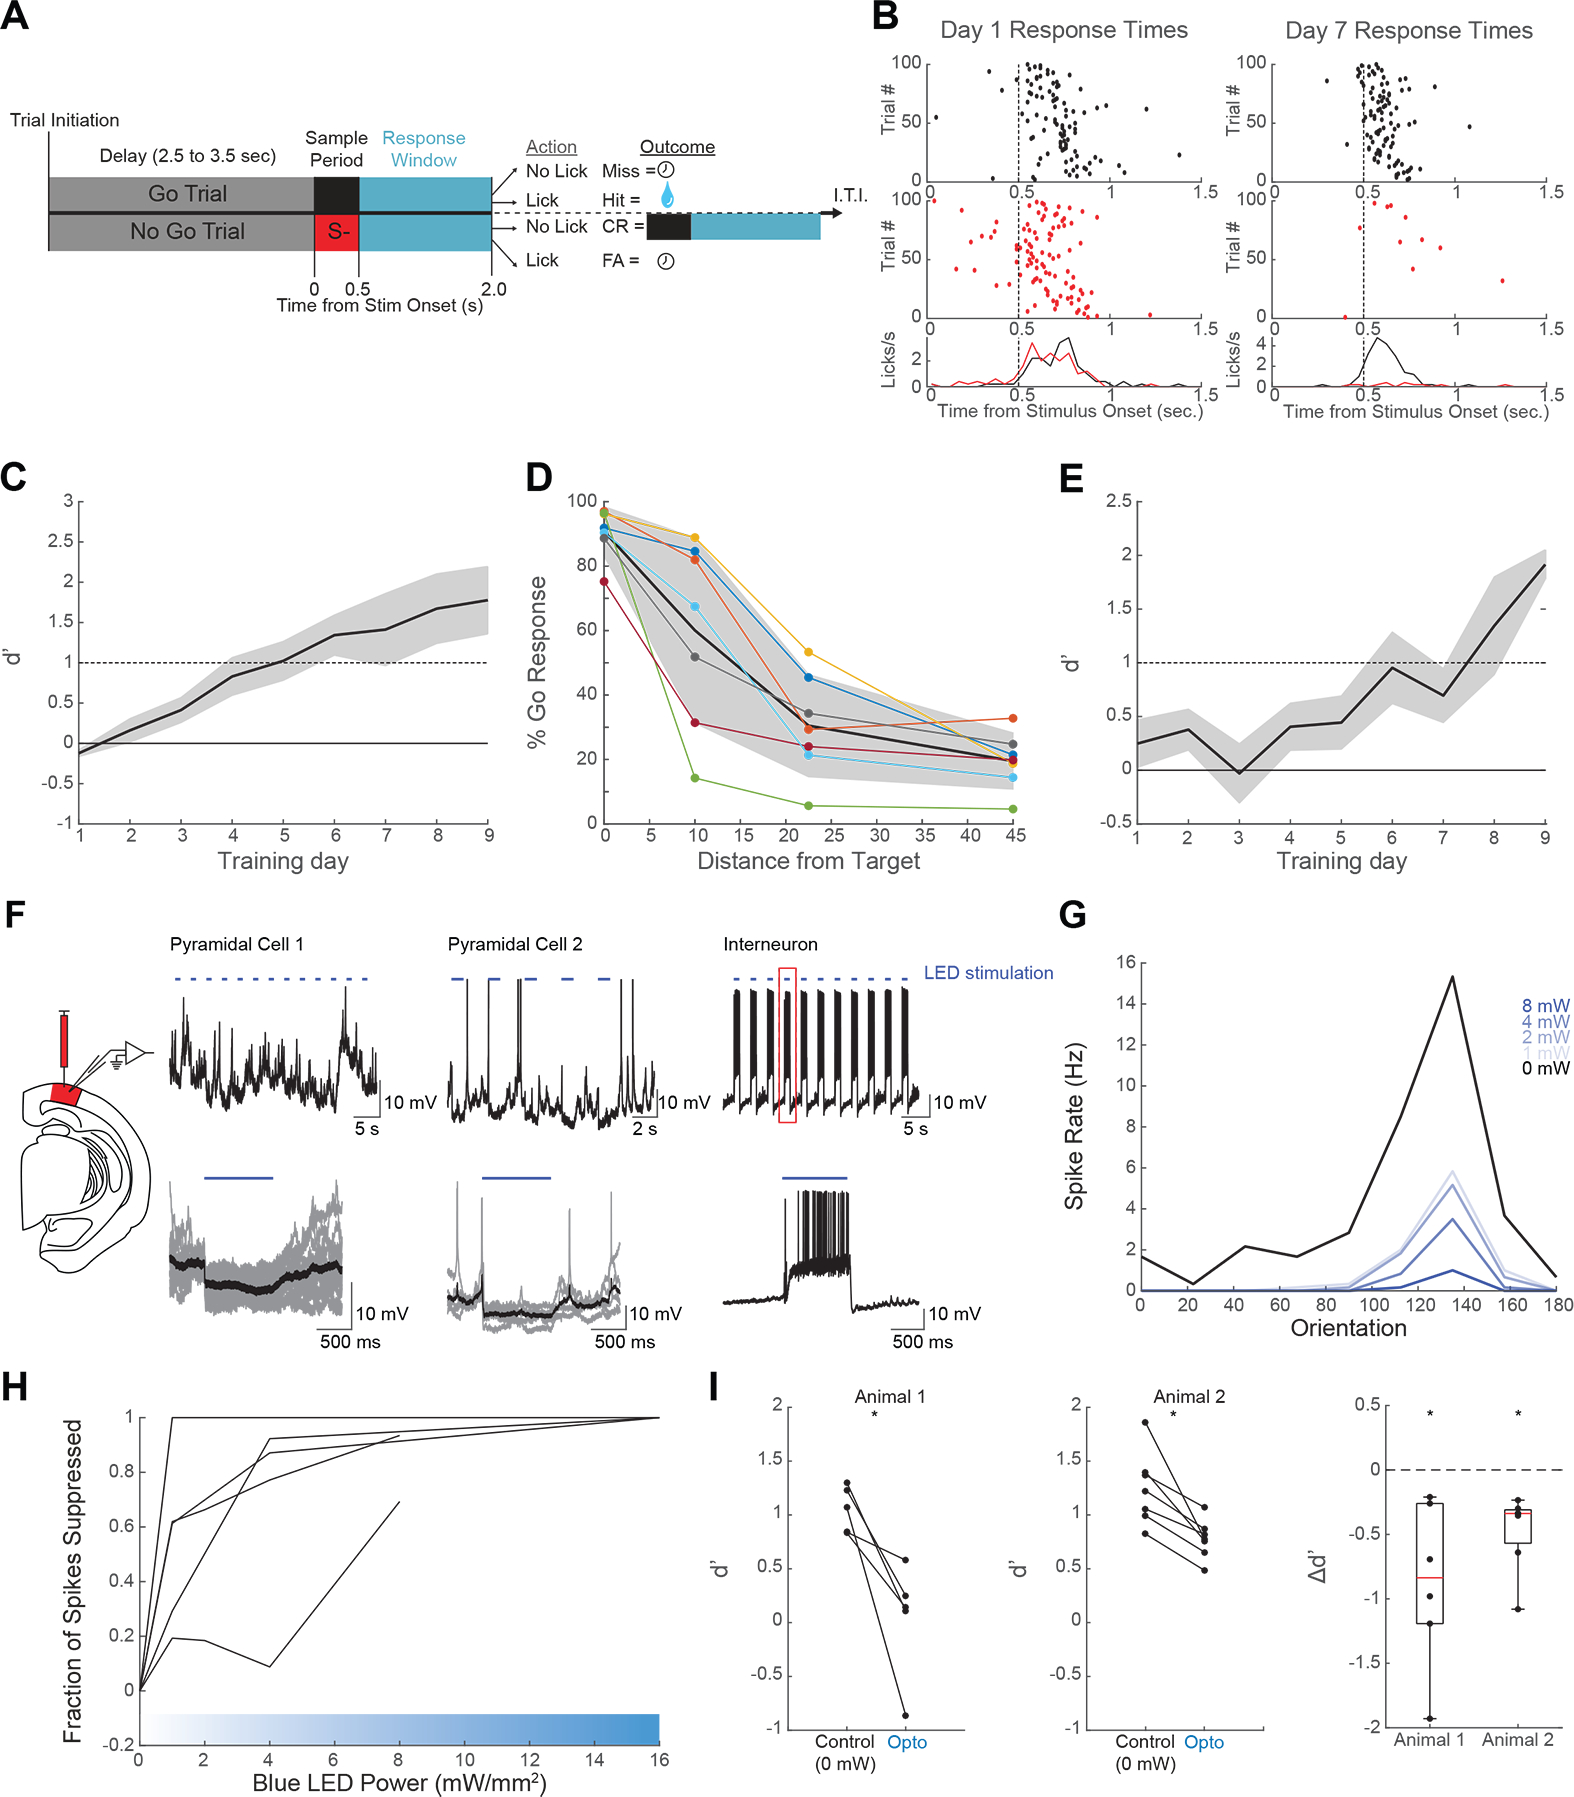
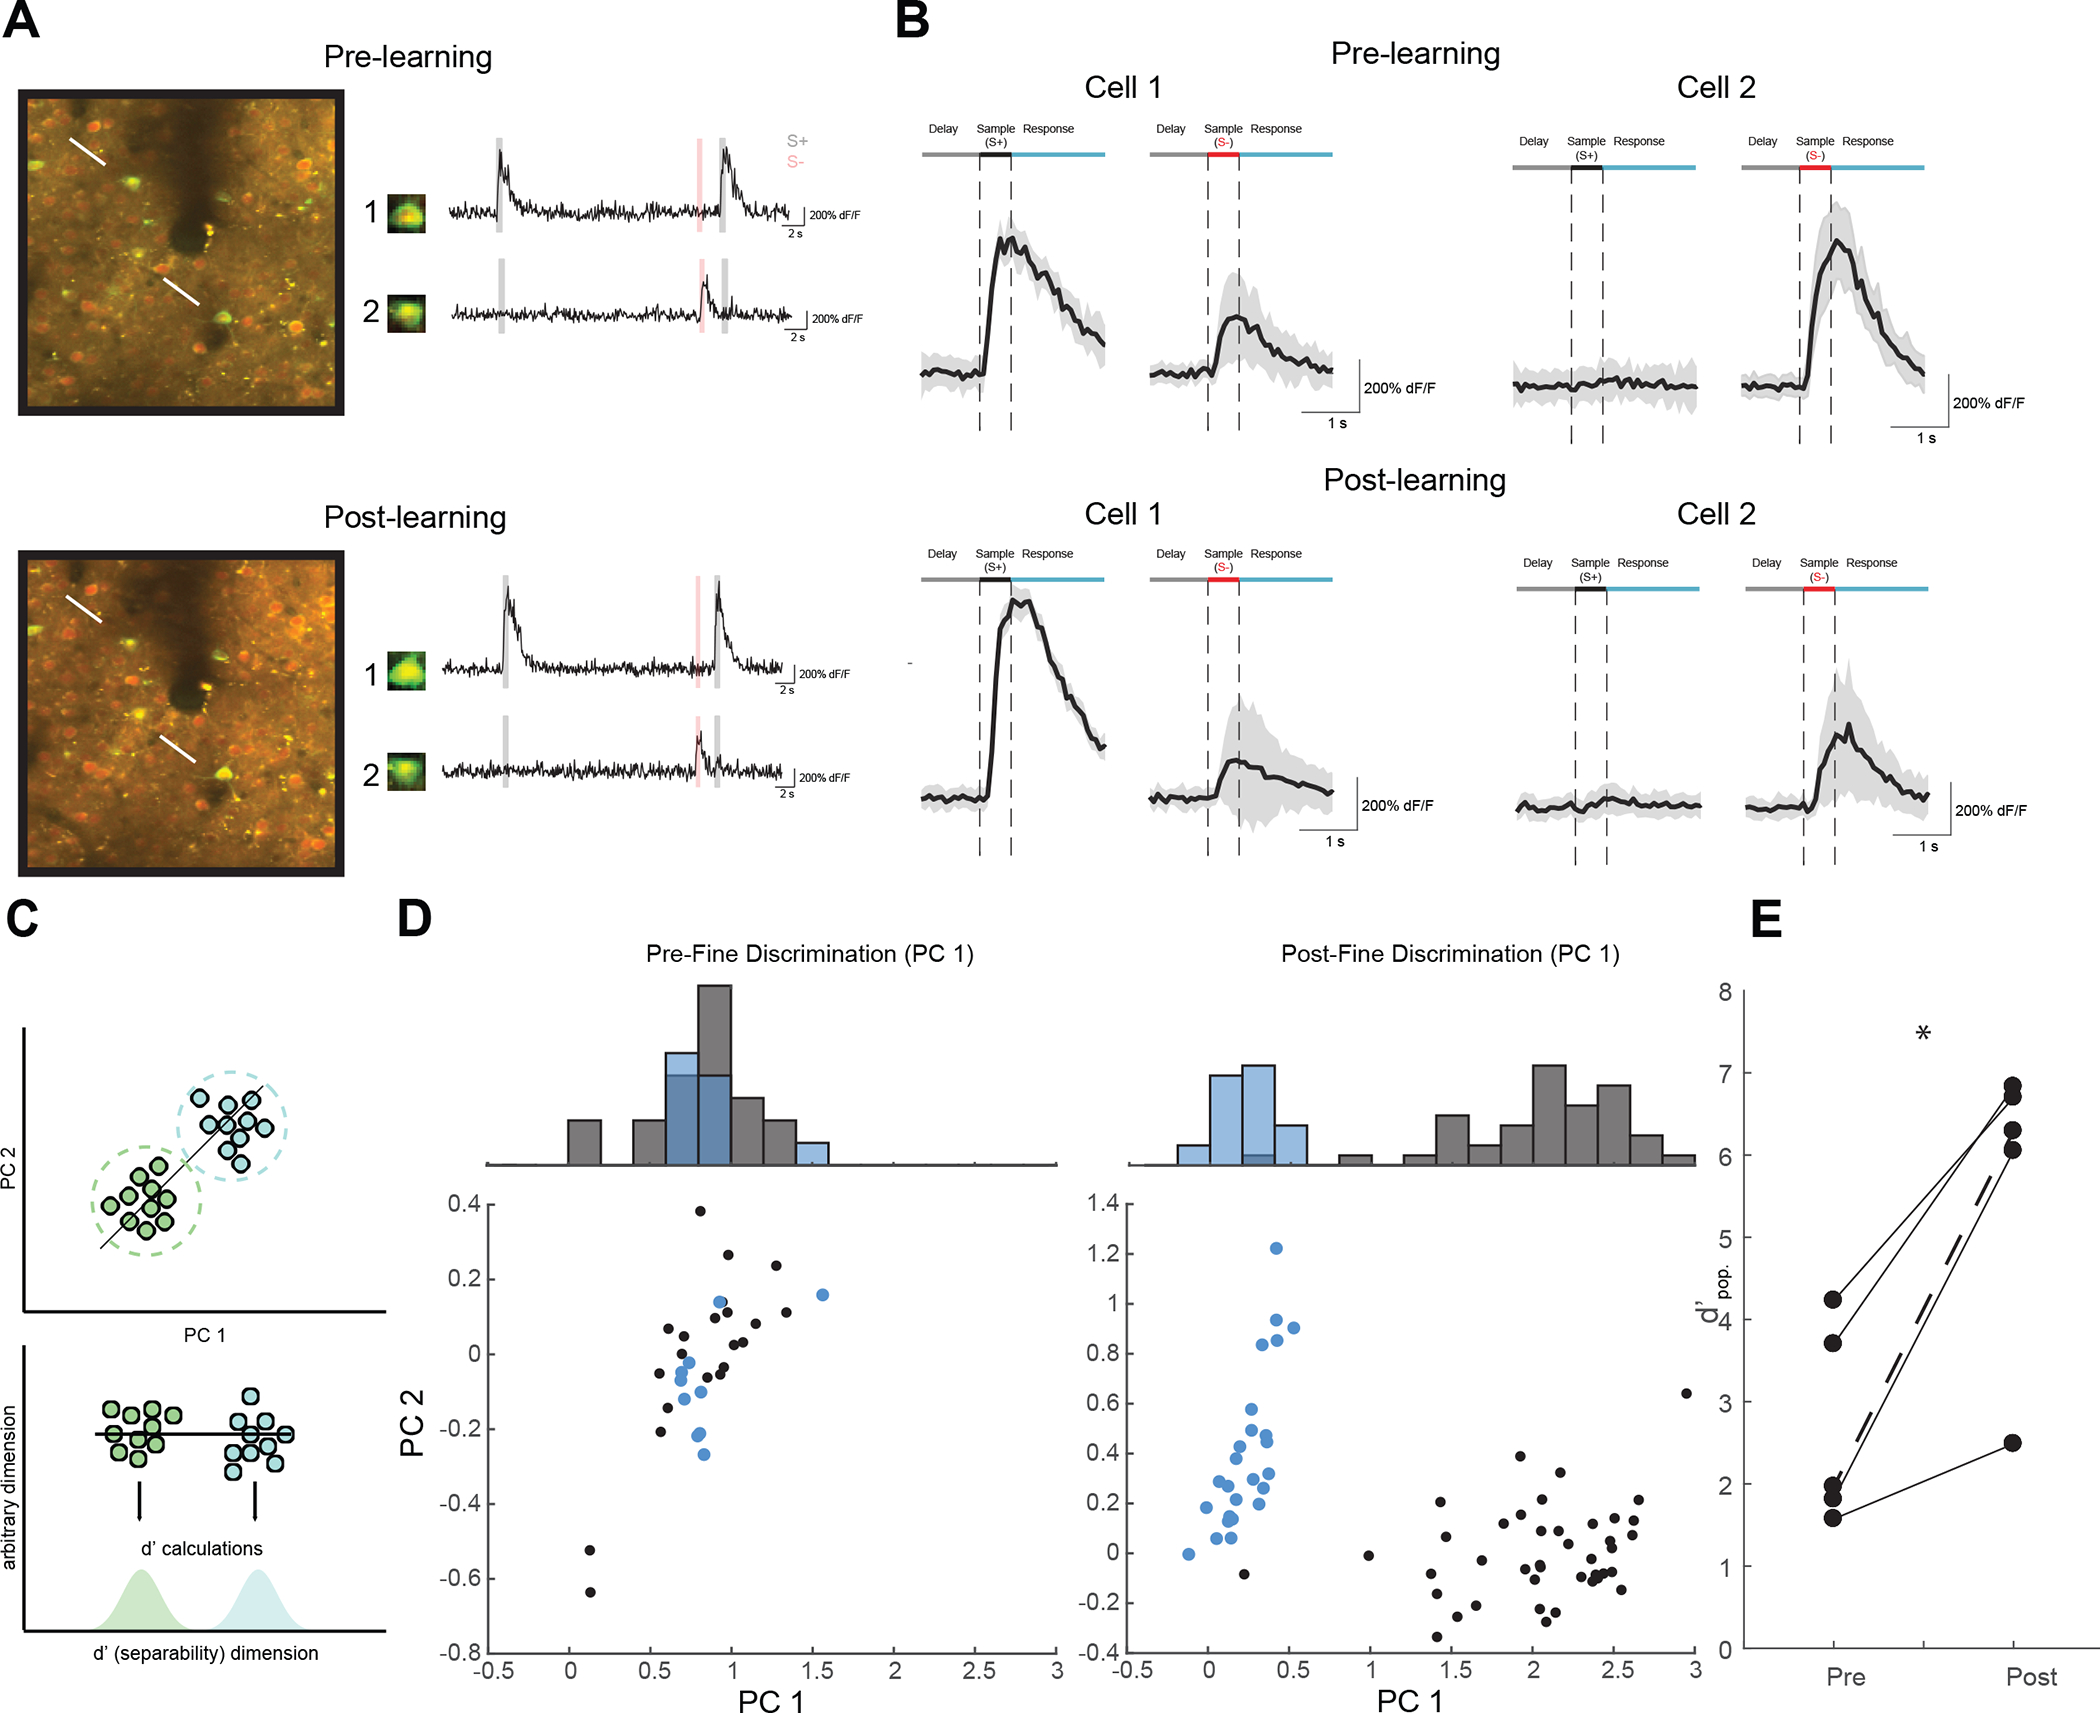
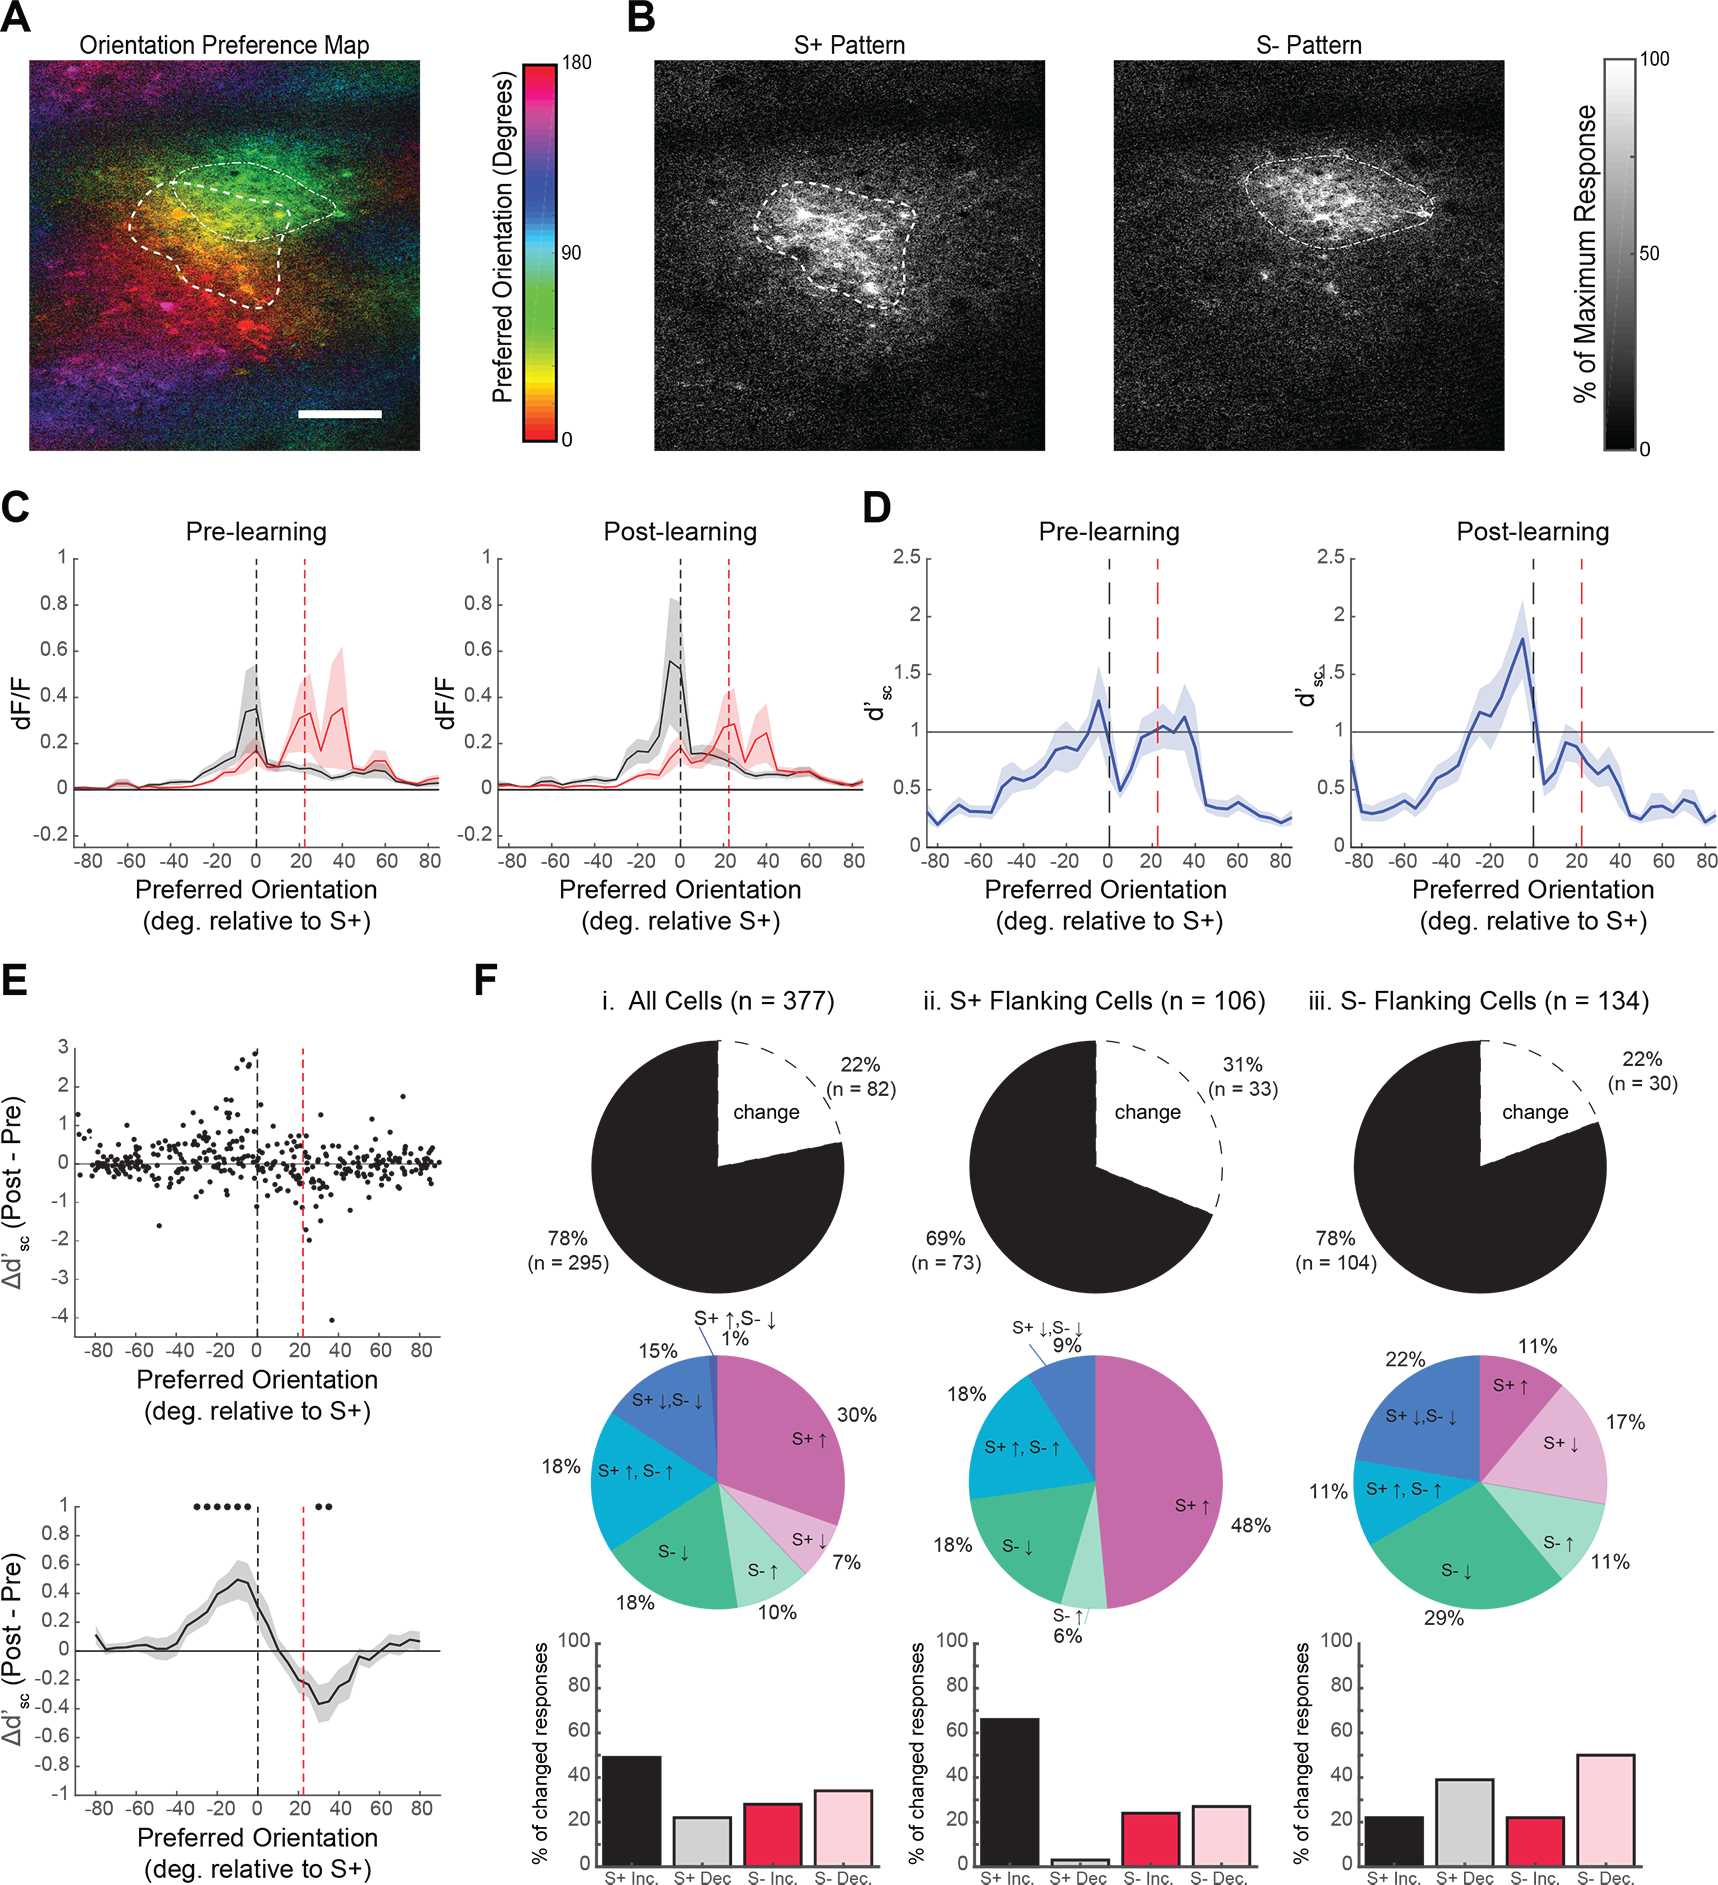
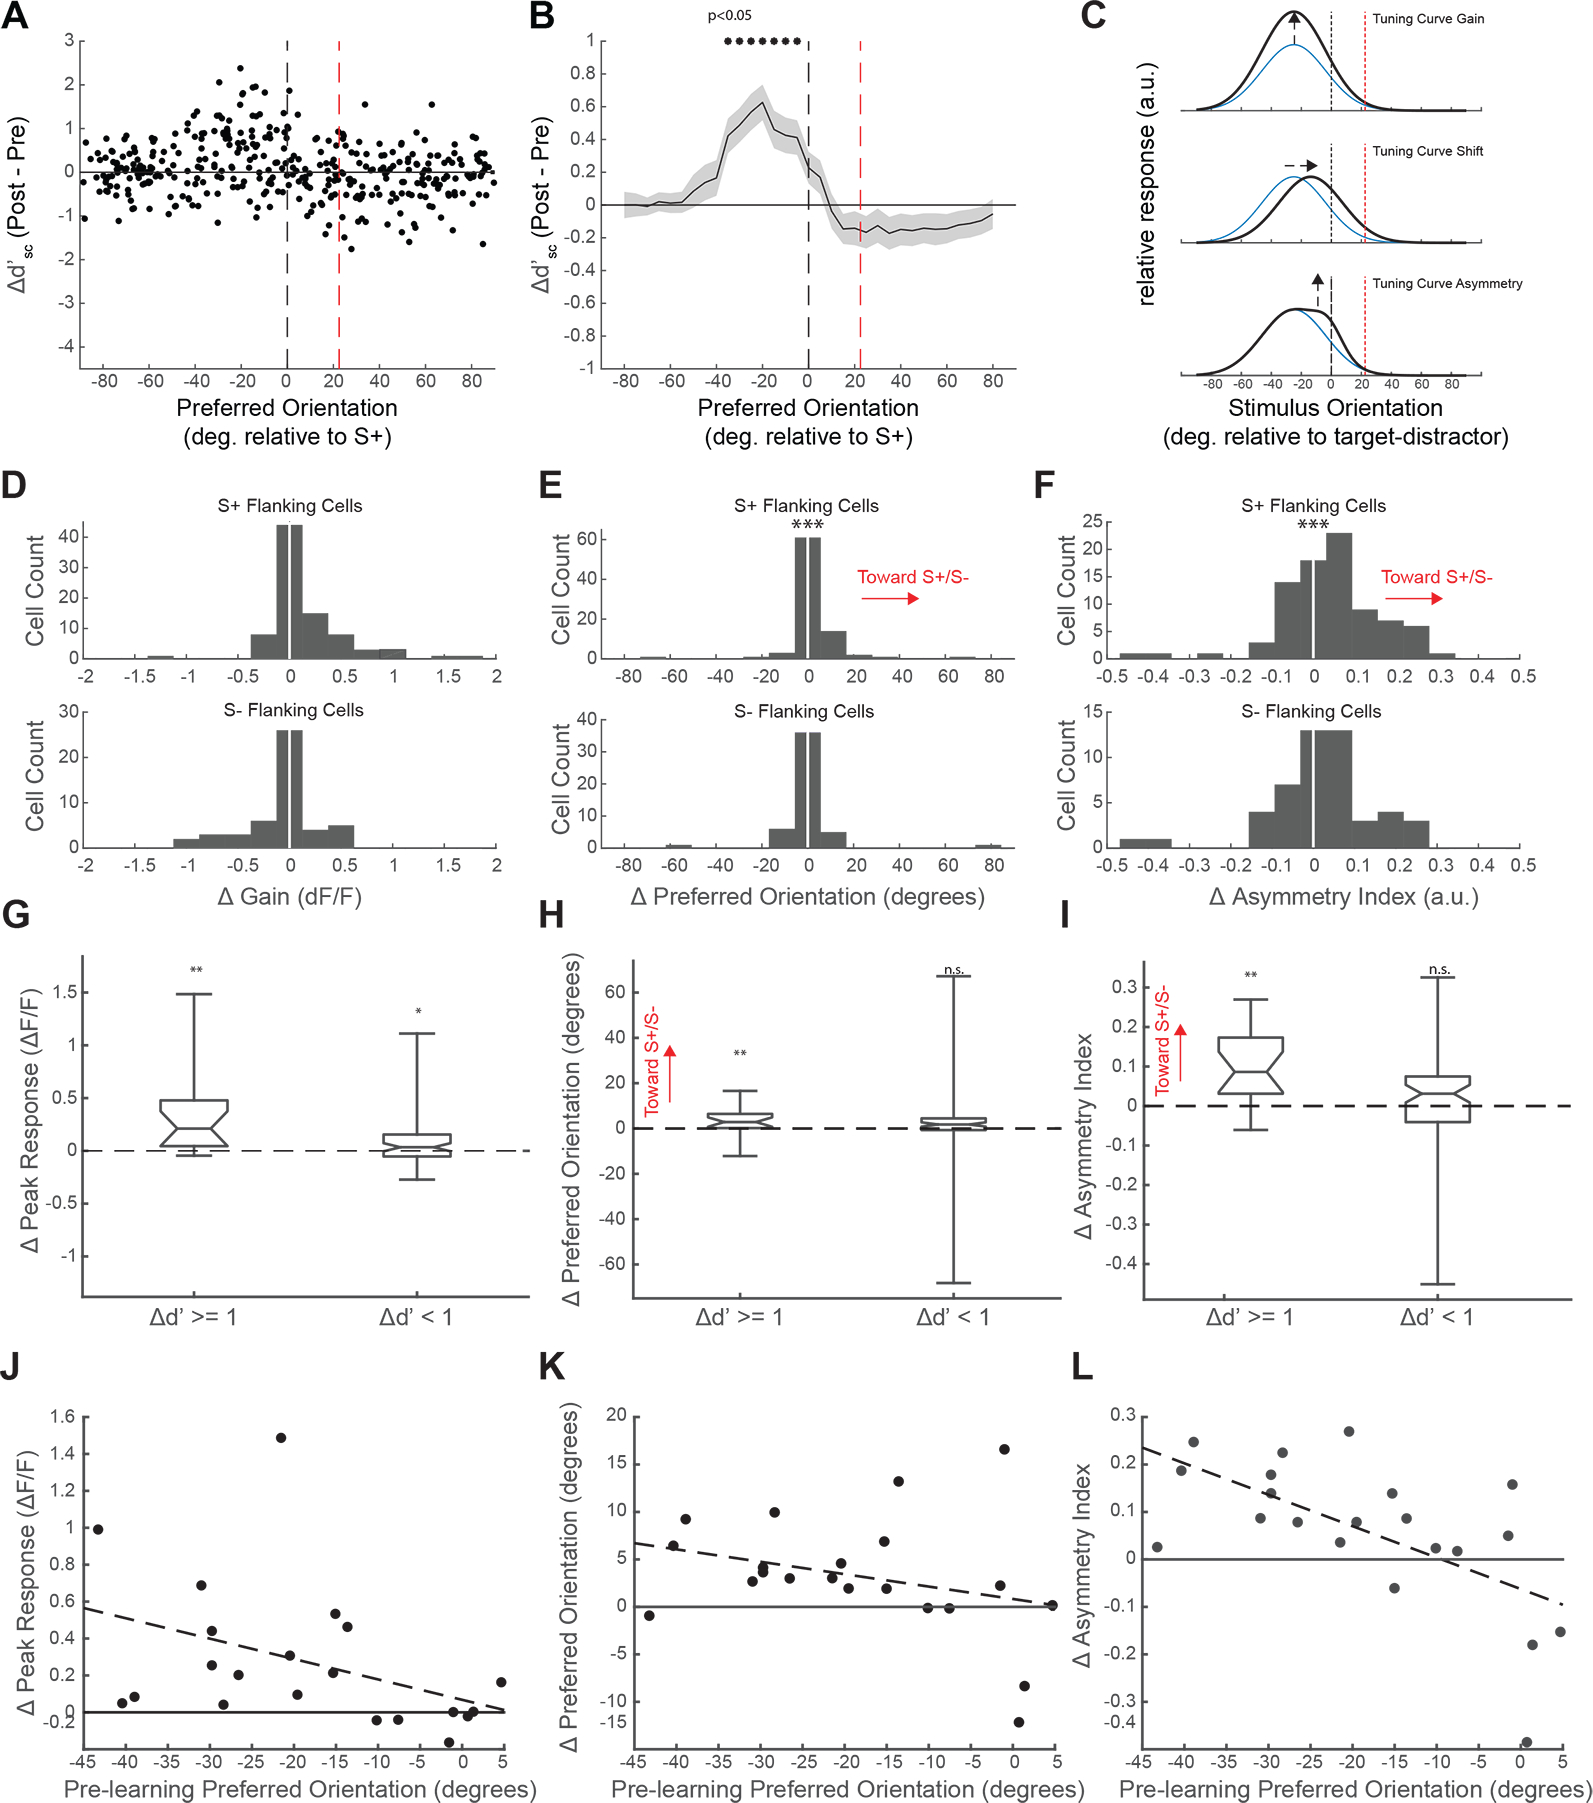
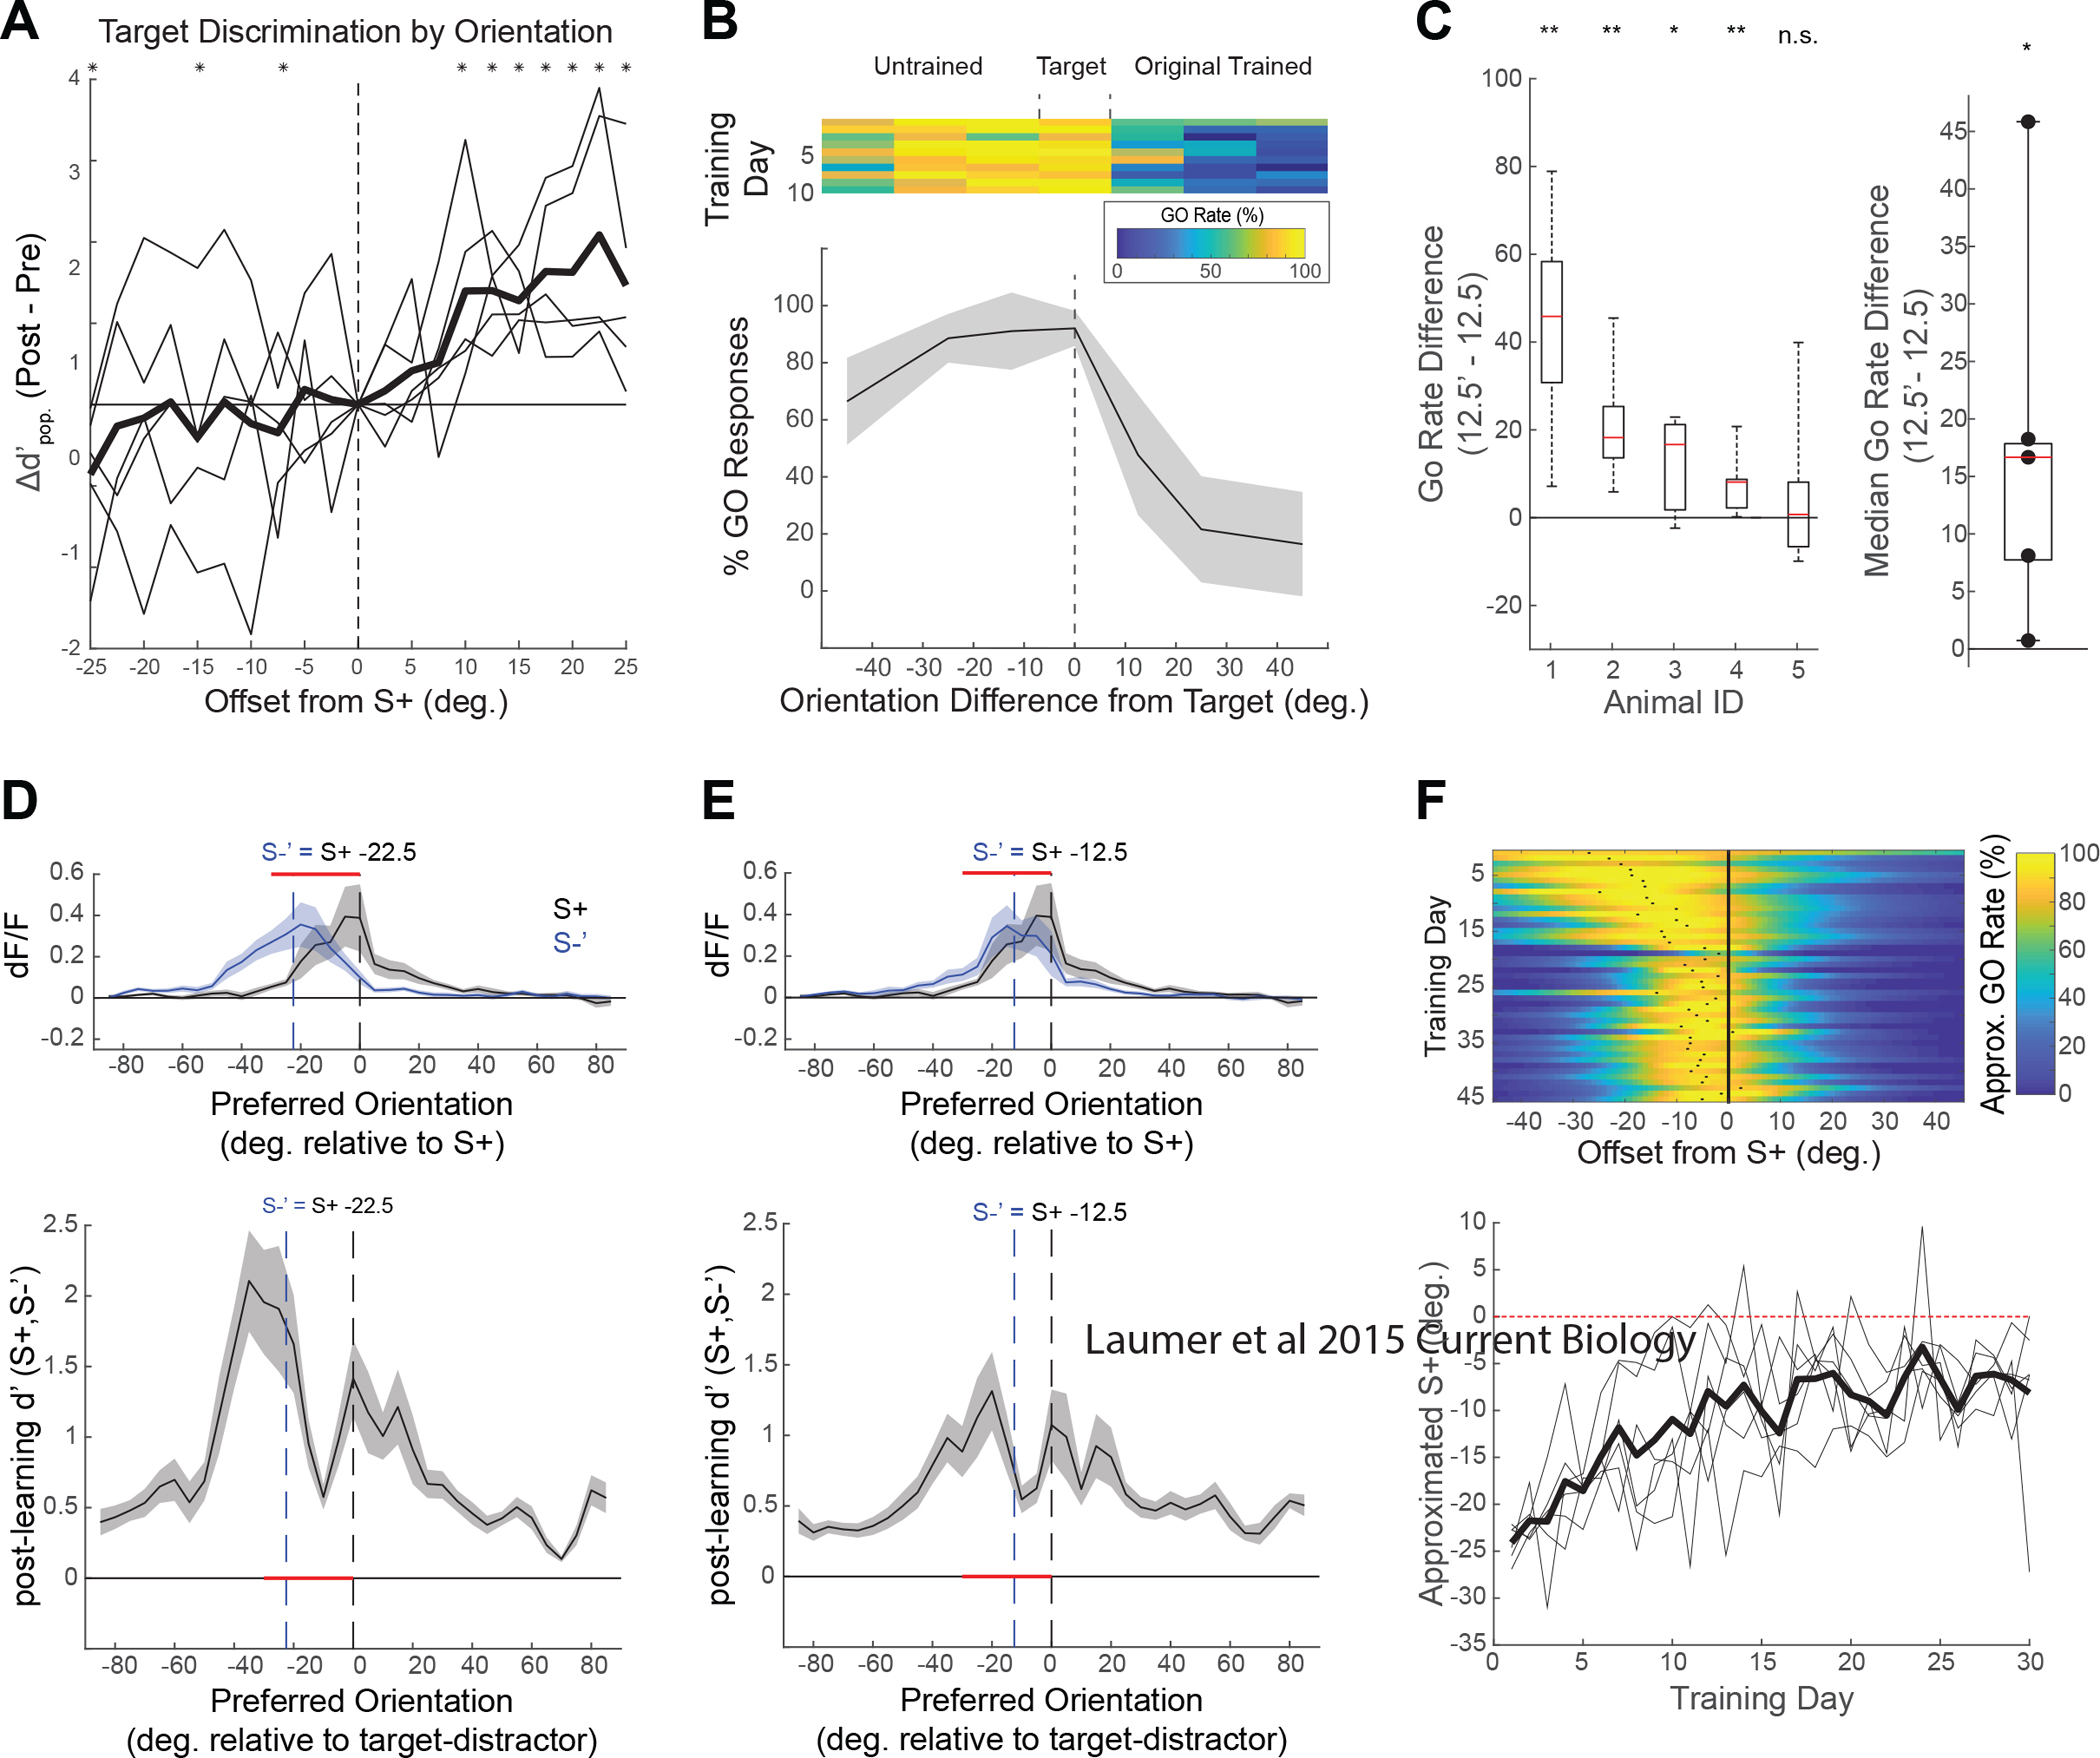
Visual discrimination improves with training, a phenomenon that is thought to reflect plastic changes in the responses of neurons in primary visual cortex (V1). However, the identity of the neurons that undergo change, the nature of the changes, and the consequences of these changes for other visual behaviors remain unclear. We used chronic in vivo 2-photon calcium imaging to monitor the responses of neurons in the V1 of tree shrews learning a Go/No-Go fine orientation discrimination task. We observed increases in neural population measures of discriminability for task-relevant stimuli that correlate with performance and depend on a select subset of neurons with preferred orientations that include the rewarded stimulus and nearby orientations biased away from the non-rewarded stimulus. Learning is accompanied by selective enhancement in the response of these neurons to the rewarded stimulus that further increases their ability to discriminate the task stimuli. These changes persist outside of the trained task and predict observed enhancement and impairment in performance of other discriminations, providing evidence for selective and persistent learning-induced plasticity in the V1, with significant consequences for perception.

Keywords: neural coding; neural discrimination; perceptual learning; tree shrew; visual cortex.


Conflict of interest statement

Declaration of interests The authors declare no competing interests.

Figures

Figure 1:
Figure 1:. Tree shrews learn to perform a V1-dependent orientation discrimination task.
(A) Task structure. Tree shrews self-initiated trials by licking their response port. Following a variable delay, shrews were asked to lick following an S+ orientation while not licking in response to an S− orientation. Hit trials elicited liquid rewards, while correct rejections (CR) resulted in a subsequent S+ presentation. Miss and false alarm (FA) trials resulted in a brief time-out. Inter-trial interval (ITI) was determined by the tree shrew. (B) Representative performance for days 1 (left) and 7 (right) demonstrates coarse discrimination learning. The tree shrew initially licks indiscriminately for both S+ (black) and S− (red) trials. After one week of training the shrew licks predominantly on S+ trials, while rejecting S− trials. Lick time histograms (bottom) show a refinement of response times to immediately follow the stimulus presentation on day 7. (C) Mean (+/− SEM) performance showing shrews on average reached criterion performance within one week of training (n = 11; mean days to criterion = 6.17 +/− 2.92 SD) (D) 7 shrews were trained to perform the task with multiple S− offsets. Performance at 10 degree discriminations was unreliable, while shrews were able to achieve reliable suppression of go responses for S− orientations of 22.5 degrees or higher. (E) Mean (+/− SEM) learning curves show fine discriminations of 22.5 degrees reached criterion levels on average after 7.44 days of training (+/− 3.0) (F) Expression of ChR2 under the mdlx enhancer in V1 enabled blue-light mediated suppression in two example pyramidal neurons (top: raw whole-cell voltage recordings; bottom: individual stimulus locked trials in grey, with average traces in black). Fast-spiking excitation was observed in a putative interneuron (top: raw whole-cell trace; bottom: example stimulus locked trial outlined in red above). (G) Orientation tuning curves recorded at varying levels of blue light power from one example neuron show increasing spike suppression across orientations. (H) 5 neurons showed increasing spike suppression at preferred orientation with as little as 1mW/mm2 (I) 2 headfixed shrews were implanted with bilateral windows over V1 expressing ChR2 via the mdlx enhancer. Average discrimination performance was impaired during trials with optogenetic stimulation in both animals. The left two panels show discrimination performance decrements for individual sessions. The right panel shows Δd’ distributions for each animal (*p<0.01 Wilcoxon signed rank test). See also Figure S1.
Figure 2:
Figure 2:. Tracking neural populations over the time reveals learning-related enhancement of neural population discrimination.
(A) Neural response properties were measured at pre- (top) and post-learning (bottom) time points during learning. The neurons within the same field of view were identified across sessions. Example neural response traces for tracked cell bodies are shown as raw dF/F traces (right). (B) Mean stimulus locked traces (+/− SEM) for example neurons in a.. Cell 1 was an S+ selective cell that became more selective over time. Cell 2 was an S− selective cell that became less selective over time. See also Figure S2 (C) Schematic of neural population discrimination. Individual population responses are color coded by stimuli and plotted by their first 2 principle components (top). Each data point (individual trial) was then projected onto the vector connecting the mean response to each stimulus, and d’ measures were computed via the 1-d projection distributions (bottom) (D) Population responses for an example animal before and after learning in neural discrimination space (bottom) and marginal histogram (top). Pre-learning (left) the S+ (Black) and 22.5 degree S− (blue) are highly overlapping. In the post-learning recording (right) the S+ is highly separable from the S− distribution. (E) Five animals display a positive Δd’pop. between pre- and post-learning recordings (*p<0.05, paired t-test). The example animal from D. is shown as a dashed line.
Figure 3.
Figure 3.. Single cell improvements in neural discrimination are predicted by baseline discrimination capacity and reward associations.
(A) Tree shrew V1 contains an orderly map of orientation preference. The orientation preference map is computed from responses to oriented gratings during passive viewing. (B) Average calcium responses to S+ (left) and S− (right) stimuli shown during behavior are distributed over overlapping columns within V1, with many of the same neurons responding for both stimuli. Contours outline cortical regions responding greater than 30% of the maximum response per stimulus, and are overlaid on the orientation map in a. (C) Population response curves from binned single cell responses (dF/F) to S+ (black) and S− (red) stimuli, arranged by preferred orientation for pre- (left) and post-learning (right) conditions. (D) Average binned single cell d’ values arranged by each neuron’s preferred orientation. Pre-learning (left), peak d’ values were observed in neurons with preferred orientations flanking the S+ and S− stimuli, and were lower in between the S+ and S−, indicating that these neurons provide minimal discrimination information for the task. Post-learning (right) a significant bias exists with S+ flanking neurons displaying greater discrimination information than S− flanking neurons. (E) Top: V1 neurons with the greatest learning related improvements in d’sc have preferred orientations neighboring the S+ (black dashed line), but not S− stimulus (red dashed line). Significant increases in d’sc were found up to 30 degrees from the S+ stimulus, while significant decreases in d’sc was observed near the S− stimulus (bottom: averaging Δ d’ over a moving window of preferred orientations in 5 degree increments with 20 degree bin size, mean +/− SEM, *p<0.05 Wilcoxon signed-rank test). (F) Learning related changes in responses to task-relevant stimuli depended largely on the functional properties of neurons relative to the orientations of the task. Top row: percentages of neurons with a significant change (p<0.05, Wilcoxon Signed-rank test) in the magnitude of response to at least one task relevant stimulus out of i. all cells (22%), ii. S+ flanking cells (31%), and iii. S− flanking cells (22%). Middle row: breakdown in specific types of statistically significant changes observed on a cell by cell basis. Out of all cells and S− flanking cells there were heterogenous changes in the magnitude of responses to both stimuli, while S+ flanking cells largely saw increases in S+ responses. Bottom row: total proportions of significantly changing cells exhibiting increases or decreases in response to the S+ or S−. S+ flanking cells are heavily dominated by increases in response to the S+ (66%), while S− flanking neurons show balanced changes with S− decreases being the prevailing change (51%). See also Figures S3 and S4.
Figure 4.
Figure 4.. Single cell improvements in neural discrimination persist during passive stimulus presentations and are consistent with biased shifts in preferred orientation.
(A) As in Figure 3E, single V1 cells with the greatest imcreases in passive d’sc had preferred orientations neighboring the S_, but not S− stimuli. (B) Significant increases in delta d’sc were found between 5 and 30 degrees from the S+ stimulus (averaging delta d’ over a moving window of preferred orientations in 5 degree increments with a 20 degree bin size, mean +/− SEM, *p<0.05 Wilcoxon signed rank test with Bonferroni correction). (C) Three types of hypothetical functional changes leading to selectively increased d’sc in V1 neurons. Top: a positive gain in excitation of a single S+ flanking neuron. Middle: a small shift in preferred orientation toward the S+ orientation. Bottom: an asymmetrically biased increase in excitation in the vicinity of the S+ orientation (D) S+ flanking cells (Top) but not S− flanking cells (Bottom) exhibit a gain in response magnitude (***P<0.001 Wilcoxon signed rank test). (E) S+ flanking cells (Top) but not S− flanking cells (Bottom) exhibit a biased shift in their orientation preference with learning (***P<0.001, Wilcoxon signed rank test). (F) S+ flanking cells (Top) but not S− flanking cells (Bottom) exhibit an overall positive shift in their Asymmetry index with learning (***P<0.001, Wilcoxon signed rank test). (G) Neurons in the S+ flanking domain with high and low increases d’ exhibited significant gains in response magnitude (*p<0.05, **p<0.01, Wilcoxon signed rank test). (H) Only S+ flanking neurons with high increases in d’ exhibited significant positive shifts in preferred orientation (**p<0.01 Wilcoxon signed rank test). (I) Only S+ flanking neurons with high increases in d’ exhibited significant positive shifts in asymmetry index (**p<0.01 Wilcoxon signed rank test). (J) Out of the subpopulation of S+ flanking neurons with high increases in d’, pre-learning orientation preference was not significantly correlated with chang in the magnitude of neuronal response (Linear regression, p>0.06, R-square = 0.17). (K) In the same neurons shown in J, pre learning preferred orientation was not significantly correlated with change in preferred orienatation (Linear regression, p=0.18, R-square = 0.08. (L) In the same neurons shown in J and K, pre-learning preferred orientation was significantly correlated with change in asymmetry index (Linear regression, p<0.01, R-square = 0.39). See also Figure S4.
Figure 5.
Figure 5.. Tree shrew neural discrimination accurately predicts orientation specific benefits and impairments in future behavioral performance.
(A) Learning-related changes in d’pop of the S+ (0 degrees) and a wide range of passively viewed orientations further reveals the orientation specificity of the training effect. Average peak Δd’pop for population discrimination was seen at the 22.5 degrees (equal to the S−), with gradual increases in d’ observed between the S+ and S−. While no average improvements in d’pop were observed for orientations on the other side of the S+, small but significant decreases in discrimination performance were seen in three of these untrained orientations (*p<0.05 Wilcoxon signed rank test). (B) Tree shrews that initially learned the original asymmetric discrimination were introduced to a generalized, symmetric discrimination task in which multiple S− stimuli were introduced on either side of the S+ orientation. 10 days of performance after tree shrews were introduced to a novel task shows that one example shrew was biased to go for novel orientations, but maintained accurate performance for the original discriminations (>= +22.5 degrees). (C) 4 out of 5 tree shrews showed significant transference of skill in discriminating the S+ from novel +12.5 orientation compared to the novel −12.5 S− orientation (Left: **p<0.01, *p<0.05, Wilcoxon signed rank test; Animal 1 is the example in B). Across animals (right), median go rates were higher for the −12.5 degree compared to the +12.5 degree S− stimulus (p<0.05, Wilcoxon signed rank test). (Top D, E) Passively recorded population response curves (as in 3C) for the S+ (black) and a hypothetical novel S− (D: −22.5; E: −12.5; blue) after shrews were trained on the original fine discrimination. Regions of the population that are enhanced through reward association (red) overlap with the regions of the population that respond robustly to both the S+ and novel S− (Bottom D, E) Average post learning d’ for the novel S−’ and original S+ arranged by preferred orientation. Regions with poor discrimination are overlapping with the subpopulation of neurons that are enhanced through reward association for the original task, predicting that the learning of this novel discrimination should be impaired following learning of the original fine discrimination task. (F) Gaussian curves were fit to each day’s psychometric function (see 5B) and tracked for at least 30 days. The peak of the Gaussian is taken as an approximation for the orientation at which the shrew exhibits it’s peak go rate, and thus represents the orientation at which the shrews exhibit minimal discrimination from the S+. Over 30 days of behavioral training, shrews maintain a persistent impairment in discriminating stimuli on the novel side of the S+, and on average continue to associate stimuli within approximately 10 degrees of the S+ with a go response.

Comment in

Similar articles

Cited by

References

    1. Hubel DH, and Wiesel TN (1959). Receptive fields of single neurones in the cat’s striate cortex. The Journal of physiology 148, 574–591. - PMC - PubMed
    1. Marshel JH, Kim YS, Machado TA, Quirin S, Benson B, Kadmon J, Raja C, Chibukhchyan A, Ramakrishnan C, Inoue M, et al. (2019). Cortical layer-specific critical dynamics triggering perception. Science 365. - PMC - PubMed
    1. Jurjut O, Georgieva P, Busse L, and Katzner S (2017). Learning Enhances Sensory Processing in Mouse V1 before Improving Behavior. The Journal of neuroscience : the official journal of the Society for Neuroscience 37, 6460–6474. - PMC - PubMed
    1. Poort J, Khan AG, Pachitariu M, Nemri A, Orsolic I, Krupic J, Bauza M, Sahani M, Keller GB, Mrsic-Flogel TD, et al. (2015). Learning Enhances Sensory and Multiple Non-sensory Representations in Primary Visual Cortex. Neuron 86, 1478–1490. - PMC - PubMed
    1. Danka Mohammed CP, and Khalil R (2020). Postnatal Development of Visual Cortical Function in the Mammalian Brain. Frontiers in systems neuroscience 14, 29. - PMC - PubMed

Publication types

LinkOut - more resources