. 2022 Jul 7;185(14):2452-2468.e16.
doi: 10.1016/j.cell.2022.06.008. Epub 2022 Jun 13.

Mild respiratory COVID can cause multi-lineage neural cell and myelin dysregulation

Affiliations

Mild respiratory COVID can cause multi-lineage neural cell and myelin dysregulation

Anthony Fernández-Castañeda et al. Cell. .

Abstract

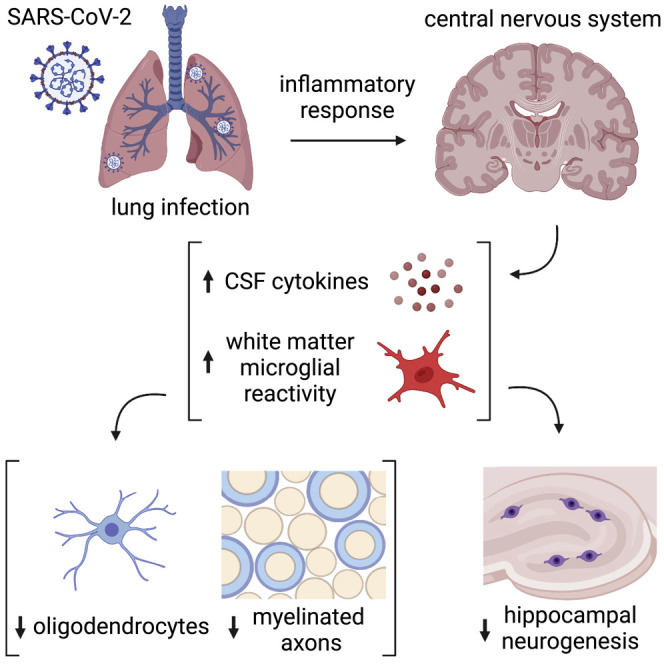
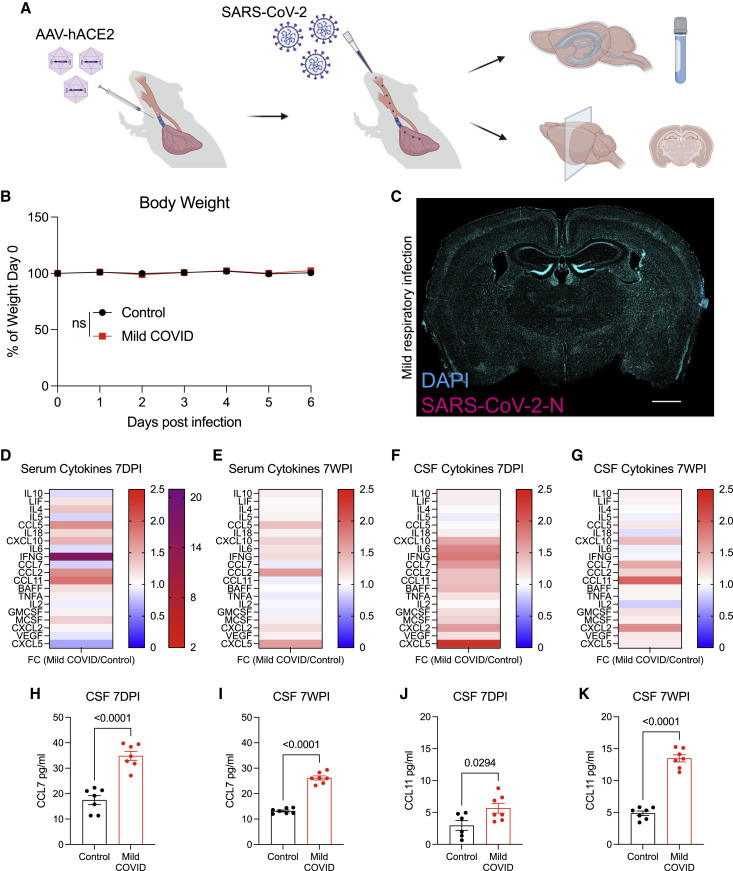
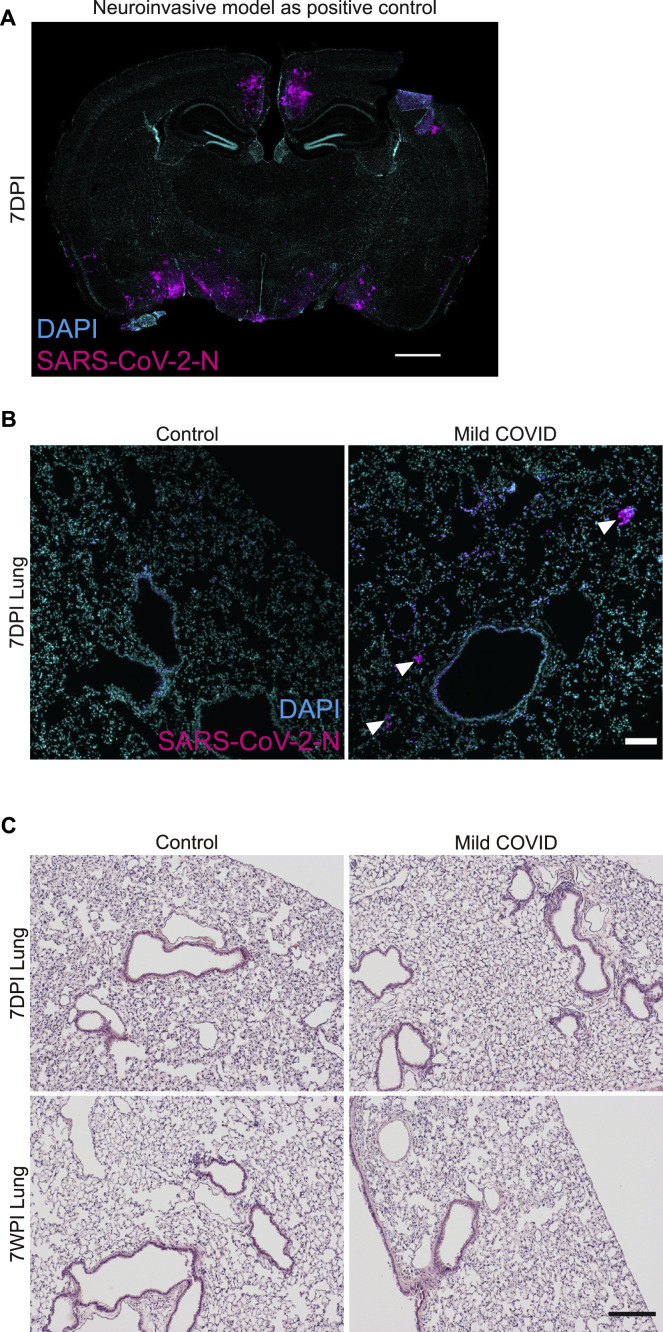
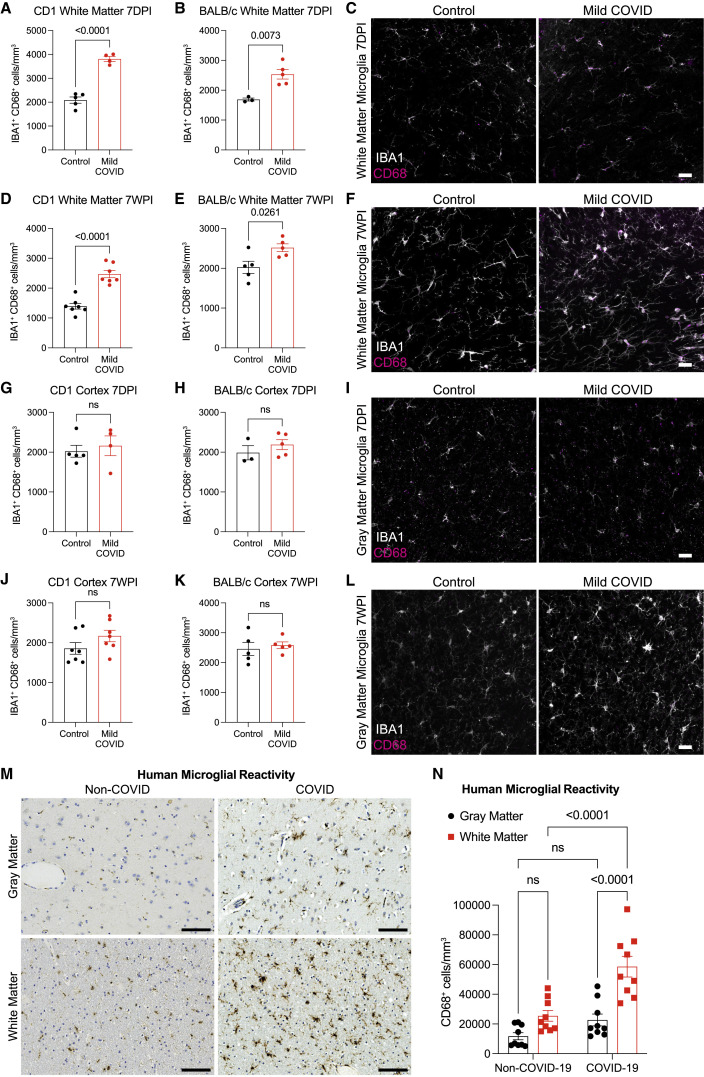
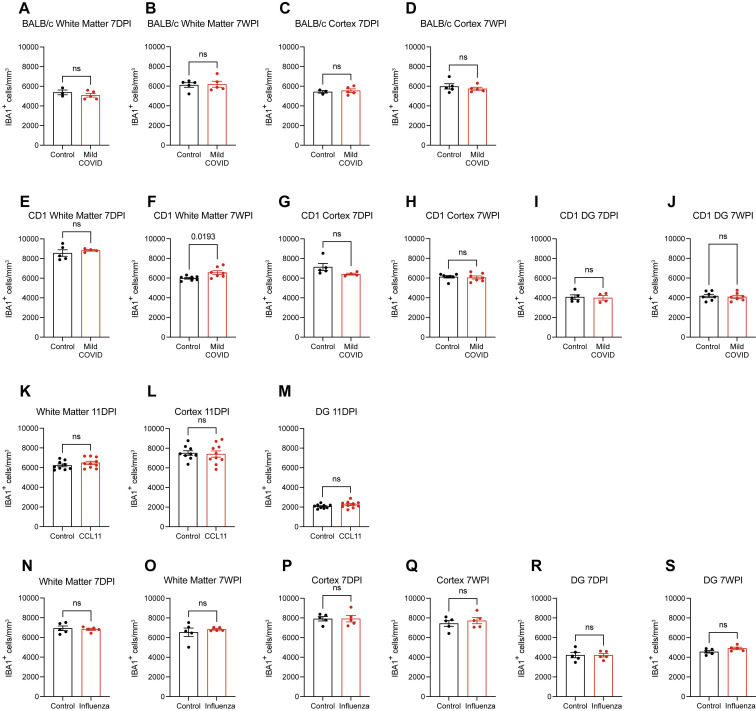
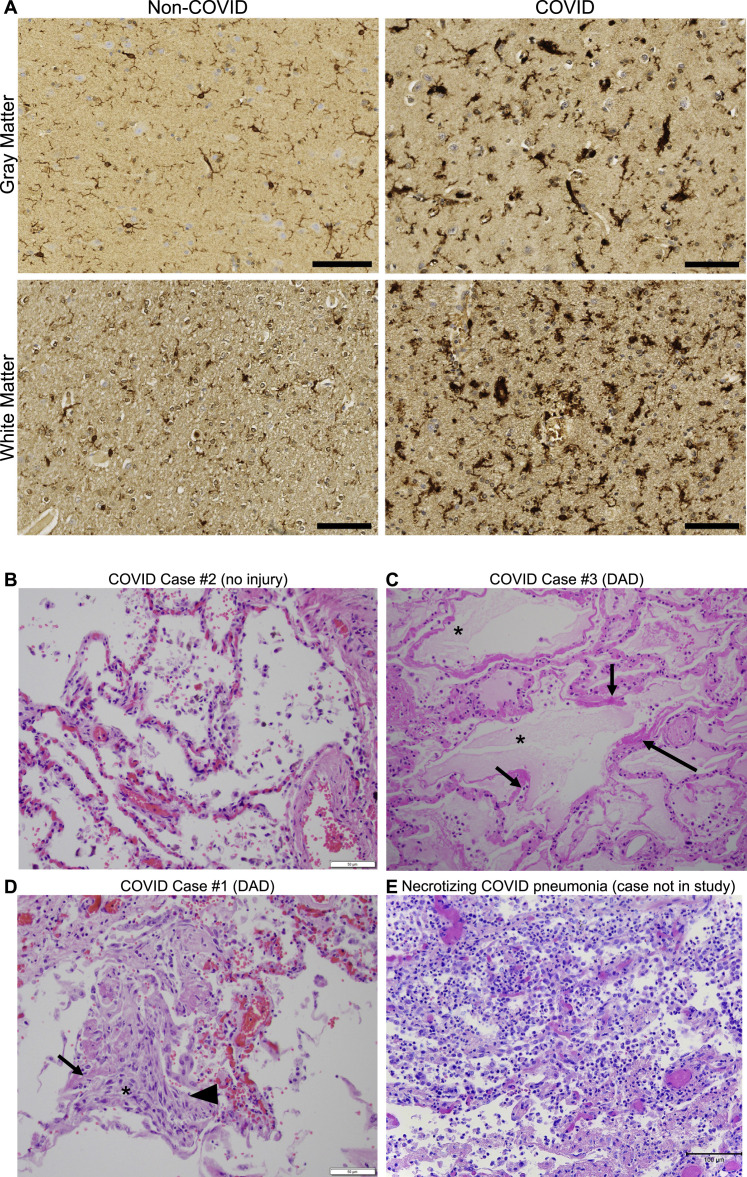
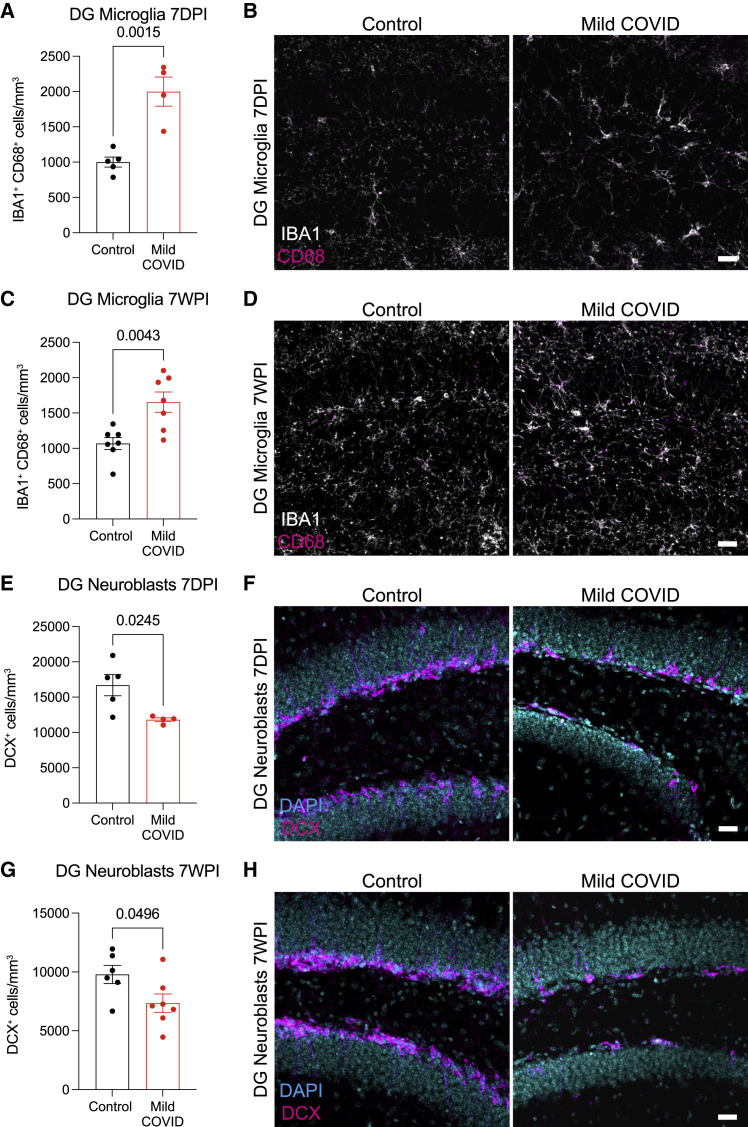
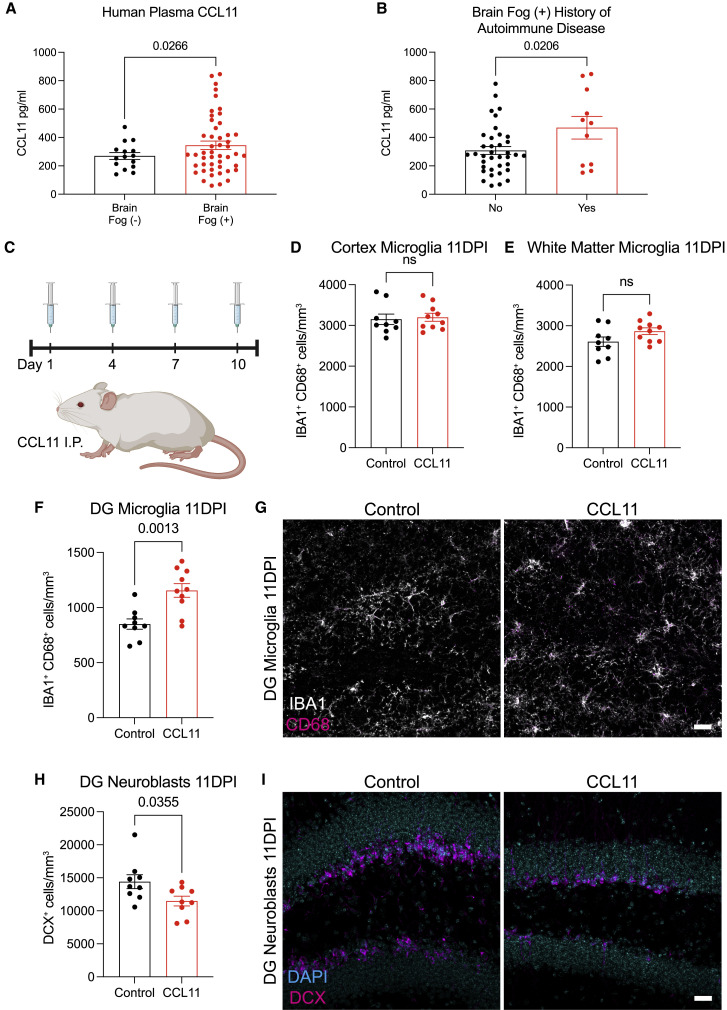
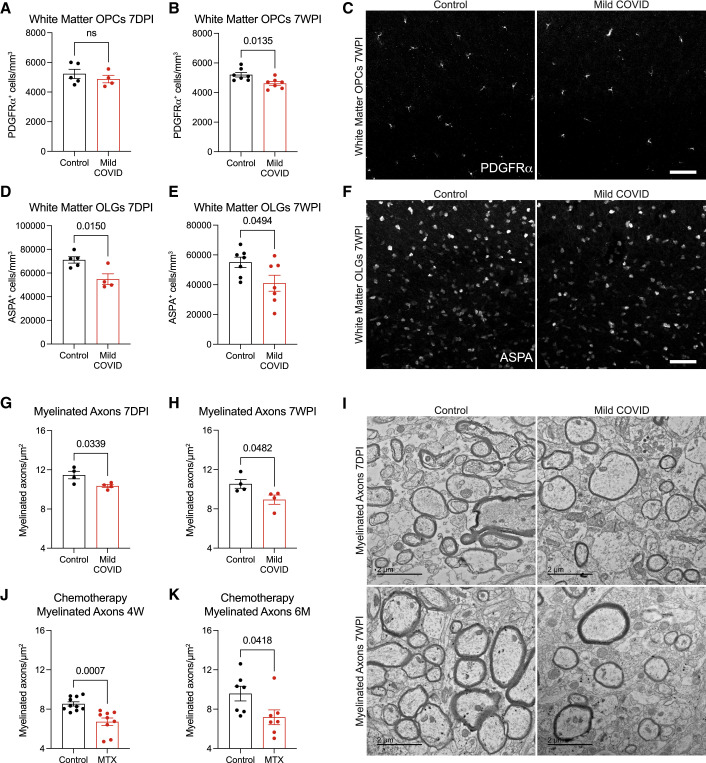
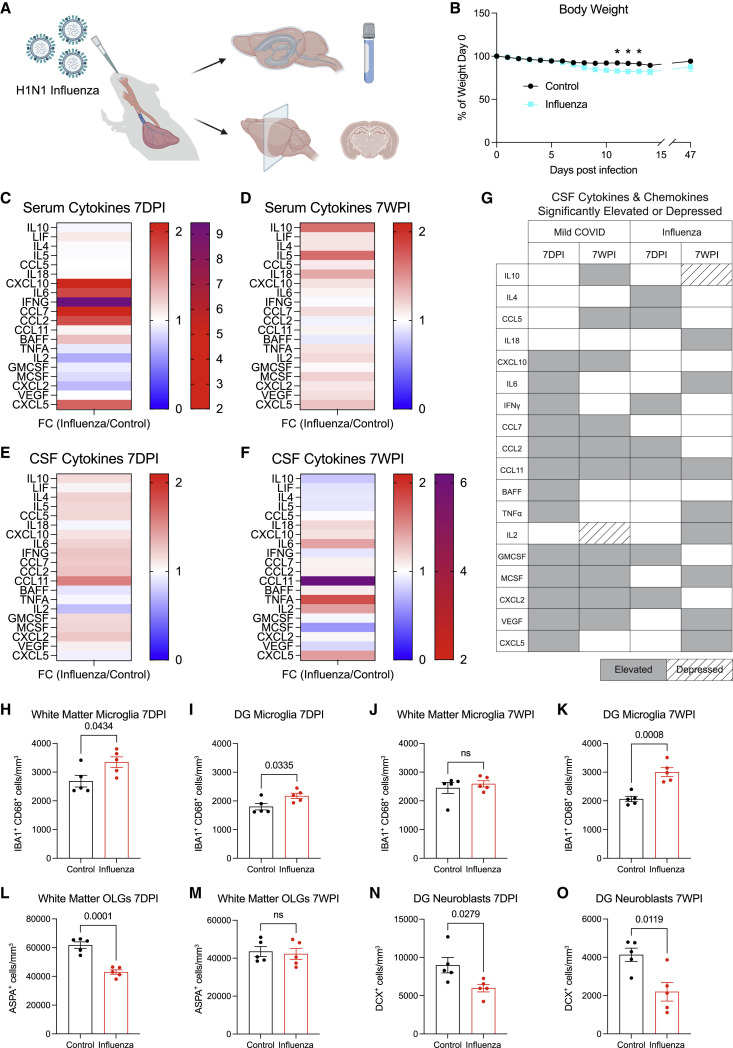
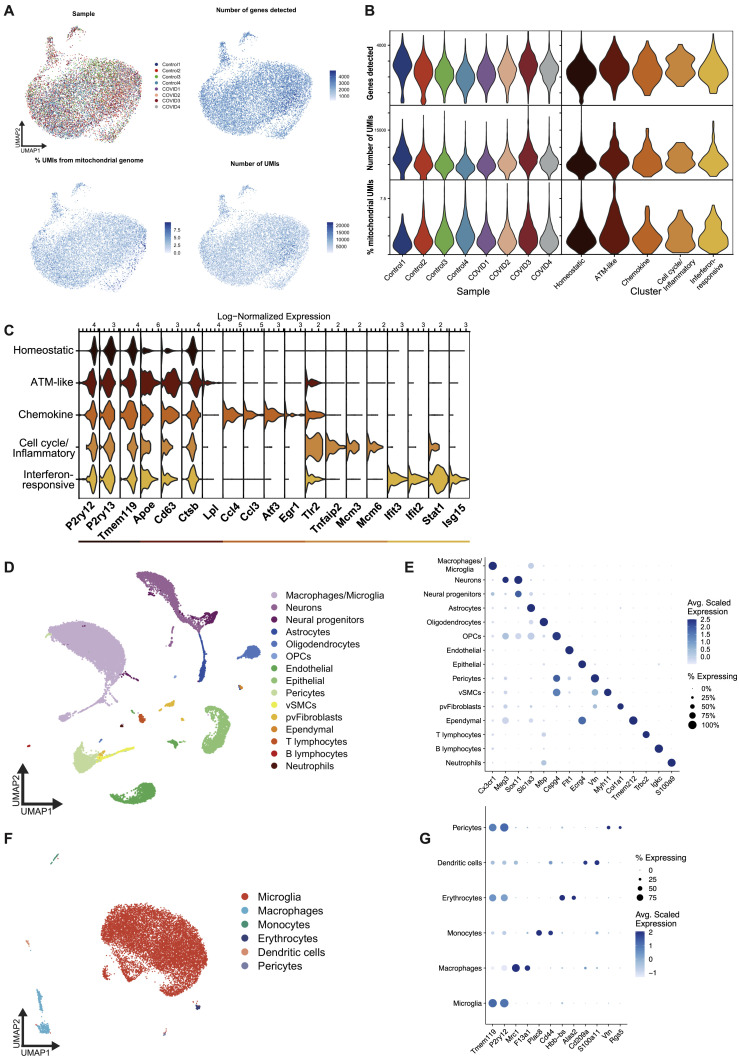
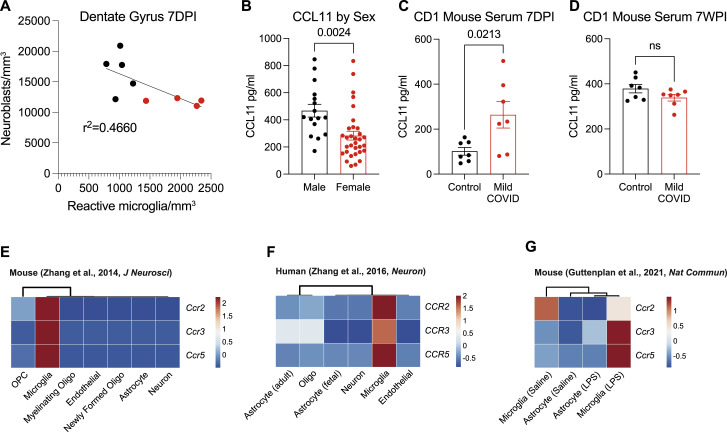
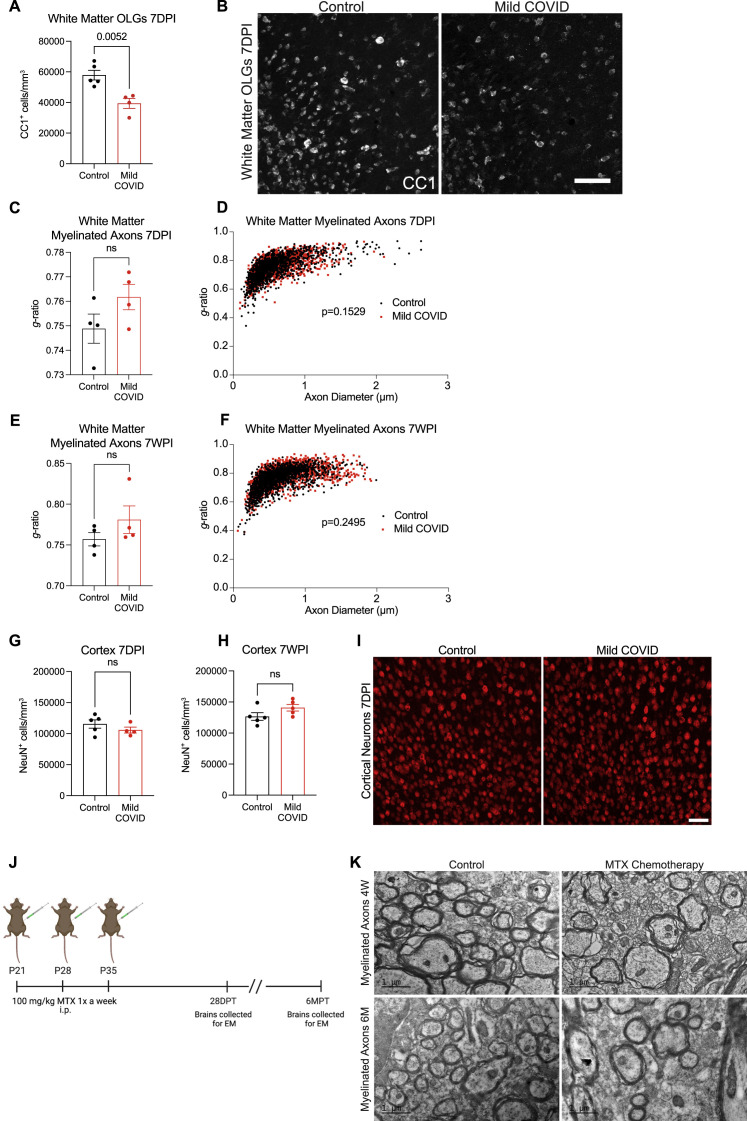
COVID survivors frequently experience lingering neurological symptoms that resemble cancer-therapy-related cognitive impairment, a syndrome for which white matter microglial reactivity and consequent neural dysregulation is central. Here, we explored the neurobiological effects of respiratory SARS-CoV-2 infection and found white-matter-selective microglial reactivity in mice and humans. Following mild respiratory COVID in mice, persistently impaired hippocampal neurogenesis, decreased oligodendrocytes, and myelin loss were evident together with elevated CSF cytokines/chemokines including CCL11. Systemic CCL11 administration specifically caused hippocampal microglial reactivity and impaired neurogenesis. Concordantly, humans with lasting cognitive symptoms post-COVID exhibit elevated CCL11 levels. Compared with SARS-CoV-2, mild respiratory influenza in mice caused similar patterns of white-matter-selective microglial reactivity, oligodendrocyte loss, impaired neurogenesis, and elevated CCL11 at early time points, but after influenza, only elevated CCL11 and hippocampal pathology persisted. These findings illustrate similar neuropathophysiology after cancer therapy and respiratory SARS-CoV-2 infection which may contribute to cognitive impairment following even mild COVID.

Keywords: COVID-19; H1N1 influenza; cognitive impairment; hippocampal neurogenesis; long COVID; microglia; myelin; neuroinflammation; oligodendrocytes.


Conflict of interest statement

Declaration of interests A.I. served as a consultant for Spring Discovery, Boehringer Ingelheim (Ingelheim, Germany), and Adaptive Biotechnologies. M.M. serves in the scientific advisory board of Cygnal Therapeutics. S.A.L. sits on the scientific advisory board and has a financial interest in AstronauTx Ltd. The opinions and assertions expressed herein are those of the authors and do not reflect the official policy or position of the Uniformed Services University of the Health Sciences or the Department of Defense.

Figures

None
Graphical abstract
Figure 1
Figure 1
Mild respiratory COVID mouse model exhibits CSF cytokine/chemokine elevations (A) Schematic of experimental paradigm for respiratory system-restricted SARS-CoV-2 infection in mice and experimental workflow. Created with biorender.com. (B) Body weight (% of day 0 weight) of control and mild COVID mice. Data shown as mean ± SEM; n = 24 mice per group; ns, p > 0.05 by two-way ANOVA with multiple comparisons. (C) Confocal micrograph of SARS-CoV-2 nucleocapsid protein (SARS-CoV-2-N) 7 days post-infection (7DPI). SARS-CoV-2-N, magenta; DAPI, cyan. Scale bars, 1 mm. (D and E) Cytokine analyses of serum in control and mild COVID mice 7 days post-infection (D) and 7 weeks post-infection (7WPI) (E). Data shown as fold change (FC) median fluorescence intensity compared with control group; n = 5–7 (CD1 strain) mice per group. See Table S1 for individual statistics. (F and G) Cytokine analyses of CSF in control and mild COVID mice 7 days post-infection (F) and 7 weeks post-infection (G). Data shown as fold change (FC) median fluorescence intensity compared with control group; n = 6–7 mice (CD1 strain) per group. See Table S1 for individual statistics. (H and I) CSF levels of CCL7 from mice 7 days post-infection (H) and 7 weeks post-infection (I). n = 7 mice per group. (J and K) CCL11 levels in CSF of mice 7 days post-infection (J) and 7 weeks post-infection (K). n = 6 mice per control group and n = 7 mice per mild COVID group in (J). n = 7 mice per group in (K). Data shown as mean ± SEM; each dot represents an individual mouse; p values shown in figure panels; ns, p > 0.05; two-tailed unpaired t test. See also Figure S1, Table S1, and Data S1.
Figure S1
Figure S1
SARS-CoV-2 mouse models, related to Figure 1 (A) Neuroinvasive SARS-CoV-2 mouse model as a positive control for detection of virus in the brain. Confocal micrograph of coronal section of mouse brain, illustrating SARS-CoV-2 nucleocapsid protein (SARS-CoV-2-N) 7 days post-infection (7DPI) (SARS-CoV-2-N, magenta; DAPI, cyan). Scale bars, 1 mm. (B) Mild respiratory COVID mouse model, detection of virus in the lung. Representative confocal micrographs of SARS-CoV-2 nucleocapsid protein (SARS-CoV-2-N, magenta; DAPI, cyan) in mouse lung 7 days post-infection, a time point at which the viral infection is largely cleared. Arrowheads highlight SARS-CoV-2-N nucleocapsid protein immunostaining (magenta). Scale bars, 100 μm. (C) Mild respiratory COVID mouse model, hematoxylin and eosin (H&E) histology in mouse lung tissue at 7 days and 7 weeks post-mild respiratory SARS-CoV-2 infection (7WPI). Minimal interstitial infiltrates with patchy lymphoid aggregates were observed without evidence of alveolar damage. Scale bars, 200 μm.
Figure 2
Figure 2
White matter microglial reactivity after mild respiratory COVID (A and B) Activated microglia (IBA1+ CD68+) quantification 7 days post-infection in the cingulum of the corpus callosum of (A) CD1 (n = 5 control, 4 mild COVID mice) and (B) BALB/c (n = 3 control, n = 5 mild COVID mice). (C) Representative confocal micrographs of reactive microglia (IBA1, white; CD68, magenta) in the cingulum of the corpus callosum of BALB/c mice 7 days post-infection. (D and E) Reactive microglia (IBA1+ CD68+) quantification 7 weeks post-infection in the cingulum of the corpus callosum of (D) CD1 (n = 7 mice/group) and (E) BALB/c (n = 5 mice/group) mice. (F) Representative confocal micrographs of reactive microglia (IBA1, white; CD68, magenta) in the cingulum of the corpus callosum of BALB/c mice 7-weeks post-infection. (G and H) Reactive microglia (IBA1+ CD68+) quantification 7 days post-infection in the cortical gray matter of (G) CD1 (n = 5 control, 4 mild COVID mice) and (H) BALB/c (n = 3 control, n = 5 mild COVID mice). (I) Representative confocal micrographs of reactive microglia (IBA1, white; CD68, magenta) in the cortical gray matter of BALB/c mice 7 days post-infection. (J and K) Reactive microglia quantification (IBA1+ CD68+) 7 weeks post-infection in the cortical gray matter of (J) CD1 (n = 7 mice/group) and (K) BALB/C (n = 5 mice/group). (L) Representative confocal micrographs of reactive microglia (IBA1, white; CD68, magenta) in the cortical gray matter of BALB/c mice 7 weeks post-infection. Data shown as mean ± SEM; each dot represents an individual mouse; p values shown in figure panels; ns p > 0.05 by two-tailed, unpaired t test. (C, F, I, and L) Scale bars, 50 μm. (M) Representative micrographs of CD68 immunostaining (brown) in the gray (cerebral cortex) or subcortical white matter of human subjects with COVID or in non-COVID control subjects. (N) Reactive microglia (CD68+ cells) quantification (n = 9 human subjects for each group). Data shown as mean ± SEM; ns, p > 0.05 by two-way ANOVA with multiple comparisons; each dot represents a mouse or human subject. Scale bars, 100 μm. See also Figures S2 and S3, Table S2, and Data S1.
Figure S2
Figure S2
Total microglia counts, related to Figures 2, 4, 5, and 7 (A–S) Total microglial counts (IBA1+ cells), assessed at 7-days or 7-weeks following mild respiratory COVID in cortex or subcortical white matter of BALB/c (A–D) and CD1 (E–H) mouse strains and in hippocampal white matter of the dentate gyrus (DG) of CD1 mice (I and J), or assessed in cortex, subcortical white matter and hippocampal white matter at the end of a CCL11 systemic administration paradigm (11 days post-injection [DPI], K–M), or assessed in cortex, subcortical white matter and hippocampal white matter following (N–S). Data shown as mean ± SEM; each dot represents an individual mouse; p values shown in figure panels; ns p > 0.05; two-tailed unpaired t test.
Figure S3
Figure S3
Human histopathology, related to Figure 2 (A) Representative micrographs of pan-microglial marker IBA1 immunostaining (brown) in the cerebral cortex (gray matter) or subcortical white matter of human subjects with or without COVID. Scale bars, 100 μm. (B–E) Representative micrographs of lung tissue from human subjects with COVID. (B) COVID Case #2 with no definite pneumonia or diffuse alveolar damage. Scale bar, 50 μm. (C) COVID Case #3. Lung showing intra-alveolar fluid (), and early hyaline membrane formation (arrows), indicative of acute alveolar damage (200× magnification). (D) COVID Case #1. Lung showing diffuse alveolar damage including hyaline membranes (arrow), organizing pneumonia () and reactive pneumocytes (arrowhead). Scale bars, 50 μm. (E) For comparison, an example of necrotizing COVID pneumonia (from a case not represented in this study) with alveolar spaces obliterated by significant infiltrative immune cells, chiefly neutrophils and macrophages. Vascular congestion present. Scale bars, 100 μm.
Figure 3
Figure 3
Microglia exhibit heterogeneous transcriptional changes after mild respiratory COVID (A) UMAP plot of microglia colored by cluster, divided between mild COVID and control samples (n = 4 mice/group, 5,983 single microglial cells from mild COVID mice and 5,967 single microglial cells from control mice). ATM, axon tract microglia (Hammond et al., 2019). (B) Right: quantification of the proportion of microglia per sample from each microglia cluster, comparing between mild COVID and control samples; left: bar plot showing the log2 fold change between median proportions in mild COVID samples versus control samples. Positive fold change indicates higher proportion in mild COVID samples. FDR refers to false discovery rate calculated from moderated t test using Benjamini and Hochberg correction for multiple comparisons. See STAR Methods for differential abundance testing statistics. (C) Volcano plot illustrating results of differential expression testing between chemokine cluster microglia and all other microglia. (D) Violin plots illustrating expression of eight genes upregulated in homeostatic cluster microglia from mild COVID samples compared with controls. (E) Volcano plot illustrating results of differential expression testing between homeostatic cluster microglia from mild COVID samples compared with controls. These differentially expressed genes are abbreviated ΔHomeostatic. For (C and E), plots depict results of two-sided Wilcoxon rank-sum test. p values shown are adjusted for multiple comparisons using Bonferroni correction. Genes were deemed differentially expressed if the magnitude of the average log2 fold change exceeded 0.25 and the adjusted p value was less than 0.05. Upregulated genes are highlighted in red; downregulated genes are highlighted in blue. (F) Upset plot comparing the intersections between upregulated genes from the chemokine microglia cluster gene signature, and the genes upregulated in the homeostatic microglia cluster in mild COVID compared with control, and the genes upregulated in white matter-associated microglia (WAM) (Safaiyan et al., 2021), disease-associated microglia (DAM) (Safaiyan et al., 2021), lipid-droplet-accumulating microglia (LDAM) (Marschallinger et al., 2020), and microglia following demyelinating injury from lysolecithin (LPC) (Hammond et al., 2019). (G) Dot plots depicting the percentage of the upregulated or downregulated genes from the chemokine or ΔHomeostatic signatures which are also up- or downregulated, respectively, in the compared signatures. See also Figures S4 and S5, Tables S2 and S3, and Data S1.
Figure S4
Figure S4
Single-cell RNA sequencing of microglia after mild respiratory COVID in mice, related to Figure 3 (A) Heatmap of Z-scored average expression of the top 20 positive marker genes by average log2 fold change for each microglia cluster. (B) UMAP plots overlaid with log-normalized expression of chemokine genes, illustrating expression in the chemokine microglia cluster. (C) Split UMAP plot overlaid with log-normalized expression of Cd300lf, which is upregulated in microglia following mild respiratory SARS-CoV-2 infection. (D) Similarity matrix illustrating clustering of all gene ontology biological process terms, which were significantly enriched in the chemokine gene signature based on semantic similarity. (E) Similarity matrix of clustering of GO terms enriched in the ΔHomeostatic gene signature. For (D and E), significance of GO term enrichment was tested using over-representation permutation test. Threshold of significance was Benjamini and Hochberg corrected p value < 0.01. See Table S3 for complete results. GO term clusters were manually annotated with the descriptions at the right-hand side. (F) Upset plot comparing the intersections between downregulated genes from the chemokine microglia cluster gene signature, and the genes downregulated in the homeostatic microglia cluster in COVID samples versus control, and the genes downregulated in white matter-associated microglia (WAM; Safaiyan et al., 2021), disease-associated microglia (DAM; Safaiyan et al., 2021), lipid-droplet-accumulating microglia (LDAM; Marschallinger et al., 2020), and microglia following demyelinating injury from lysolecithin (LPC; Hammond et al., 2019).
Figure 4
Figure 4
Decreased hippocampal neurogenesis after mild respiratory COVID (A) Reactive microglia (IBA1+ CD68+) quantification 7 days post-infection (7DPI) in the dentate gyrus (hilar white matter) (n = 5 control, n = 4 mild COVID mice). (B) Representative confocal micrographs of reactive microglia (IBA1, white; CD68, magenta) in the dentate gyrus 7 days post-infection in control and mild COVID mice. (C) Reactive microglia (IBA1+ CD68+) quantification 7 weeks post-infection (7WPI) in the dentate gyrus of control and mild COVID mice (n=7 mice/group). (D) Representative confocal micrographs of reactive microglia (IBA1, white; CD68, magenta) in the dentate gyrus of control and mild COVID mice 7 weeks post-infection. (E) Neuroblast (DCX+) quantification 7 days post-infection in the dentate gyrus of control (n = 5) and mild COVID (n = 4) mice. (F) Representative confocal micrographs of neuroblasts (DCX, magenta; DAPI, cyan) in the dentate gyrus of control and mild COVID mice 7 days post-infection. (G) Neuroblast (DCX+) quantification 7 weeks post-infection in the dentate gyrus of control (n = 6) and mild COVID (n = 7) mice. (H) Representative confocal micrographs of neuroblasts (DCX, magenta; DAPI, cyan) in the dentate gyrus of control and mild COVID mice 7 weeks post-infection. Data shown as mean ± SEM; each dot represents an individual mouse (A, C, E, and G). (A, C, E, and G) unpaired two-tailed t test. p values shown in figure panels. Scale bars, 50 μm. DG, dentate gyrus. See also Figure S2 and Data S1.
Figure 5
Figure 5
Elevated CCL11 levels associated with cognitive impairment induce hippocampal dysregulation (A) Plasma levels of CCL11 in people experiencing long COVID with (n = 48 human subjects, brain fog [+]) and without (n = 15 human subjects, brain fog [−]) cognitive symptoms. (B) History of autoimmune disease in patients reporting “brain fog” (n = 37 human subjects without history of autoimmune disease, n = 11 human subjects with history of autoimmune disease). (C) Timeline of CCL11 challenge in CD1 strain mice. Brains were collected 24 h after last injection (day 11 post-injection, 11DPI). Created with biorender.com. (D and E) Reactive microglia (IBA1+ CD68+) quantification 11 days post-CCL11 injection in the cortical gray matter (D) and cingulum of the corpus callosum (E) of mice (n = 9 control, n = 10 CCL11-treated mice). (F) Reactive microglia (IBA1+ CD68+) quantification 11 days post-CCL11 injection in the dentate gyrus of mice (n = 9 control, n = 10 CCL11-treated mice). (G) Representative confocal micrographs of activated microglia (IBA1, white; CD68, magenta) in the dentate gyrus of mice 11 days post-CCL11 injection. (H) Neuroblast (DCX+) quantification 11 days post-injection in the dentate gyrus of mice (n = 9 mice/group). (I) Representative confocal micrographs of neuroblasts (DCX, magenta; DAPI, cyan) in the dentate gyrus of mice 11 days post-CCL11 injection. Data shown as mean ± SEM. (A, B, D–F, and H) unpaired two-tailed t test. ns, p > 0.05. p values shown in figure panels. Each dot represents one mouse or human subject. Scale bars, 50 μm. DG, dentate gyrus. See also Figures S2 and S6 and Data S1.
Figure 6
Figure 6
Oligodendrocyte and myelin loss after mild respiratory COVID (A and B) Oligodendrocyte precursor cell (PDGFRα+) quantification in the cingulum of the corpus callosum of CD1 strain mice 7 days (n = 5 control, n = 4 mild COVID mice) (A) and 7 weeks (n = 7 mice/group) (B) post-infection (7DPI and 7WPI, respectively). (C) Representative confocal micrographs of oligodendrocyte precursor cells (PDGFRα, white) in the cingulum of the corpus callosum of mice 7 weeks post-infection. Scale bar, 50 μm. (D and E) Oligodendrocyte (ASPA+) quantification in the cingulum of the corpus callosum of mice 7 days post-infection (n = 5 control, n = 4 mild COVID mice) (D) and 7 weeks post-infection (n = 7 mice/group) (E). (F) Representative confocal micrographs of oligodendrocytes (ASPA, white) in the cingulum of the corpus callosum of mice 7 weeks post-infection. Scale bars, 50 μm. (G and H) Quantification of myelinated axons in the cingulum of the corpus callosum of mice 7 days post-infection (G) and 7 weeks post-infection (H) (n = 4 mice/group). (I) Representative transmission electron microscopy (EM) images at the level of the cingulum of the corpus callosum in cross-section for (G and H). Myelinated axons evident as electron-dense myelin sheaths encircling axons, viewed in cross-section. Scale bars, 2 μm. (J and K) Comparison to methotrexate chemotherapy-related cognitive impairment model: quantification of myelinated axons in the cingulum of the corpus callosum at 4 weeks post-methotrexate chemotherapy treatment (n = 10 vehicle control, n = 9 MTX-treated mice; J) and 6 months post-methotrexate chemotherapy treatment (n = 7 mice/group; K). Data shown as mean ± SEM; each dot represents an individual mouse; unpaired, two-tailed t test. p values shown in figure panels. OPCs, oligodendrocyte precursor cells; OLGs, oligodendrocytes; MTX, methotrexate. See also Figures S7 and Data S1.
Figure 7
Figure 7
Comparison of neuroinflammatory response and cellular deficits following mild respiratory H1N1 influenza (A) Schematic of experimental paradigm for respiratory H1N1 influenza infection in CD1 strain mice and experimental workflow. Created with biorender.com. (B) Body weight (% of day 0 weight) of control and influenza mice. Data shown as mean ± SEM; n = 5 mice/group; p < 0.05 by two-way ANOVA with multiple comparisons. (C and D) Cytokine analyses of serum in control and influenza mice 7 days post-infection (7DPI) (C) and 7 weeks post-infection (7WPI) (D). Data shown as fold change (FC) median fluorescence intensity compared with control group; n = 4–5 mice/group. See Table S4 for individual statistics. (E and F) Cytokine analysis of CSF in control and influenza mice 7-days post-infection (E) and 7-weeks post-infection (F). Data shown as fold change (FC) median fluorescence intensity compared with control group; n = 5 mice/group. See Table S4 for individual statistics. (G) Chart illustrating CSF cytokines and chemokines that were significantly elevated or depressed in mild COVID and influenza cohorts at 7 days post-infection and 7 weeks post-infection. (H and I) Reactive microglia (IBA1+ CD68+) quantification 7 days post-influenza infection in the cingulum of the corpus callosum (H) and dentate gyrus (I) of mice (n = 5 mice/group). (J and K) Reactive microglia (IBA1+ CD68+) quantification 7 weeks post-influenza infection in the cingulum of the corpus callosum (J) and dentate gyrus (K) of mice (n = 5 mice/group). (L and M) Oligodendrocyte (ASPA+) quantification in the cingulum of the corpus callosum of mice 7 days post-influenza infection (L) and 7 weeks post-influenza infection (M) (n = 5 mice/group). (N and O) Neuroblast (DCX+) quantification 7 days post-influenza infection (N) and 7 weeks post-influenza infection in the dentate gyrus of mice (n = 5 mice/group). Data shown as mean ± SEM; each dot represents an individual mouse (H–O). Unpaired two-tailed t test in (H–O). ns, p > 0.05. p values shown in figure panels. DG, dentate gyrus. See also Figures S2, Table S4 and Data S1.
Figure S5
Figure S5
Microglia single-cell RNA sequencing quality controls, related to Figure 3 (A) UMAP plots overlaid with sample metadata and common quality control metrics. (B) Violin plots of common quality control metrics across samples and microglia clusters. (C) Violin plots of log-normalized expression of top marker genes for each microglia cluster. (D) UMAP plot depicting first round of clustering and cell type annotation, used to identify microglia for downstream analysis. Cell types were annotated based on marker gene expression, some of which is shown in (E). (E) Dot plot showing the average scaled expression of cell type markers across the original clusters, demonstrating the validity of the cell type labels. The size of each dot corresponds to the proportion of cells in the indicated group which express the gene. (F) UMAP showing subclustered cells from the macrophages/microglia cluster depicted in (D) and (E), with newly updated cell type labels. This second round of clustering was performed to remove contaminating cells of other types before a third round of clustering to identify microglia states. (G) Dot plot showing expression of cell type marker genes used in the annotation of the clusters shown in (F). Note that while some non-microglial clusters appear to express the microglia-specific markers Tmem119 and P2ry12, this is driven by a small number of outlier microglia which clustered with these non-microglial cell types. The final microglia cluster does not express canonical markers of these other cell types, indicating that the cluster is highly pure. Analysis of this group of cells is what appears in Figure 3.
Figure S6
Figure S6
Microglial reactivity, CCL11 levels, and microglial CCL11 receptor expression, related to Figure 5 (A) Correlation between neuroblasts (DCX+) and activated microglia (IBA1+ CD68+) in the dentate gyrus of CD1 strain mice 7 days post-infection (7DPI). Line fitted with simple linear regression (n = 5 mice per control group; n = 4 mice per mild COVID group), related to Figure 4. (B) Plasma levels of people experiencing long COVID with “brain fog” broken down by sex (n = 16 subjects per male group; n = 32 subjects per female group), related to Figure 5. (C and D) Serum levels of CCL11 from CD1 strain mice 7 days post-infection and 7 weeks post-infection (7WPI) (D) n = 7 mice per group, related to Figure 1. (E–G) CCR2, CCR3, and CCR5 transcriptional expression in mouse neural cell types (E), human neural cells (F), and mouse reactive microglia and astrocytes after lipopolysaccharide (LPS) stimulation (G). (E–G) Data are expressed as row-scaled FPKM. Rows are centered; unit variance scaling is applied to rows. Columns are clustered using correlation distance and average linkage. Data in (B–D) shown as mean ± SEM; each dot represents an individual mouse or human subject; p values shown in figure panels; ns p > 0.05; two-tailed unpaired t test.
Figure S7
Figure S7
Myelinated axon deficits after mild respiratory COVID or methotrexate chemotherapy, related to Figure 6 (A) Oligodendrocyte (CC1+) quantification in the cingulum of the corpus callosum of mild COVID and control mice 7 days post-infection (n = 5 mice per control group; n = 4 mice per mild COVID group). (B) Representative confocal micrographs of oligodendrocytes (CC1, white) in the cingulum of the corpus callosum of mild COVID and control mice 7 days post-infection. Scale bars, 50 μm. (C) Cumulative g ratios of myelinated axons per animal at 7 days post-infection (n = 4 mice per group). (D) Scatter plots of g ratio relative to axon diameter 7 days post-infection. Black dots, control axons; red dots, axons from mice with mild respiratory COVID. (E) Cumulative g ratios of myelinated axons per animal at 7 weeks post-infection (n = 4 mice per group). (F) Scatter plots of g ratio relative to axon diameter 7 weeks post-infection. Black dots, control axons; red dots, axons from mice with mild respiratory COVID. (G) Deep layer cortical neuron (NeuN+) density quantified in frontal (M2) cortex of mild COVID and control mice 7 days post-infection (n = 5 mice per control group; n = 4 mice per mild COVID group). (H) Deep layer cortical neuron (NeuN+) density quantified in frontal (M2) cortex of mild COVID and control mice 7 weeks post-infection (n = 5 mice per control group; n = 5 mice per mild COVID group). (I) Representative confocal micrographs of deep layer cortical neurons (NeuN, red) in mild COVID and control mice 7 days post-infection. Scale bars, 50 μm. (J) Schematic of experimental paradigm for methotrexate (MTX) chemotherapy administration in mice. 100 mg/kg MTX was administered via intraperitoneal (i.p.) injection on post-natal day (P)21, P28, and P35 and brains were collected for electron microscopy (EM) 28 days after the final MTX dose and 6 months after the final MTX dose. DPT, days post-treatment; MPT, months post-treatment; EM, electron microscopy. Schematic created with biorender.com. (K) Representative transmission electron microscopy (EM) images at the level of the cingulum of the corpus callosum in cross-section at 4 weeks and 6 months following MTX exposure, related to Figures 6J and 6K. Myelinated axons evident as electron-dense myelin sheaths encircling axons, viewed in cross-section. Scale bars, 1 μm. p values shown in (D) and (F) were obtained by comparing mean g ratios per mouse between groups in (C) and (E), respectively. Data in (A), (C), (E), (G), and (H) shown as mean ± SEM; each dot represents an individual mouse; unpaired, two-tailed t test; ns, p > 0.05; p value shown in figure panel.

Comment in

References

    1. Acharya M.M., Green K.N., Allen B.D., Najafi A.R., Syage A., Minasyan H., Le M.T., Kawashita T., Giedzinski E., Parihar V.K., et al. Elimination of microglia improves cognitive function following cranial irradiation. Sci. Rep. 2016;6:31545. doi: 10.1038/srep31545. - DOI - PMC - PubMed
    1. Alvarez-Errico D., Aguilar H., Kitzig F., Brckalo T., Sayós J., López-Botet M. IREM-1 is a novel inhibitory receptor expressed by myeloid cells. Eur. J. Immunol. 2004;34:3690–3701. doi: 10.1002/eji.200425433. - DOI - PubMed
    1. Antonelli M., Penfold R.S., Merino J., Sudre C.H., Molteni E., Berry S., Canas L.S., Graham M.S., Klaser K., Modat M., et al. Risk factors and disease profile of post-vaccination SARS-CoV-2 infection in UK users of the COVID Symptom Study app: a prospective, community-based, nested, case-control study. Lancet Infect. Dis. 2022;22:43–55. doi: 10.1016/S1473-3099(21)00460-6. - DOI - PMC - PubMed
    1. Ayoub R., Ruddy R.M., Cox E., Oyefiade A., Derkach D., Laughlin S., Ades-Aron B., Shirzadi Z., Fieremans E., MacIntosh B.J., et al. Assessment of cognitive and neural recovery in survivors of pediatric brain tumors in a pilot clinical trial using metformin. Nat. Med. 2020;26:1285–1294. doi: 10.1038/s41591-020-0985-2. - DOI - PMC - PubMed
    1. Becker J.H., Lin J.J., Doernberg M., Stone K., Navis A., Festa J.R., Wisnivesky J.P. Assessment of cognitive function in patients After COVID-19 infection. JAMA Netw. Open. 2021;4:e2130645. doi: 10.1001/jamanetworkopen.2021.30645. - DOI - PMC - PubMed

Publication types