. 2022 Jun 29;13(1):3747.
doi: 10.1038/s41467-022-31301-8.

Host lung microbiota promotes malaria-associated acute respiratory distress syndrome

Affiliations

Host lung microbiota promotes malaria-associated acute respiratory distress syndrome

Debanjan Mukherjee et al. Nat Commun. .

Abstract

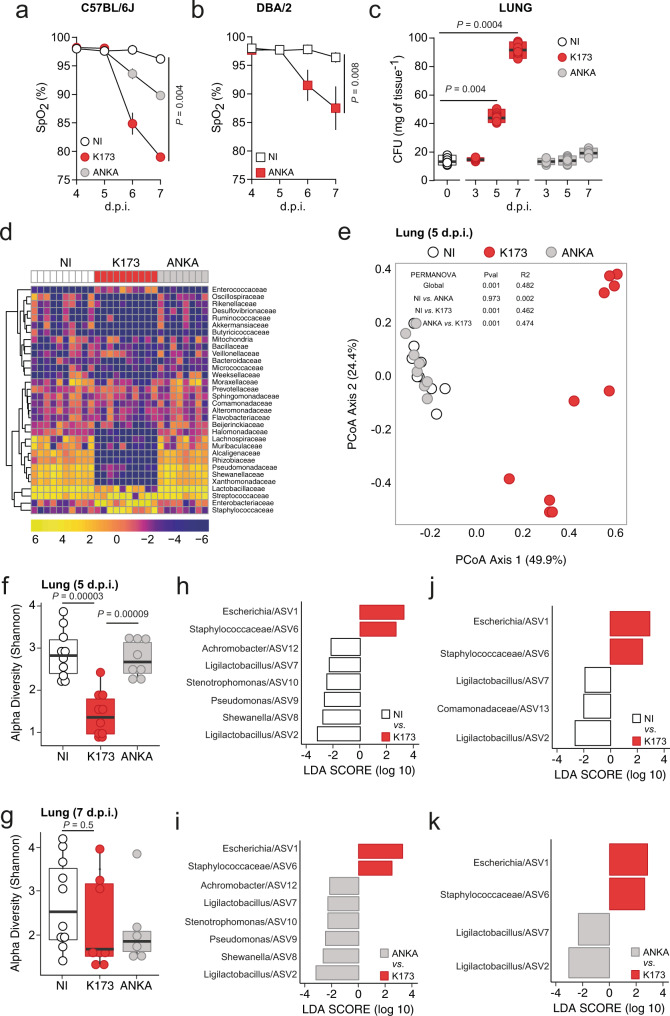
Severe malaria can manifest itself with a variety of well-recognized clinical phenotypes that are highly predictive of death - severe anaemia, coma (cerebral malaria), multiple organ failure, and respiratory distress. The reasons why an infected individual develops one pathology rather than another remain poorly understood. Here we use distinct rodent models of infection to show that the host microbiota is a contributing factor for the development of respiratory distress syndrome and host mortality in the context of malaria infections (malaria-associated acute respiratory distress syndrome, MA-ARDS). We show that parasite sequestration in the lung results in sustained immune activation. Subsequent production of the anti-inflammatory cytokine IL-10 by T cells compromises microbial control, leading to severe lung disease. Notably, bacterial clearance with linezolid, an antibiotic commonly used in the clinical setting to control lung-associated bacterial infections, prevents MA-ARDS-associated lethality. Thus, we propose that the host's anti-inflammatory response to limit tissue damage can result in loss of microbial control, which promotes MA-ARDS. This must be considered when intervening against life-threatening respiratory complications.


Conflict of interest statement

The authors declare no competing interests.

Figures

Fig. 1
Fig. 1. Lung microbiota dysbiosis is associated with ARDS during malaria infections.
a, b Time course measurement of oxygen saturation levels (SpO2) as determined by pulse-oximetry (Kruskal–Wallis) of C57BL/6J mice a infected with PbK173, PbANKA or non-infected (NI) controls (n = 8 per group; N = 2) or DBA/2 mice b infected with PbANKA or non-infected (NI) controls (n = 5 per group; N = 1). a, b Data are represented as mean with the bars representing s.e.m. c Time course measurement of CFUs (Kruskal–Wallis) in the lungs of C57BL/6J mice infected with PbK173 or PbANKA at day 3, 5 and 7 post infection (p.i.) and NI (n = 8 per group; N = 2). Data are represented as floating bar plots (minimum to maximum) with line at the middle representing median. d Heatmap of relative abundance of major microbial families in the lungs of C57BL/6J mice 5 days p.i. with PbK173 or PbANKA and NI (n = 8–10 per group, N = 1) is shown using a pseudo-logarithmic scale; each column represents one mouse. Each row represents a bacterial family. Rows were clustered using hierarchical clustering with Euclidean distance. e Beta diversity of lung microbial communities of C57BL/6J mice 5 days p.i. with PbK173 or PbANKA and NI (n = 8–10, N = 1). ASVs space was reduced using principal coordinate analysis (PCoA) with Bray-Curtis distance. The first and second principal coordinates were plotted, as well as the variability explained by each principal coordinates (values in brackets). f, g Alpha diversity (Shannon) of lung microbial composition upon infection of C57BL/6J mice on (f) day 5 p.i with PbK173 or PbANKA and NI; g day 7 p.i with PbK173 or PbANKA and NI (n = 6–10 per group, N = 1). Data are represented as boxplots. The lower and upper hinges represent the first and third quartiles. The upper whisker extends to the largest value but no further than 1.5 * inter-quartile range (IQR). The lower whisker extends to the smallest value or most 1.5 * IQR. The Centre hinge is the second quartile. For group comparison, we used Kruskal–Wallis followed by two-sided Mann–Whitney post hoc analysis with Holm correction. hk Differentially abundant ASVs (using Linear discriminant analysis effect size) from lungs of C57BL/6J mice (n = 6–10 per group, N = 1); h between NI and PbK173 at day 5 p.i. i Between PbANKA and PbK173 at day 5 p.i. j Between NI and PbK173 at day 7 p.i. k Between PbANKA and PbK173 at day 7 p.i. Source data are provided as a Source Data file.
Fig. 2
Fig. 2. iRBCs sequestration in the lungs mediates microbiota dysbiosis and promotes MA-ARDS.
a Parasite sequestration (Kruskal–Wallis) in the lungs of C57BL/6J mice on day 5 p.i. with Pb K173 or Pb ANKA and non-infected (NI) controls (n = 8 per group; N = 2). b Parasite sequestration (Kruskal–Wallis) in the lungs of DBA/2 mice on day 5 p.i. with Pb ANKA high parasitemia and Pb ANKA low parasitemia, Pb ANKAsmac- and NI controls (n = 7–8 per group; N = 2). c Time course measurement of CFUs (Kruskal–Wallis) in the lungs of DBA/2 mice infected with Pb ANKA MA-ARDS, Pb ANKA no MA-ARDS, Pb ANKAsmac- at days 3, 5, 7 and 12 p.i. and non-infected (NI) controls (n = 6–10 per group; N = 2). (ac) Data are represented as floating bar plots (minimum to maximum) with line at the middle representing median. d Heatmap of relative abundance of major microbial families in the lungs of DBA/2 mice 5 days p.i. with Pb ANKA high parasitemia, Pb ANKA low parasitemia, Pb ANKAsmac- and NI controls (n = 8–10 per group; N = 1). e Beta diversity analysis of lung microbial communities of DBA/2 mice 5 days p.i. with Pb ANKA high parasitemia, Pb ANKA low parasitemia, Pb ANKAsmac- and NI controls (n = 8–10 per group; N = 1). f, g Alpha diversity (for group comparison, we used Kruskal–Wallis followed by two-sided Mann–Whitney post hoc analysis with Holm correction) of lung microbial composition of DBA/2 mice at f day 5 p.i. with Pb ANKA high parasitemia, Pb ANKA low parasitemia, Pb ANKAsmac- and NI controls; or g day 7 p.i. with Pb ANKA high parasitemia, Pb ANKA low parasitemia, Pb ANKAsmac- and NI controls (n = 8-10 per group; N = 1). Data are represented as boxplots with whiskers. The lower and upper hinges represent the 1st and third quartiles. The upper whisker extends to the largest value but no further than 1.5 * inter-quartile range (IQR). The lower whisker extends to the smallest value or most 1.5 * IQR. The Centre hinge is the second quartile. Differentially abundant ASVs (using Linear discriminant analysis Effect Size) from lungs of DBA/2 mice comparing (h) Pb ANKA high parasitemia and Pb ANKA low parasitemia at day 5 p.i.; i NI and Pb ANKA high parasitemia at day 5 p.i.; and j Pb ANKAsmac- and Pb ANKA high parasitemia (n = 4–9 per group; N = 1) at day 5 p.i. k Survival (left panel, Log-rank Mantel-Cox) and parasitemia (right panel, mean ± s.e.m.; linear regression) following infection of DBA/2 mice with either Pb ANKA or Pb ANKAsmac- (n = 8 per group; N = 2) parasites. Source data are provided as a Source Data file.
Fig. 3
Fig. 3. Host microbiota is a contributing factor for MA-ARDS.
a Survival (upper panel, Log-rank Mantel-Cox) and parasitemia (lower panel, mean ± s.e.m.; linear regression) following Pb K173 infection of SPF or GF (n = 10 per group; N = 2) C57BL/6J mice. b Histological images of lungs of SPF (upper panel) and GF (lower panel) C57BL/6J mice following Pb K173 infection. Severe alveolar oedema (red asterisk) in the lung (collected at day 8 days p.i.) of SPF mice was observed. No changes were observed in the lung (collected at day 28 p.i.) of surviving GF mice (lower panel). Scale bar = 100 µm. c Survival (upper panel, Log-rank Mantel-Cox) and parasitemia (lower panel, mean ± s.e.m.; linear regression) following Pb ANKA infection of SPF or GF (n = 5 per group; N = 1) C57BL/6J mice. d Histological images of brains of SPF (upper panel) and GF (lower panel) C57BL/6J mice following Pb ANKA infection. In both groups in the mid-brain, marked haemorrhages (red asterisk) and grey matter vacuolization (black asterisk) were observed. Scale bar = 100 µm. e Survival (upper panel, Log-rank Mantel-Cox) and parasitemia (lower panel, mean ± s.e.m.; linear regression) following Pb K173 infection of linezolid treated C57BL/6J mice compared to non-treated, infected controls (n = 10 per group; N = 2). The shaded area represents the duration of antibiotic treatment starting at day 3 p.i. f Survival (upper panel, Log-rank Mantel-Cox) and parasitemia (lower panel, mean ± s.e.m.; linear regression) following Pb K173 infection of linezolid treated C57BL/6J mice compared to non-treated, infected controls (n = 10 per group; N = 2). The shaded area represents the duration of antibiotic treatment starting at 5 days p.i. g Survival (upper panel, Log-rank Mantel-Cox) and parasitemia (lower panel, mean ± s.e.m.; linear regression) following Pb ANKA infection of linezolid treated C57BL/6J mice compared to non-treated, infected controls (n = 10 per group; N = 2). h Total CFU’s (Kruskal–Wallis) in the lungs of C57BL/6 J mice 5 days p.i. with Pb K173 and treated with linezolid starting at 3 days p.i. compared to non-treated, Pb K173 infected and NI (n = 6 per group; N = 2) controls. i Parasite sequestration in the lungs of C57BL/6J mice (Kruskal–Wallis test followed by Wilcoxon post hoc analysis) 5 days p.i. with Pb K173 and treated with linezolid starting at 3 days p.i. compared to non-treated Pb K173 infected and NI (n = 6 per group; N = 2) controls. Data are represented as floating bar plots (minimum to maximum) with line at the middle representing median. Source data are provided as a Source Data file.
Fig. 4
Fig. 4. Increased IL-10 levels in the lungs mediate bacterial expansion in lung.
a Total mRNA (Kruskal–Wallis) and b protein levels (Kruskal–Wallis test followed by Wilcoxon post hoc analysis) of IL-10 in the lungs of C57BL/6J mice 5 days p.i. with Pb K173 (n = 6; N = 2) or Pb ANKA (n = 6; N = 2) compared to NI controls (n = 6; N = 2). c Survival (upper panel, Log-rank Mantel-Cox) and parasitemia (lower panel, mean ± s.e.m.; linear regression) following Pb K173 infection of IgG (n = 10; N = 2) or αIL-10R neutralizing antibody (n = 10; N = 2) treated C57BL/6J mice. d Survival (upper panel, Log-rank Mantel-Cox) and parasitemia (lower panel, mean ±  s.e.m.; linear regression) following Pb ANKA infection of IgG (n = 10; N = 2) or αIL-10R neutralizing antibody (n = 10; N = 2) treated C57BL/6J mice. e Total CFUs (Kruskal–Wallis test followed by Wilcoxon post hoc analysis) in the lungs of C57BL/6J mice 5 days p.i. with Pb K173 (n = 6; N = 2) treated with αIL-10R neutralizing antibody and compared to IgG treated (n = 6; N = 2) and NI (n = 6; N = 2) controls (n.d. = not detected). f Parasite sequestration (Kruskal–Wallis test followed by Wilcoxon post hoc analysis) in the lungs of C57BL/6J mice 5 days p.i. with Pb K173 (n = 6; N = 2) treated with αIL-10R neutralizing antibody and compared to IgG treated (n = 6; N = 2) and NI (n = 6; N = 2) controls. g IL-10 protein levels (Kruskal–Wallis test followed by Wilcoxon post hoc analysis) in the lungs of C57BL/6J mice 5 days p.i. with Pb K173 treated with linezolid starting 3 days p.i. (n = 4; N = 1) compared to NI (n = 4; N = 1) and non-treated, Pb K173 (n = 4; N = 1) infected controls. h Parasite sequestration (Kruskal–Wallis test followed by Wilcoxon post hoc analysis) in the lungs of C57BL/6J mice 5 days p.i. with Pb K173 treated with linezolid starting 3 days p.i. (n = 4; N = 1) compared to NI (n = 4; N = 1) and non-treated, Pb K173 (n = 4; N = 1) infected controls. a, b, eh Data are represented as floating bar plots (minimum to maximum) with line at the middle representing median. Source data are provided as a Source Data file.
Fig. 5
Fig. 5. αβ T cells producing IL-10 promote altered bacterial colonization in the lung and MA-ARDS.
a Average percentage of different immune cells (upper pie chart, the gating was done on live CD45+ cells) and T cells (lower pie chart, the gating was done on live CD45+CD3+ cells) producing IL-10 in the lungs of C57BL/6J Vert-X IL-10GFP reporter mice 5 days p.i. with Pb K173 (n = 6; N = 2). b Total CD4+ (n = 6; N = 2) and c CD8+ T (n = 6; N = 2) cells producing IL-10 in the lungs of C57BL/6J Vert-X IL-10GFP reporter mice 5 days p.i. with Pb K173 compared to NI controls (n = 6; N = 2) (Two-sided Mann–Whitney test). d Representative FACS plots of CD4+ (left panel) and CD8+ (right panel) T cells producing IL-10 in the lung of C57BL/6J Vert-X IL-10GFP reporter mice 5 days p.i. with Pb K173 compared to NI controls. The gating was done on live CD45+CD3+ cells. e Survival (upper panel, Log-rank Mantel-Cox) and parasitemia (lower panel, mean ± s.e.m.; linear regression) following Pb K173 infection of IgG (n = 10; N = 2) or αCD4 depleting antibody (n = 10; N = 2) treated C57BL/6J mice, starting at day 3 p.i. f Survival (upper panel, Log-rank Mantel-Cox) and parasitemia (lower panel, mean ± s.e.m.; linear regression) following Pb K173 infection of IgG (n = 10; N = 2) or αCD8 depleting antibody (n = 10; N = 2) treated C57BL/6J mice, starting at day 3 p.i. g Total CFUs (Kruskal–Wallis test followed by Wilcoxon post hoc analysis) in the lungs of C57BL/6J mice 5 days p.i. with Pb K173 treated with either αCD4 (n = 8; N = 2) or αCD8 (n = 8; N = 2) depleting antibody compared to IgG treated (n = 8; N = 2) and NI (n = 8; N = 2) controls. h Parasite sequestration (Kruskal–Wallis test followed by Wilcoxon post hoc analysis) in the lungs of C57BL/6J mice 5 days p.i. with Pb K173 treated with either αCD4 (n = 4; N = 1) or αCD8 (n = 4; N = 1) depleting antibody compared to IgG treated (n = 4; N = 1) and NI (n = 4; N = 1) controls. i Survival (upper panel, Log-rank Mantel-Cox) and parasitemia (lower panel, mean ± s.e.m.; linear regression) of control TCRα-/- mice, or upon adoptive transfer of wild-type or IL-10-/- T cells, infected with Pb K173 (n = 12; N = 2). b, c, g, h Data are represented as floating bar plots (minimum to maximum) with line at the middle representing median. Source data are provided as a Source Data file.

References

    1. Matthay MA, et al. Acute respiratory distress syndrome. Nat. Rev. Dis. Prim. 2018;5:1–22. - PMC - PubMed
    1. Short KR, Kroeze EJBV, Fouchier RAM, Kuiken T. Pathogenesis of influenza-induced acute respiratory distress syndrome. Lancet Infect. Dis. 2014;14:57–69. doi: 10.1016/S1473-3099(13)70286-X. - DOI - PubMed
    1. Rubenfeld GD, et al. Incidence and outcomes of acute lung injury. N. Engl. J. Med. 2005;353:1685–1693. doi: 10.1056/NEJMoa050333. - DOI - PubMed
    1. Villar J, et al. The ALIEN study: incidence and outcome of acute respiratory distress syndrome in the era of lung protective ventilation. Intensive Care Med. 2011;37:1932–1941. doi: 10.1007/s00134-011-2380-4. - DOI - PubMed
    1. World Health Organization (WHO), World Malaria Report (2021).

Publication types