. 2022 Jun 29;13(1):3743.
doi: 10.1038/s41467-022-31415-z.

WASp modulates RPA function on single-stranded DNA in response to replication stress and DNA damage

Affiliations

WASp modulates RPA function on single-stranded DNA in response to replication stress and DNA damage

Seong-Su Han et al. Nat Commun. .

Abstract

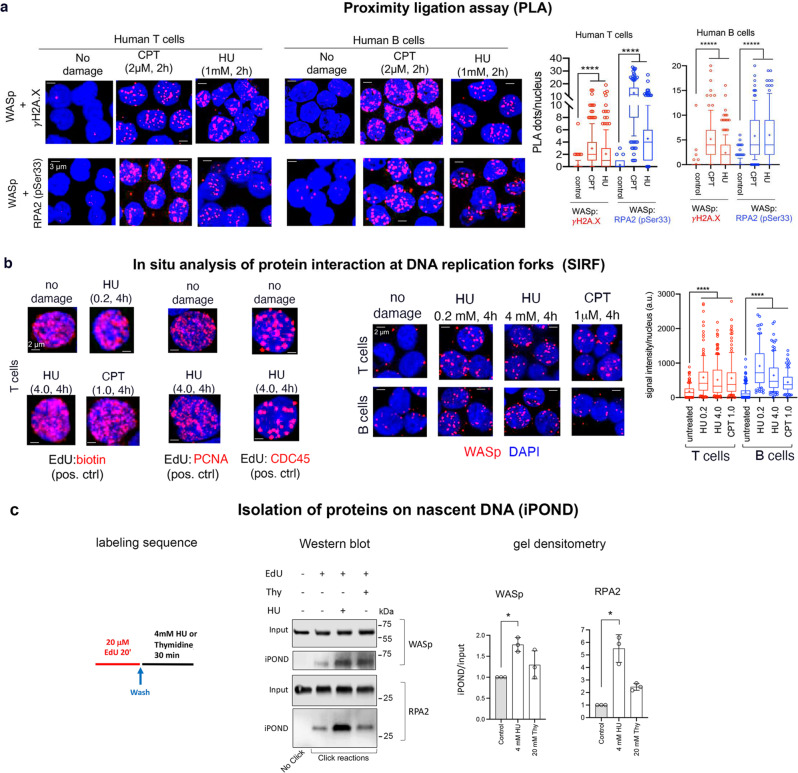
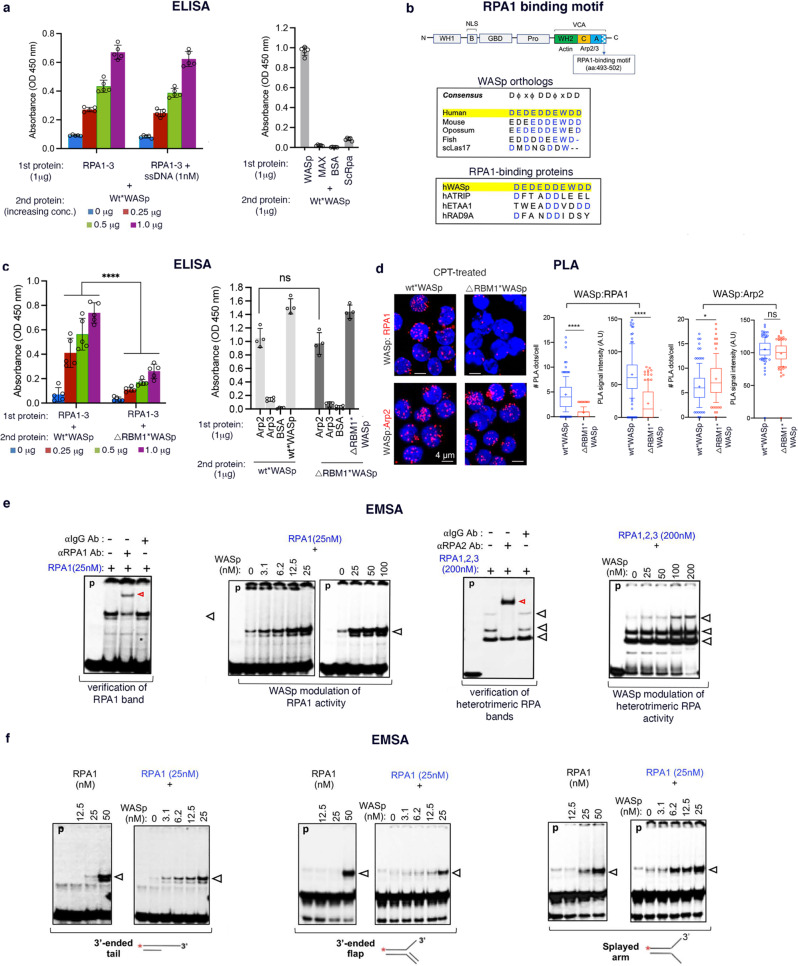
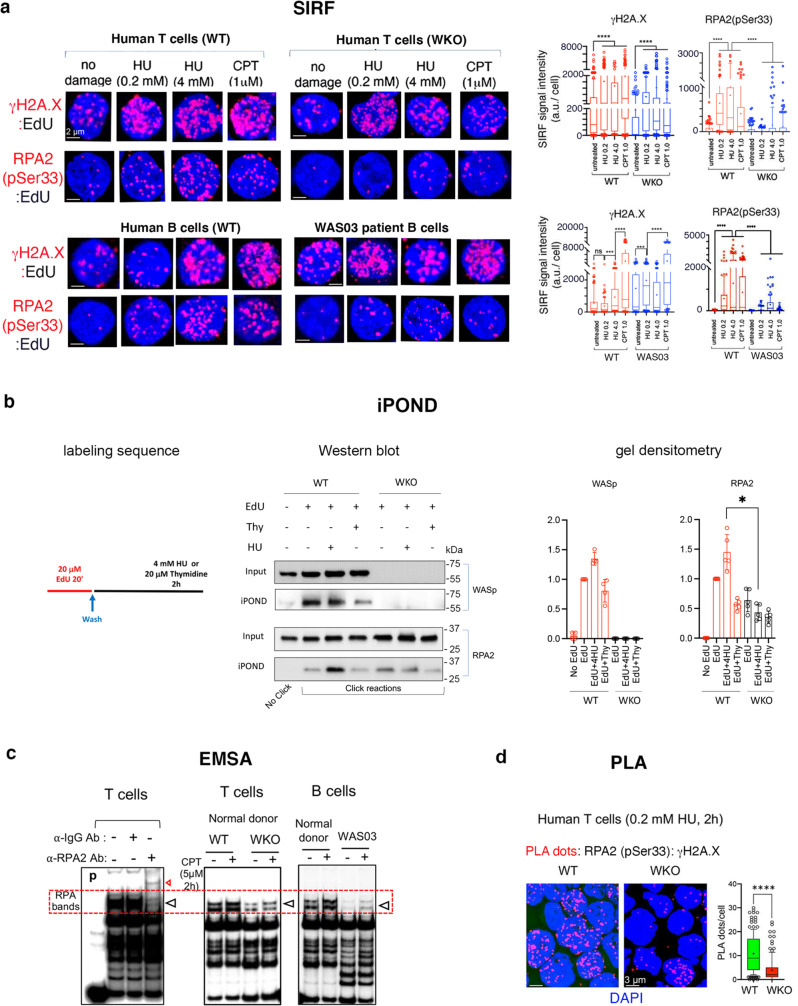
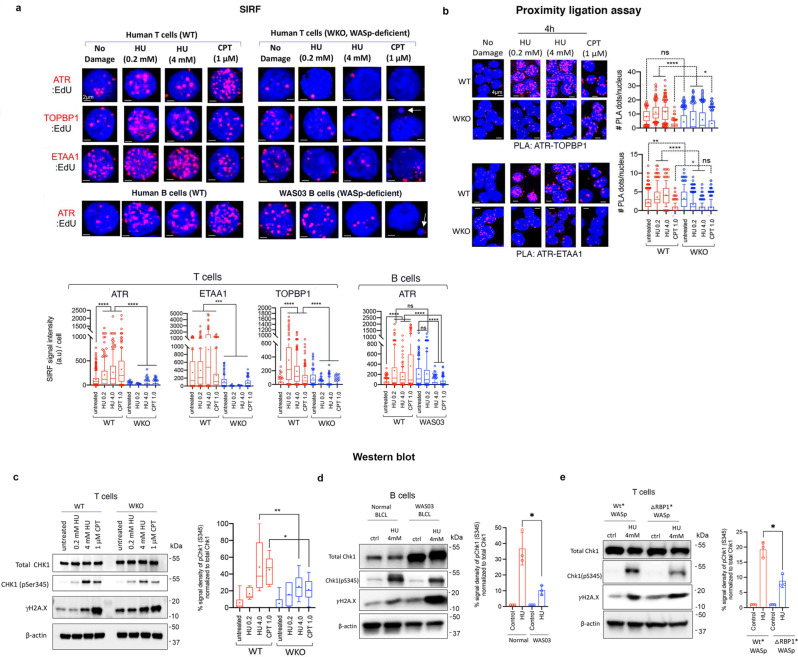
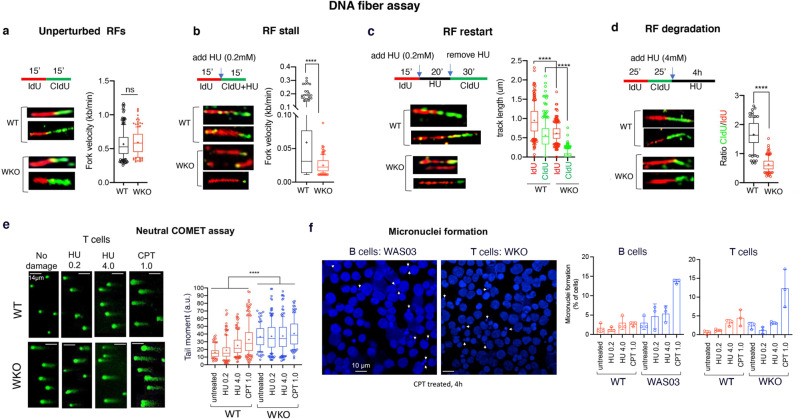
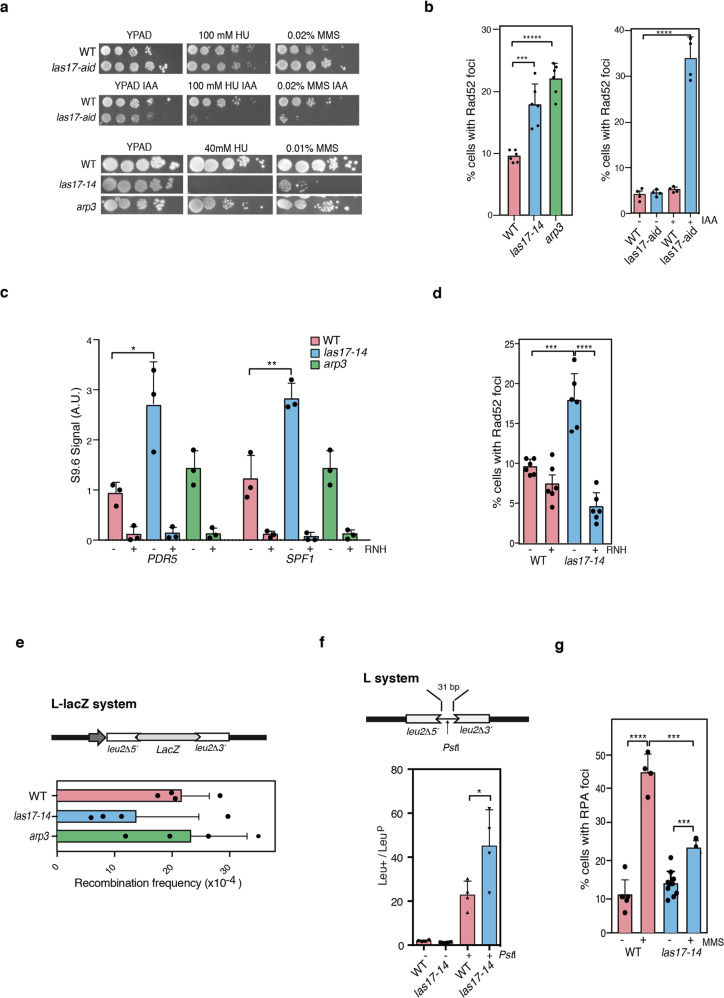
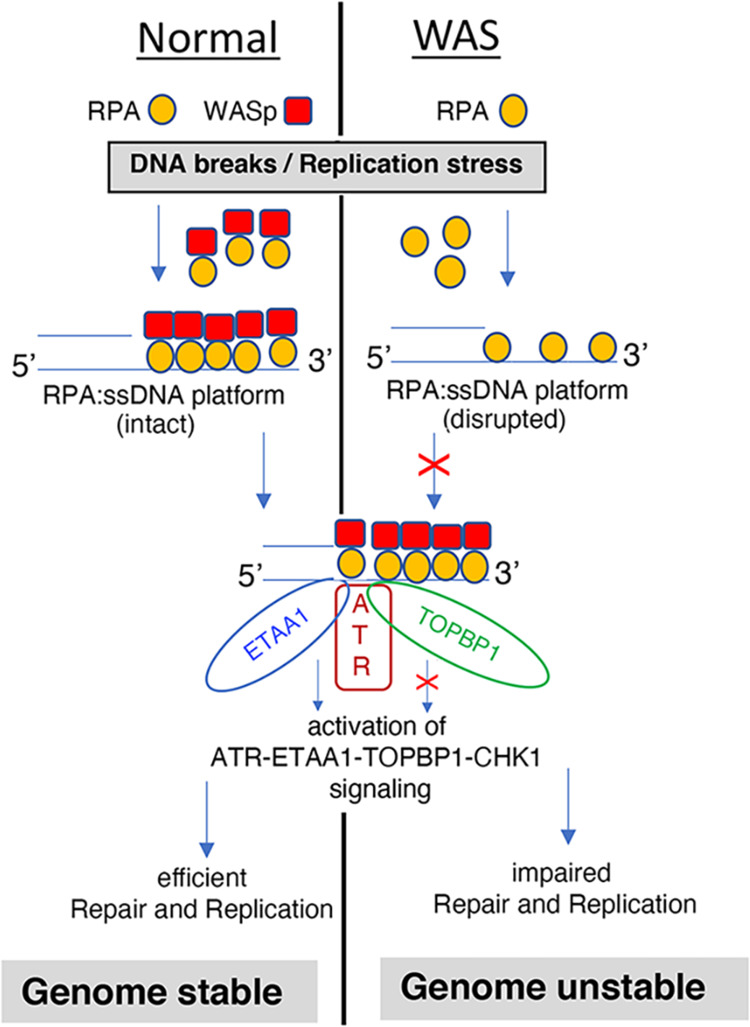
Perturbation in the replication-stress response (RSR) and DNA-damage response (DDR) causes genomic instability. Genomic instability occurs in Wiskott-Aldrich syndrome (WAS), a primary immunodeficiency disorder, yet the mechanism remains largely uncharacterized. Replication protein A (RPA), a single-strand DNA (ssDNA) binding protein, has key roles in the RSR and DDR. Here we show that human WAS-protein (WASp) modulates RPA functions at perturbed replication forks (RFs). Following genotoxic insult, WASp accumulates at RFs, associates with RPA, and promotes RPA:ssDNA complexation. WASp deficiency in human lymphocytes destabilizes RPA:ssDNA-complexes, impairs accumulation of RPA, ATR, ETAA1, and TOPBP1 at genotoxin-perturbed RFs, decreases CHK1 activation, and provokes global RF dysfunction. las17 (yeast WAS-homolog)-deficient S. cerevisiae also show decreased ScRPA accumulation at perturbed RFs, impaired DNA recombination, and increased frequency of DNA double-strand break (DSB)-induced single-strand annealing (SSA). Consequently, WASp (or Las17)-deficient cells show increased frequency of DSBs upon genotoxic insult. Our study reveals an evolutionarily conserved, essential role of WASp in the DNA stress-resolution pathway, such that WASp deficiency provokes RPA dysfunction-coupled genomic instability.


Conflict of interest statement

The authors declare no competing interests.

Figures

Fig. 1
Fig. 1. WASp is a DNA stress-response protein.
a Proximity ligation assay (PLA). Confocal immunofluorescence (IF) microscopy showing a representative set of collapsed composite IF images from a z-stack of ~30-40 images acquired per optical field. Shown are the PLA signals between the indicated interacting proteins induced by the indicated genotoxins or no damage control in human T and B cells, along with their corresponding PLA statistics in box-and-whisker plots (whiskers @10–90%, horizontal bar denotes median, “+” denotes mean). In both panels, unpaired, two-tailed, Mann-Whitney nonparametric p values ****<0.0001, n = 150 cells/condition. Scale bar: 3 μm. b In situ analysis of protein interactions at replication forks (SIRF). Right, Representative z-stack collapsed composite confocal IF images showing SIRF signals between 5-ethynyl-2’-deoxyuridine (EdU)-labeled nascent DNA and the indicated protein in steady-state (no damage) or after HU- or CPT-induced DNA perturbation, along with their corresponding statistics (n = 100 cells). Left, representative SIRF images of positive and negative controls (ctrl), under replicative stress or no stress/damage. Statistical details as per a. Scale bar: 2 μm. c Isolation of proteins on nascent DNA (iPOND). Left, schematic of nascent DNA labeling, in which red line denotes DNA labelled with EdU, followed by black line denoting chase into media containing either hydroxyurea (replication stressor) or thymidine (control for true replication proteins that will not enrich in this sample due to EdU displacement). Middle, shows Western blots of input and iPOND purified proteins under indicated conditions, including no EdU sample (no-click negative control). Right, bar graphs depict gel densitometric quantitation of iPOND/Western blot signals normalized to their respective inputs. n = 3, +SEM. Mann-Whitney unpaired two-tailed nonparametric p-value *<0.01. Source data are provided as a Source Data file.
Fig. 2
Fig. 2. WASp directly binds RPA and enables RPA binding to ssDNA.
a, ELISA. In vitro protein-protein interaction monitored by ELISA for the indicated purified proteins at the indicated concentrations. 1st protein is coated onto the plate at a fixed concentration; 2nd protein is added at the indicated increasing concentrations. hRPA1-3, human heterotrimeric complex of RPA1, 2, 3; hMAX, human Myc-associated factor X; BSA, bovine serum albumin; ScRpa, Saccharomyces Rpa; WT*WASp, wild-type WASp. The displayed data are mean+SEM, n = 5 independent assays. The intrinsic property of WASp molecules to spontaneously oligomerize (via VCA:VCA-domain interaction) served as +ve control, and is shown for the highest concentration (1 μg) of WT*WASp protein. b Schematic of the multi-modular domain structure of human WASp showing WH1-domain, Basic-domain containing the NLS (B), GTPase-binding domain (GBD), Polyproline-domain (Pro), VCA-domain (WH2, C, A subdomains), in which the location of evolutionarily conserved RPA1-binding motif (RBM1) within the VCA-domain is shown. WH2 (aka, V region) binds monomeric G-actin, C and A regions bind Arp2/3-complex. Amino-acid alignments of human WASp’s RBM1 with those of other proteins and species are shown, in which residues that are conserved (in evolution) and common (with other RPA1-binding proteins) are highlighted in blue. The prototypical RBM1-consensus is shown at the top, D: Aspartic acid; ϕ: hydrophobic or charged side-chain amino acid; x: any amino acid. c ELISA. Shown is the binding efficiency of purified heterotrimeric RPA1-3 protein (on left) or purified Arp proteins (on right) with either purified Wt*WASp or RBM1-deleted WASp mutant (ΔRBM1*WASp) at the indicated concentrations. Physical interactions of WT*WASp:WT*WASp and mutant ΔRBM1*WASp:ΔRBM1*WASp (from spontaneous oligomerization of their respective VCA-domains) served as +ve controls. n = 3 independent assays, mean+SEM. p-value: ****<0.0001. ns, nonsignificant by Mann–Whitney unpaired two-tailed nonparametric. d Proximity ligation assay. Z-stack collapsed composite confocal IF images showing PLA signals (dots) between the indicated protein pairs after transfecting WASp-deficient human T cells with GFP-tagged Wt*WASp or ΔRBM1*WASp mutant after CPT-induced damage. The images/data are for the GFP+ cells enriched by FACS-sorting. Box plots are from n = 150 cells, Mann-Whitney unpaired two-tailed nonparametric p-value: ****<0.0001; * = 0.01; ns, nonsignificant. DAPI (in blue) demarcates the nucleus. Scale bar: 4 μm. EMSA. Assays performed using the indicated purified proteins at the indicated concentrations (nM) against fixed concentration of ssDNA (panel e) or other 3’-ended DNA structures (panel f). Data is representative of at least 3 replicates per condition. Red arrows indicate antibody super-shifted RPA band; other arrows indicate location of non-shifted RPA bands. Other related EMSA results are shown in Supplementary Fig. S2.
Fig. 3
Fig. 3. WASp-deficiency impairs RPA occupancy at perturbed RFs.
a, SIRF. Shown are the representative z-stack collapsed composite confocal IF images and their box-and-whisker plots quantifying the enrichment of the indicated proteins at RFs, unperturbed or perturbed by the indicated genotoxins (post-4h treatment) in human T and B cells. n = 150 cells, Mann-Whitney unpaired two-tailed nonparametric p-value: **** <0.0001. WKO T cells and WAS03 B cells are WASp-deficient (see Supplementary Fig. S2f for WASp expression profiles). a.u. denotes arbitrary units. Scale bar: 2μm. b, iPOND. Left panel, schematic of nascent DNA labeling, description as per the legend for Fig. 1c. Middle panel, shows Western blots of input and iPOND purified proteins under indicated conditions for wild-type (WT) and WAS knock-out (WKO) isogenic pair of human T cells. iPOND signal for WASp in WKO T cells served as a negative control. Right panel, bar graphs depict gel densitometric quantitation of iPOND/Western blot band signals normalized to their respective inputs. n = 3, +SEM. Mann-Whitney unpaired two-tailed nonparametric *<0.01. Source data are provided as a Source Data file. c, EMSA/super-shift assays. Experiments performed using purified nuclear extracts from the indicated cell types, treated (+) or not (-) with CPT at indicated dose/duration. The location of endogenous heterotrimeric RPA bands, as verified by anti-RPA2 antibody mediated super-shifted band (left panel, red arrow denotes super-shifted band). Red hatched box denotes the general location of the endogenous RPA1-3 bands, verified by supershift. p, probe only lane. Data is representative of n = 3 independent assays. d, PLA. Representative z-stack collapsed composite confocal IF images and their quantification showing RPA2 localization at HU-mediated replication-stress sites (monitored by γH2A.X) post-2h in T cells, wild-type (WT) and WASp-deficient (WKO). Box-and-whisker plots, n = 150 cells, Mann-Whitney unpaired two-tailed nonparametric p-value: **** <0.0001. Scale bar: 3μm.
Fig. 4
Fig. 4. WASp deficiency disrupts ATR signaling at perturbed RFs and impairs global CHK1 activation.
a, SIRF. Shown are the representative z-stack collapsed composite confocal IF images and their box-and-whisker plots quantifying the enrichment of the indicated proteins at RFs, unperturbed or perturbed by the indicated genotoxins and doses (post-4h treatment) in human T and B cells, WT or WASp-deficient (WKO T cells; WAS03 B cells). In box-and-whisker plots, whiskers @10-90%, horizontal bar denotes median, “+” denotes mean. The box-and-whisker plots are from n = 150 cells analyzed, Mann-Whitney unpaired two-tailed nonparametric p-value: **** <0.0001; *** <0.001; ns, nonsignificant. a.u. denotes arbitrary units. Arrows show WASp-deficient T and B cells with micronuclei formation (See Fig. 5f for additional data on micronuclei). Scale bar: 2μm. b, PLA. Representative z-stack collapsed composite confocal IF images and their quantification plots for the indicated protein:protein interactions in T cells, wild-type (WT) and WASp-deficient (WKO), treated with the indicated genotoxin (post-4h treatment), or no treatment. In box-and-whisker plots, whiskers @10-90%, horizontal bar denotes median, “+” denotes mean. The box-and-whisker plots are from n = 150 cells analyzed, Mann-Whitney unpaired two-tailed nonparametric p-value: **** <0.0001; ** <0.001; *<0.01; ns, nonsignificant. Scale bar: 4μm. ce, Western blot. Representative images of the indicated proteins expressed in total cell extracts of human T cells, WT and WKO (panel c), B cell lines (Normal donor and WAS03 patient) (panel d), and WASp-deficient (WKO) human T cells stably-transfected to re-express GFP-tagged WT*WASp or RPA1-binding domain-deleted mutant of WASp (ΔRBP1*WASp) (panel e) treated with the indicated genotoxin for 4 h or untreated (control, ctrl), along with their gel densitometric analyses. In box-and-whisker plots, whiskers @10-90%, horizontal bar denotes median, “+” denotes mean. n = 4 independent assays. In box plots shown in panels d and e, data is for mean±SEM. n = 3 independent assays. Mann-Whitney unpaired two-tailed p-value: *<0.01, **<0.001. In panel c, the p-values for HU (0.2 low-dose) and untreated (no damage) comparing WT and WKO T cells were not significant. Source data are provided as a Source Data file.
Fig. 5
Fig. 5. WASp-deficiency undermines RF integrity and causes genome instability.
ad, DNA fiber assays showing 4 different labeling protocols, their representative replication track images, and their corresponding RF statistics in human T cells (WT, WKO isogenic pair) under unperturbed (panel a) or HU-perturbed (panels b–d) conditions. For assays in which the 1st and 2nd labeling times were similar, RF velocity was calculated (panels a, b), whereas, when labeling times were dissimilar, the individual RF track length was calculated (panel c). For quantifying RF degradation (panel d), the ratio of 2nd:1st labeled track lengths was calculated only in those tracks that showed sequential, but not overlapping, dual-labeling. The box-and-whisker plots (whiskers @10-90%, horizontal bar denotes median, “+” denotes mean) are from n = 150 tracks analyzed from 3 independent experiments. Mann-Whitney unpaired two-tailed nonparametric p-value: **** <0.0001; ns, nonsignificant. See Supplementary Fig. S4 for additional RF data in human B cells. e, Representative confocal IF images of the neutral comet assay reporting on the frequency of DSBs in human T cells (WT, WKO), untreated or treated with indicated genotoxins and doses for 4 h. The box-and-whisker plots (whiskers @10-90%, horizontal bar denotes median, “+” denotes mean) reporting on the tail-moment are from n = 150 cells analyzed, Mann-Whitney unpaired two-tailed nonparametric p-value: **** <0.0001. a.u. denotes arbitrary units. Scale bar: 14μm. f, Left, Representative confocal IF images of micronuclei formation (indicated by arrows) in DAPI-stained WASp-deficient T and B cells are shown for the CPT condition at 4 h. Right, statistical bar graph data, mean +SEM, n = 150 cells for all genotoxin conditions from n = 3 independent assays. Scale bar: 10 μm.
Fig. 6
Fig. 6. Las17-deficiency renders S. cerevisiae hypersensitive to genotoxins.
a. 10-fold serial dilution assays of the indicated yeast strains with and without 2 mM of auxin (IAA), in plates containing hydroxyurea (HU) and methyl methanesulfonate (MMS) at the indicated dose or concentration. b. Percentages of nuclei with Rad52 foci in indicated strains (WT, las17-14, las17-aid, arp3), cultured in media with or without auxin (IAA) addition. Mean +SEM, n = 6 independent experiments. ***p < 0.001, ****p < 0.0001 by Paired Student´s t-test. c. Enrichment signals of DNA-RNA immunoprecipitation (DRIP) using S9.6 antibody at the indicated gene loci of the yeast genome, detected by qPCR in WT, las17-14 and arp3 mutant cells. For the RNase H1 (RNH) control sample, half of the DNA was treated in vitro with 8 µl of RNase H overnight at 37 °C. Mean +SEM, n = 3 independent experiments. *p < 0.05, **p < 0.01 by Paired Student´s t-test. A.U. denotes arbitrary units. d. Percentage of nuclei with Rad52 foci in WT and las17-14 mutant with (+) or without (-) RNase H1 (RNH) overexpression in vivo. Mean+SEM, n = 5 independent experiments. ***p < 0.001, ****p < 0.0001 by Paired Student´s t-test. e. Recombination frequencies of WT and las17-14 and arp3 mutants transformed with pRS314 L-LacZ carrying a leu2 direct-repeat system and cultured in selective medium. Mean+SEM, n = 4 independent experiments. f. Ratio of Leu+ recombinants (SSA events):Leup non-recombinants (papilators on SC-Leu reflecting original plasmids containing both repeats) arising after transformation of WT and las17-14 strains with uncut and cut (DSB) pRS316-L plasmid carrying the leu2 direct-repeat system. The cut site created by PstI is located between the repeats. Mean+SEM, n = 4 independent experiments, *p < 0.05 by Paired Student´s t-test. Light boxes represent leu2Δ3’ and leu2Δ5’ truncated alleles of LEU2 used as 600-bp direct repeats. g. Percentage of nuclei with RPA foci in WT and las17-14 mutant with (+) or without (-) MMS treatment. Mean+SEM, n = 5 independent experiments. ***p < 0.001, ****p < 0.0001 by Paired Student´s t-test.
Fig. 7
Fig. 7. Graphical abstract of WASp:RPA alliance in genome stability.
Shown are the sequential steps in the HR pathway involved in DNA repair or replication reactions, and the effect of WASp deficiency on RPA-coupled mis-regulation of these critical steps/reactions, which ultimately lead to genome instability, spontaneously or insult-induced.

Similar articles

Cited by

References

    1. Derry JM, Ochs HD, Francke U. Isolation of a novel gene mutated in Wiskott-Aldrich syndrome. Cell. 1994;78:635–644. doi: 10.1016/0092-8674(94)90528-2. - DOI - PubMed
    1. Snapper SB, Rosen FS. Wiskott-Aldrich syndrome protein (WASP): roles in signaling and cytoskeletal organization. Annu Rev. Immunol. 1999;17:905–929. doi: 10.1146/annurev.immunol.17.1.905. - DOI - PubMed
    1. Taylor MD, et al. Nuclear role of WASp in the pathogenesis of dysregulated TH1 immunity in human Wiskott-Aldrich syndrome. Sci. Transl. Med. 2010;2:37ra44. doi: 10.1126/scitranslmed.3000813. - DOI - PMC - PubMed
    1. Sarkar K, Sadhukhan S, Han SS, Vyas YM. Disruption of hSWI/SNF complexes in T cells by WAS mutations distinguishes X-linked thrombocytopenia from Wiskott-Aldrich Syndrome. Blood. 2014;124:3409–3419. doi: 10.1182/blood-2014-07-587642. - DOI - PMC - PubMed
    1. Sarkar K, Sadhukhan S, Han SS, Vyas YM. SUMOylation-disrupting WAS mutation converts WASp from a transcriptional activator to a repressor of NF-κB response genes in T cells. Blood. 2015;126:1670–1682. doi: 10.1182/blood-2015-05-646182. - DOI - PMC - PubMed

Publication types

MeSH terms