. 2022 Jun 29;13(1):3732.
doi: 10.1038/s41467-022-31399-w.

Inactivation of the Hippo tumor suppressor pathway promotes melanoma

Affiliations

Inactivation of the Hippo tumor suppressor pathway promotes melanoma

Marc A Vittoria et al. Nat Commun. .

Abstract

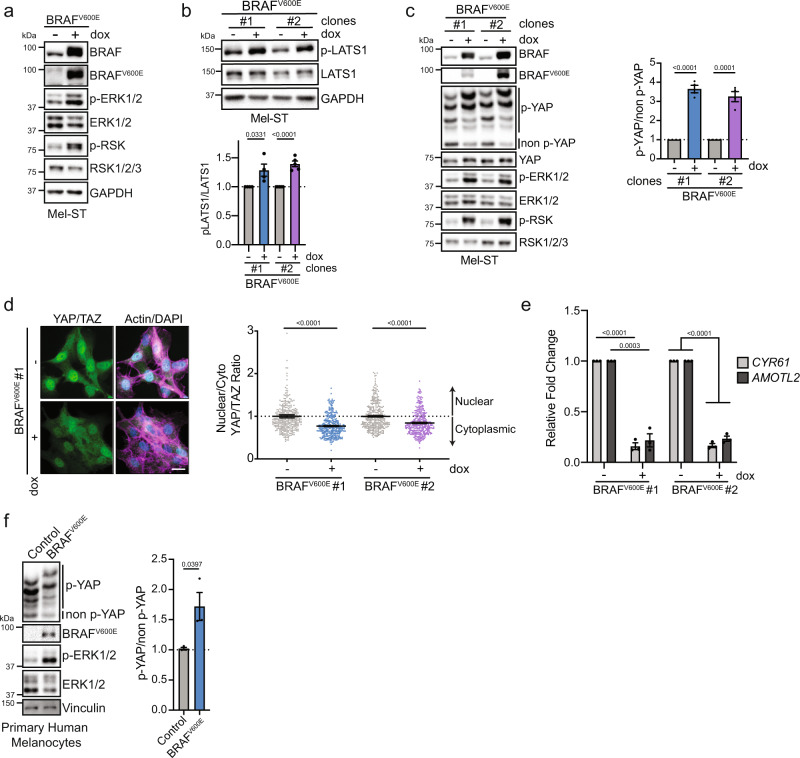
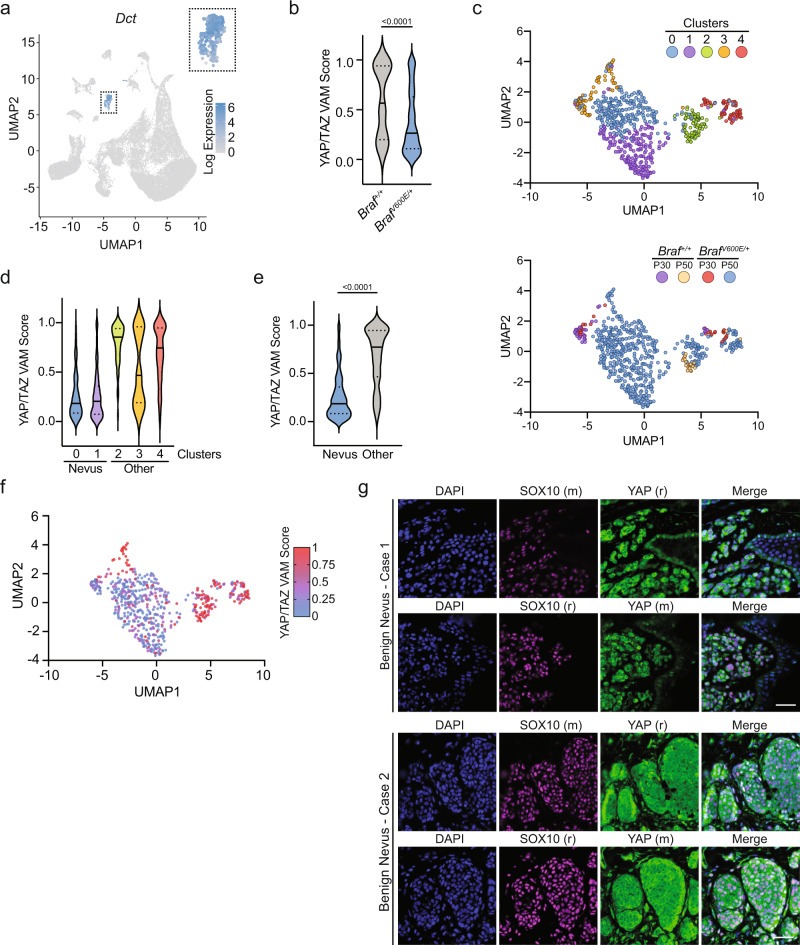
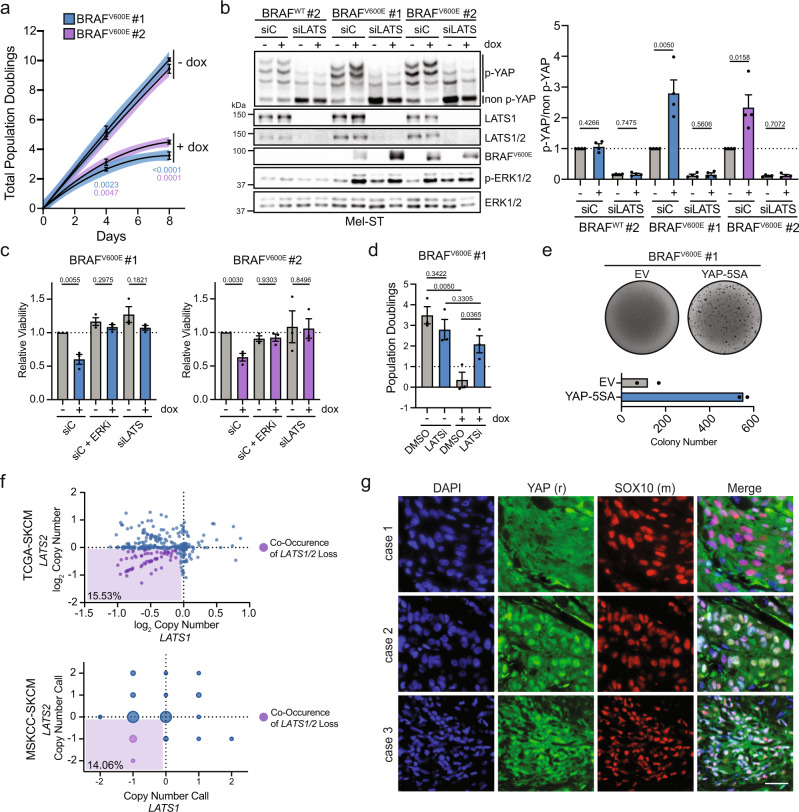
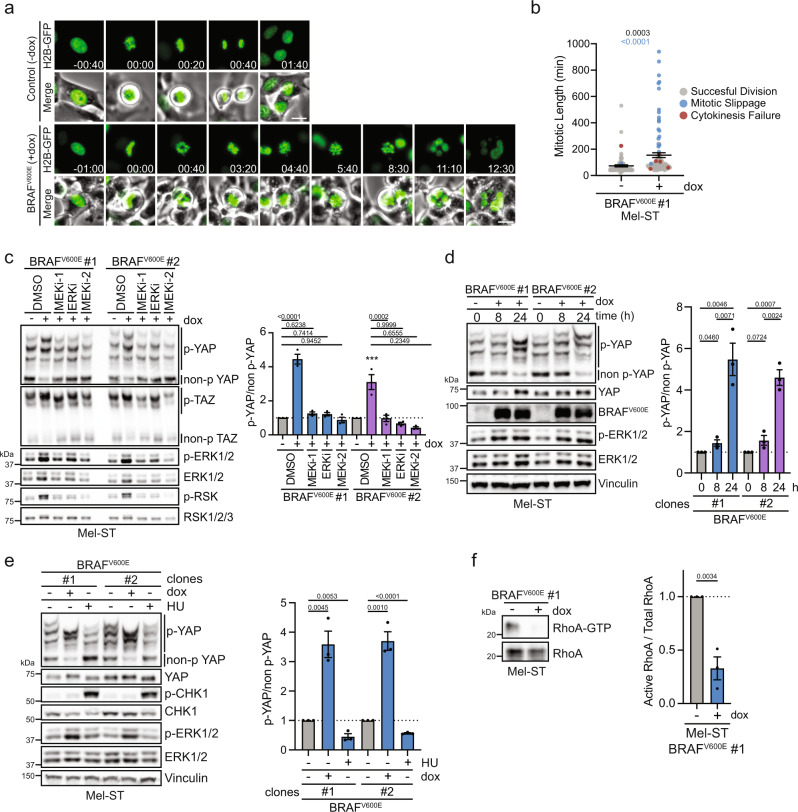
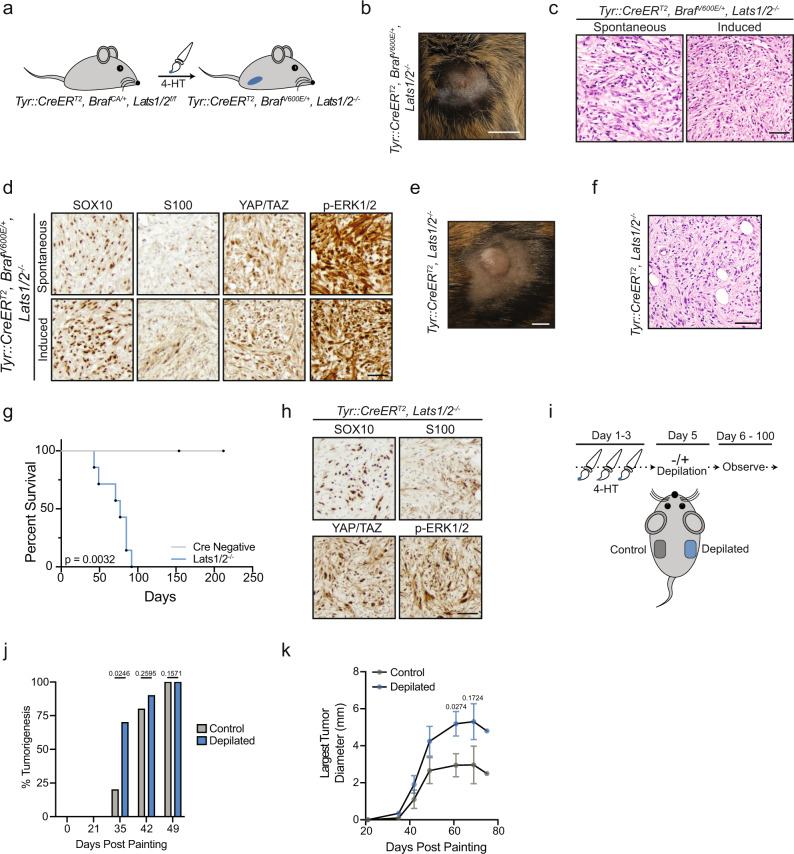
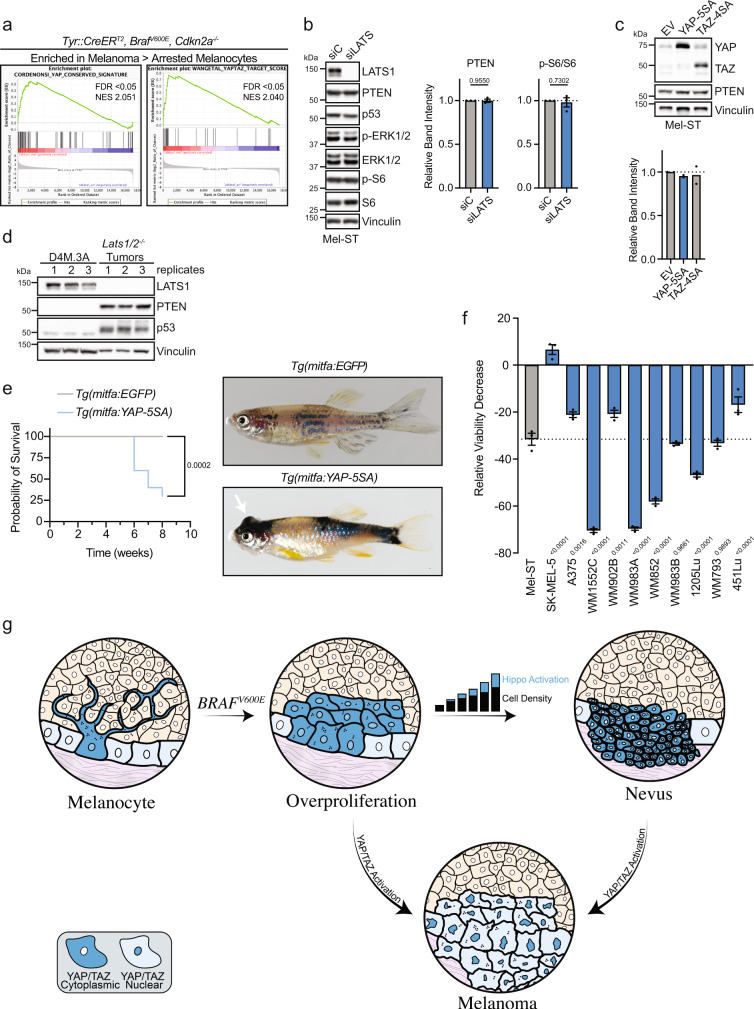
Melanoma is commonly driven by activating mutations in the MAP kinase BRAF; however, oncogenic BRAF alone is insufficient to promote melanomagenesis. Instead, its expression induces a transient proliferative burst that ultimately ceases with the development of benign nevi comprised of growth-arrested melanocytes. The tumor suppressive mechanisms that restrain nevus melanocyte proliferation remain poorly understood. Here we utilize cell and murine models to demonstrate that oncogenic BRAF leads to activation of the Hippo tumor suppressor pathway, both in melanocytes in vitro and nevus melanocytes in vivo. Mechanistically, we show that oncogenic BRAF promotes both ERK-dependent alterations in the actin cytoskeleton and whole-genome doubling events, which independently reduce RhoA activity to promote Hippo activation. We also demonstrate that functional impairment of the Hippo pathway enables oncogenic BRAF-expressing melanocytes to bypass nevus formation and rapidly form melanomas. Our data reveal that the Hippo pathway enforces the stable arrest of nevus melanocytes and represents a critical barrier to melanoma development.


Conflict of interest statement

The authors declare no competing interests.

Figures

Fig. 1
Fig. 1. BRAFV600E activates the Hippo tumor-suppressor pathway.
a Representative immunoblot (IB) of dox-inducible BRAFV600E Mel-ST cells cultured ± dox for 24 h. b IB of two different dox-inducible BRAFV600E Mel-ST clones cultured ± dox for 24 h (n ≥ 4 independent experiments, graph shows mean relative intensity ± SEM, two-tailed unpaired t test). c Left, IB of two dox-inducible BRAFV600E Mel-ST clones cultured ± dox for 24 h; Right, intensity quantification of YAP phosphorylation from phos-tag gel (n = 4 independent experiments, graph shows mean relative intensity ± SEM, two-tailed unpaired t test). d Left, representative immunofluorescence staining of YAP/TAZ (green) alone or merged with DNA (DAPI, blue) and actin (Phalloidin, magenta) in indicated BRAFV600E Mel-ST clone; right, quantification of nuclear to cytoplasmic ratio of mean YAP/TAZ fluorescence (n > 300 cells from three independent experiments, graph shows mean ± SEM, scale bar = 20 µm, two-tailed Mann–Whitney test). e Relative expression of indicated genes from RT-PCR in BRAFV600E Mel-ST clones cultured ± dox for 24 h (n = 3 independent experiments, graph shows mean ± SEM, two-tailed unpaired t test). f Left, IB of primary human melanocytes infected with lentivirus that express control vector (H2B-GFP) or BRAFV600E; right, intensity quantification of YAP phos-tag (n = 3 independent experiments, graph shows mean ± SEM, two-tailed unpaired t test). Source Data are provided as a Source Data file.
Fig. 2
Fig. 2. BrafV600E-expressing nevus melanocytes display decreased YAP/TAZ signaling.
a UMAP of relative Dct expression of all single cells from nevus containing murine skin identifying a cluster of cells representing melanocytes from GSE154679. b YAP/TAZ VAM scores for melanocytes from indicated genotypes (n = 46 for Braf+/+, n = 543 for BrafV600E/+, two-tailed Mann–Whitney test). c Top, UMAP of melanocytes colored by subcluster; Bottom, UMAP of melanocytes colored by genotype and animal age (n = 589). d YAP/TAZ VAM score plotted by melanocyte subcluster. e YAP/TAZ VAM score comparing nevus (clusters 0, 1) and other melanocytes (clusters 2, 3, 4) (nevus n = 408, other n = 181, two-tailed Mann–Whitney test). f UMAP of melanocytes colored by gradient indicating YAP/TAZ VAM score. g Representative immunofluorescence staining of indicated proteins in two benign nevi cases with two different sets of antibodies, (r) = rabbit, (m) = mouse, DAPI (blue), YAP (green), SOX10 (magenta), scale bar = 50 µm. Source Data are provided as a Source Data file.
Fig. 3
Fig. 3. Oncogenic BRAF-induced Hippo pathway activation restrains melanocyte growth.
a Population doubling assay of two dox-inducible BRAFV600E Mel-ST clones ± dox (n = 3 independent experiments, lines represent second-order polynomial non-linear fit, line color represents 95% confidence interval (dots show mean ± SEM, two-tailed unpaired t test). b Left, representative IB of two dox-inducible Mel-ST clones treated with control siRNA (siC) or LATS1 and LATS2 siRNAs (siLATS) ± dox for 24 h; right, intensity quantification of YAP phos-tag (n = 4 independent experiments, graph shows mean ± SEM, two-tailed unpaired t test). c Relative viability of Mel-ST cell lines treated with indicated siRNA or drugs for a 4-day period (n = 3 independent experiments in technical quintuplicate, graphs show mean ±  SEM, two-tailed unpaired t test). d Number of population doublings of indicated dox-inducible Mel-ST clone over 4 days treated with either DMSO or a LATS1/2 inhibitor (LATSi), ± dox (n = 3 independent experiments, graph shows mean ± SEM, two-tailed unpaired t test). e Representative crystal violet stain of dox-inducible BRAFV600E Mel-ST cell line expressing indicated genes grown in dox-containing soft agar with quantification below (n = 2 independent experiments in technical triplicate, graph shows mean). f Plot of log2 copy-number values from TCGA-SKCM or GISTIC 2.0 calls from MSKCC-SKCM databases for the genes LATS1 and LATS2; bottom left percent is the frequency of LATS1/2 co-heterozygous loss. g Representative immunofluorescence staining of indicated proteins in three human melanoma cases, scale bar = 25 µm). Source Data are provided as a Source Data file.
Fig. 4
Fig. 4. Prolonged MAPK activation leads to cytoskeletal defects and Hippo activation.
a Representative fluorescence and phase-contrast images from a live-cell video of dox-inducible BRAFV600E Mel-ST cells expressing the chromosome marker H2B-GFP (green) cultured ± dox (scale bar = 25 µm, hh:mm). b Plot of mitotic duration and fate of individually tracked mitoses from (a) (n > 80 mitoses per condition from two independent experiments, graph shows mean ± SEM, dots represent individually tracked mitoses, black P value represent mitotic duration significance, two-tailed unpaired t test, blue P value represent significance for difference in frequency of whole-genome doubling events, two-sided Fisher’s exact test). c Left, IB of indicated dox-inducible BRAFV600E Mel-ST cell lines cultured ± dox for 24 h along with indicated drugs at the following doses: ERKi (20 nM), MEKi-1 (10 µM), MEKi-2 (20 nM); right, intensity quantification of YAP phos-tag (n = 3 independent experiments, graph shows mean ± SEM, one-way ANOVA with multiple comparisons). d Left, IB of dox-inducible BRAFV600E Mel-ST cell lines cultured ± dox for indicated time; right, intensity quantification of YAP phos-tag (n = 3 independent experiments, graph shows mean ± SEM, two-tailed unpaired t test). e Left, representative IB of dox-inducible BRAFV600E Mel-ST cell lines treated ± dox for 24 h or with 1 mM hydroxyurea for 6 h; right, intensity quantification of YAP phos-tag (n = 3 independent experiments, graph shows mean ± SEM, two-tailed unpaired t test). f Representative IB of RhoA-GTP pulldown in indicated dox-inducible BRAFV600E Mel-ST cell line ± dox; right, intensity quantification of RhoA-GTP to total RhoA (n = 3 independent experiments, graph shows mean ± SEM, two-tailed unpaired t test). Source Data are provided as a Source Data file.
Fig. 5
Fig. 5. Lats1/2 deletion promotes melanoma formation.
a Cartoon depicting 4-HT painting experiment. b Representative image of induced BrafV600E/Lats1/2−/− mouse tumor, scale bar = 0.5 cm. c Representative hematoxylin and eosin staining of spontaneous or induced tumors from BrafV600E/Lats1/2−/− mice, scale bar = 50 µm (n > 3 spontaneous tumors, n = 2 induced tumors from BrafV600E/Lats1/2−/− mice). d Representative IHC of indicated proteins, scale bar = 40 µm (n > 3 spontaneous tumors, n = 2 induced tumors from BrafV600E/Lats1/2−/− mice). e Representative image of induced Lats1/2−/− mouse tumor, scale bar = 0.5 cm. f Representative hematoxylin and eosin staining of induced flank tumor from Lats1/2−/− mouse, scale bar = 50 µm (n > 6 independent mice with similar results). g Survival plot from painting to study endpoint of Lats1/2−/− mice with 4-HT painted on flanks (Cre negative n = 4, Lats1/2−/− n = 7, log-rank test). h Representative IHC of indicated proteins, scale bar = 40 µm (n ≥ 3 Lats1/2−/− mice). i Cartoon depicting depilation experiment in Lats1/2−/− mice. j Percent palpable tumorigenesis in Lats1/2−/− mice at indicated time points (n = 10 mice, two-tailed unpaired t test). k Diameter of largest tumor on each animal measured at indicated time points (n ≥ 3 tumors measured at each timepoint with error bars ± SEM, ten mice total, two-tailed unpaired t test). Source Data are provided as a Source Data file.
Fig. 6
Fig. 6. YAP activation promotes melanomagenesis.
a GSEA performed on GSE61750 comparing enrichment of YAP/TAZ signatures in melanoma to arrested melanocytes in indicated genotype (see Supplementary Fig. S7A, S7D). b Left, representative IB of Mel-ST parental cell line treated with control siRNA (siC) or LATS1 and LATS2 siRNAs (siLATS); right, quantification of PTEN and p-S6 proteins compared to loading control or total protein (n = 3 independent experiments, graphs show mean ± SEM, two-tailed unpaired t test). c Top, representative IB of Mel-ST parental cell line expressing indicated plasmids, EV: empty vector; bottom, quantification of PTEN compared to loading control (n = 2 independent experiments, graph shows mean). d IB comparing D4M.3 A cells and Lats1/2−/− tumor lysates where numbers represent replicates or different tumors, respectively (n = 3 independent experiments or mice). e Left, survival curve of zebrafish with indicated genotypes; right, representative images of zebrafish with indicated genotype (n = 14 independent EGFP fish, n = 10 independent YAP-5SA fish, log-rank test). f Graph shows relative viability decrease (%) in indicated cell lines treated with 10 µM MGH-CP1 for 4 days (n = 3 independent experiments in ≥technical quintuplicate, graph shows mean ± SEM, one-way ANOVA with Dunnett’s multiple comparisons test). g Schematic model in which we propose overproliferation of melanocytes following acquisition of oncogenic BRAFV600E leads to increases in local melanocyte density, which subsequently promotes Hippo pathway activation and contributes to growth arrest and nevus formation. Functional impairment of the Hippo pathway, leading to YAP/TAZ activation, enables melanocytes expressing BRAFV600E to evade stable growth arrest and promote the development of melanoma. Source Data are provided as a Source Data file.

References

    1. SEER*Explorer, National Program of Cancer Registries and Surveillance, Epidemiology, and End Results SEER*Stat Database: NPCR and SEER Incidence – U.S. Cancer Statistics Public Use Research Database, 2019 submission (2001–2017), United States Department of Health and Human Services, Centers for Disease Control and Prevention and National Cancer Institute. www.cdc.gov/cancer/uscs/public-use (2020).
    1. Cancer Genome Atlas, N. Genomic Classification of cutaneous melanoma. Cell. 2015;161:1681–1696. doi: 10.1016/j.cell.2015.05.044. - DOI - PMC - PubMed
    1. Shain AH, Bastian BC. From melanocytes to melanomas. Nat. Rev. Cancer. 2016;16:345–358. doi: 10.1038/nrc.2016.37. - DOI - PubMed
    1. Shain AH, et al. Genomic and transcriptomic analysis reveals incremental disruption of key signaling pathways during melanoma evolution. Cancer Cell. 2018;34:45–55.e4. doi: 10.1016/j.ccell.2018.06.005. - DOI - PMC - PubMed
    1. Dankort D, et al. Braf(V600E) cooperates with Pten loss to induce metastatic melanoma. Nat. Genet. 2009;41:544–552. doi: 10.1038/ng.356. - DOI - PMC - PubMed

Publication types

Substances